 Open Access Article
Oxidative steam reforming of ethanol over MxLa2−xCe1.8Ru0.2O7−δ (M = Mg, Ca) catalysts: effect of alkaline earth metal substitution and support on stability and activity†
Ho-Chen Hsiehac,
Ping-Wen Tsaia,
Yuan-Chia Changa,
Sheng-Feng Wenga,
Hwo-Shuenn Sheucd,
Yu-Chun Chuangd and
Chi-Shen Lee *ab
*ab
aDepartment of Applied Chemistry, National Chiao Tung University, 1001 University Rd., Hsinchu 30010, Taiwan. E-mail: chishen@mail.nctu.edu.tw
bCenter for Emergent Functional Matter Science, National Chiao Tung University, Hsinchu 30010, Taiwan
cGraduate Degree Program of Science and Technology of Accelerator Light Source, National Chiao Tung University, Hsinchu 30010, Taiwan
dNational Synchrotron Radiation Research Center, Hsinchu, 30010, Taiwan
First published on 5th December 2019
Abstract
Alkaline earth metal substitutions on the A-site of pyrochlore oxide MxLa2−xCe1.8Ru0.2O7−δ (M = Mg, Ca) were studied as catalyst materials for oxidative/autothermal steam reforming of ethanol (OSRE/ATR). The as-prepared oxides were synthesized by a combustion method and characterized using powder X-ray diffraction (PXRD), and X-ray photoelectron and absorption spectroscopy (XPS and XAS). PXRD Rietveld analysis and elemental analysis (ICP-AES) support the formation of a pyrochlore-type structure (space group Fd![[3 with combining macron]](https://www.rsc.org/images/entities/char_0033_0304.gif) m) with a distorted coordination environment. The substitution of Mg2+ and Ca2+ ions affects the oxidation states of Ce4+/3+ and Run+ ions and creates oxygen vacancies, which leads to enhanced catalytic activity and reduced ethylene selectivity. A long-term stability test showed optimized catalysts Mg0.3La1.7Ce1.8Ru0.2O7−δ and Ca0.2La1.8Ce1.8Ru0.2O7−δ with SH2 = 101(1)% and SH2 = 91(2)% under OSRE conditions. The initial operation temperatures were lower than that of the unsubstituted catalyst La2Ce1.8Ru0.2O7−δ. Catalysts supported on La2Zr2O7 showed stable OSRE/ATR performance and low carbon deposition compared to catalysts supported on Al2O3. We ascribe the enhanced activity to well-dispersed alkaline earth metal and Ru ions in a solid solution structure, synergistic effects of (Mg, Ca)2+/Ce3+/4+/Run+ ions, and a strong catalyst–support interaction that optimized the ethanol conversion and hydrogen production.
m) with a distorted coordination environment. The substitution of Mg2+ and Ca2+ ions affects the oxidation states of Ce4+/3+ and Run+ ions and creates oxygen vacancies, which leads to enhanced catalytic activity and reduced ethylene selectivity. A long-term stability test showed optimized catalysts Mg0.3La1.7Ce1.8Ru0.2O7−δ and Ca0.2La1.8Ce1.8Ru0.2O7−δ with SH2 = 101(1)% and SH2 = 91(2)% under OSRE conditions. The initial operation temperatures were lower than that of the unsubstituted catalyst La2Ce1.8Ru0.2O7−δ. Catalysts supported on La2Zr2O7 showed stable OSRE/ATR performance and low carbon deposition compared to catalysts supported on Al2O3. We ascribe the enhanced activity to well-dispersed alkaline earth metal and Ru ions in a solid solution structure, synergistic effects of (Mg, Ca)2+/Ce3+/4+/Run+ ions, and a strong catalyst–support interaction that optimized the ethanol conversion and hydrogen production.
1. Introduction
Energy is indispensable in our daily lives and about 80% of energy relies on the combustion of fossil fuels. The production of pollutants such as COx, NOx, CHx, and SOx generated during energy generation from fossil fuels severely damages our environment.1–3 To resolve the prospective crisis, many researchers have devoted their attention and efforts to renewable energy resources.4–6 Among these available sources, hydrogen is a prospective energy carrier because it burns cleanly without emitting pollutants, and it has a high energy density (120–142 MJ kg−1) compared to other hydrocarbon fuels.7–9Hydrogen production from the reforming of ethanol is one of the potential fuel processes that could help alleviate our dependence on fossil fuels.10–13 As a result, it has been widely investigated. In recent years, many researchers have investigated ethanol conversion that combines oxygen, water, and ethanol. The addition of oxygen facilitates exothermic reactions from total or partial oxidation to provide energy for endothermic steam reforming reactions. Depending on the conditions, the processes are named oxidative (OSRE) or autothermal (ATR) steam reforming procedures. The OSR/ATR process is considered to be an energy efficient and attractive ethanol conversion process.14
To date, the most studied catalysts for OSRE processes are transition metal-based catalysts (e.g. Co, Ni, Ru, Rh and Ir) with supporting materials such as Al2O3, ZrO2 and SiO2.15–17 The catalysts employed for the OSRE process may be degraded due to a sintered catalyst and carbon deposition. Supporting materials also play an important role in maintaining an even distribution of the catalyst and suppressing the carbon deposition rate.18 Some studies show the promotion effect over supporting materials by adding either alkali or alkaline metal oxides. For example, alkaline earth or rare earth oxides (MgO, CaO, La2O3, CeO2, and Y2O3) were used as promoter materials to enhance the stability of catalysts on OSRE because they provide more basic sites on the oxide surface to facilitate the adsorption/activation of CO2, reduce carbon deposition, and prevent the aggregation of active catalysts.19–23 Graschinsky et al. studied Rh(1%)/MgAl2O4/Al2O3 for OSRE and found enhanced performance due to the effect of MgAl2O4 on the surface of Al2O3.24 Another way to promote catalytic activity is to include the fluorite-type structure CeO2 as the promoter material with an active metal catalyst. Deluga et al. demonstrated that using 5 wt% Rh/CeO2/Al2O3 and Pt/CeO2 as catalysts in a double-bed reactor could promote hydrogen selectivity reaching 130% at C/O ∼ 0.7 in OSRE.25 In our previous work, we studied the effect of controlled morphologies of ceria nanocrystals, Ce1−xMxO2 (M = Ti, Zr, and Hf), on the catalytic activity of 5 wt% (Ru, Rh)/Ce1−xMxO2 catalysts, which revealed high performance due to the specially exposed facets on the catalyst; however, the facets were unstable after long-term use.26
Recently, mixed-metal oxides with active metal ions have also been found to exhibit good activity as catalysts in relation to the ethanol reforming process.27 Various metal oxides, such as perovskite, spinel, hydrotalcites, nano-oxyhydride, and pyrochlore, have been reported for OSRE process.28–36 Chen et al. investigated the effect of a LaBO3 (B = Ni, Co, Fe, Mn) perovskite structure on OSRE. The thermal stability and oxygen vacancies affected the catalytic activity and stability for OSRE.37 Sania M. de Lima et al. studied the perovskite structure of La1−xCexNiO3 on OSRE. Good performance was found with a high oxygen storage capacity and oxygen mobility on OSRE.38 Wang et al. studied La1−xCaxFe1−xCoxO3 as a catalyst for SRE/OSRE and found that the A-site substituted with Ca2+ and cobalt ions leaving/entering the lattice of the perovskite structure enhanced activity and suppressed the sintering of the catalyst.39 M. Morales et al. investigated the catalytic activity and stability of La0.6Sr0.3CoO3−δ on SRE and OSRE. This showed higher selectivity of hydrogen with a good stability for OSRE.40 Huang et al. investigated the NiAl2O4–FeAl2O4 spinel oxide structure as a catalyst for the ATR of ethanol; it showed an optimized hydrogen selectivity of ∼109% at 600 °C.41 Espitia-Sibaja et al. investigated layered oxide hydrotalcites containing CoMgAl mixed ions for OSRE, which showed that the amount of Co3+ species catalysts affected the content of the products.42 Pirez and Fang et al. used the catalysts CeNiHzOy and Mg2AlNixHzOy nano-oxyhydride materials in OSRE that produced about a 45% yield of hydrogen with low activation energy.43,44
Our group reported on the metal substituted pyrochlore-based catalysts that display enhanced catalytic performance and stability for OSRE. The sintering effect on the catalyst was suppressed, and the amount of deposited carbon was reduced. The catalyst, La2Ce1.8Ru0.2O7 (LCRO), showed a high performance of OSRE, and the synergetic effect between the Run+ and Ce3+/4+ ions enabled the catalyst to remain active during the OSRE process.45 Lithium ion substituted metal oxides, LixLa2−xCe1.8Ru0.2O7−δ (LLCRO), created oxygen vacancies that correlated with the formation of high oxidation states cations of Run+/Ce4+. However, the initial study showed that the as-prepared pyrochlore catalysts interacted with the conventional Al2O3 support during the stream test and led to a decomposed catalyst and degraded performance. To prevent the solid state reaction between the catalyst and support, we utilized La2Zr2O7 (LZO) as the supporting material. It significantly improved the stability of the catalyst in the OSRE process.46
In this work, alkaline earth metal substituted on an A-site pyrochlore structure was studied in order to understand the effect of the A-site substitution on the activity of the catalyst in the OSRE. The mix-occupied A-sites may modify the oxidation states of active metal ions in the B-sites (Ce4+/3+ and Run+) and create oxygen vacancies. The aim of this work was to study the effect of substituted alkaline earth metals on the A-site of a pyrochlore structure on the catalytic performance of the OSRE process. We systematically investigated the substitution of La3+ with alkaline earth cations Mg2+/Ca2+ on the A-site to MxLa2−xCe1.8Ru0.2O7−δ (M = Mg, Ca), and its OSRE performances were compared to La2Ce1.8Ru0.2O7−δ. The effect of the supporting material on the OSRE performance was determined under the OSR/ATR processes using catalysts supported by Al2O3 or La2Zr2O7.
2. Experiment
2.1 Synthesis and characterization
Alkaline earth metal substituted pyrochlore oxides MxLa2−xCe1.8Ru0.2O7−δ (M = Mg, Ca) with controlled stoichiometries of M/La (M = Mg, Ca) were prepared by the sol–gel method. All methods use an approach described elsewhere in detail.46 The materials of the two groups with Ca- and Mg-doped samples were made at 600 °C and 900 °C for 5 h, respectively.Detailed structural properties for the materials were characterized by powder X-ray diffraction (PXRD) (Bruker D8 Advance Bragg-Brentano-type, λ = 1.5418 Å). These samples were measured using a wavelength of 0.688 Å at Beam Line 01C2, NSRRC, Hsinchu, Taiwan. The standard sample LaB6 was used to correct the experimental environment at the beamline station. These data were measured at room temperature and used the Rietveld refinement method using GSAS programming.47–49
For synchrotron-based X-ray absorption experiments, XANES and EXAFS analyses were carried out at Beam Line 01C1. Powder samples were uniformly spread onto adhesive tape to measure data using a Lytle detector in the fluorescence mode. The XAS spectra of Ru K-edge were concomitantly recorded in the energy range of 21.867–22.86 keV. The normalization of the XANES data was accomplished according to previous procedures using the AUTOBK program algorithm. EXAFS data analysis was performed with the program FEFF 702.50–52 We recorded the XPS spectra of Mg2p, Ca2p, C1s, Ru3d, O1s, La3d and Ce3d core levels (ESCA PHI 1600 instrument, Al anode = 1486.6 eV). The spectra energy was calibrated using the C1s peak (binding energy 284.8 eV). The pressure in the chamber was less than 6.7 × 10⁻⁷ Pa for measurements. All spectra were analyzed with software package XPSPEAK4.1.53
The reduction temperature of the materials can be employed by using Temperature-Programmed Reduction (China Chromatography 660 instrument). The gas flowed (50 mL min−1) through the silica tube, comprising 10% H2 and 90% Ar. Approximately 60–100 mg of samples were loaded into a silica tube. The furnace temperature was raised to 900 °C at a rate of 10 °C min−1, and then, cooled with a furnace from 900 °C down to room temperature. The quantitative analysis of hydrogen consumption was integrated by PeakFitv4.11 software, using CuO as the calibration standard.
The surface area of the materials was usually determined by the Brunauer–Emmett–Teller method, which was analyzed by Micrometrics sorptometer Tri Star 3000. The particle size and morphology of the materials were acquired with scanning electron microscopy (JEOL JSM-7401F FE-SEM), and the images were examined at accelerating voltages with several magnifications.
2.2 Catalyst preparation and performance
All catalysts were prepared by means of the impregnation method. Commercial γ-Al2O3 and lab-made La2Zr2O7 were used as the supporting materials, sieved in 16 to 18 mesh and immersed in that catalyst-ethanol mixed solution. The supporting material of La2Zr2O7 was prepared according to the previous procedure.46 The mixed solution was dried at 90 °C, and then, the entire procedure was repeated at least five times to prepare metal oxide well dispersed on the supporting materials. The as-prepared catalysts, MgxLa2−xCe1.8Ru0.2O7−δ (MLCRO), CaxLa2−xCe1.8Ru0.2O7−δ (CLCRO), and La2Ce1.8Ru0.2O7−δ (LCRO), were used on Al2O3 and La2Zr2O7 to test the catalytic reaction. The weight ratio of the catalyst to the supporting material γ-Al2O3 was 1![[thin space (1/6-em)]](https://www.rsc.org/images/entities/char_2009.gif) :
:![[thin space (1/6-em)]](https://www.rsc.org/images/entities/char_2009.gif) 10, and the supporting material, La2Zr2O7, at 1
10, and the supporting material, La2Zr2O7, at 1![[thin space (1/6-em)]](https://www.rsc.org/images/entities/char_2009.gif) :
:![[thin space (1/6-em)]](https://www.rsc.org/images/entities/char_2009.gif) 20 were prepared for fixing the weight percentage of the catalyst. The catalysts used were analyzed with Raman spectroscopy, using a 5 mW He–Ne laser system working at 633 nm (THORLABS, HRR170 instrument). The powders were dispersed on the microslide, and each datum was acquired for a counting time of 60 s. Measurements of TGA used a thermal analyzer (NETZSCH STA 409PC) and the long-term used samples were heated to 800 °C at a rate of 10 °C min−1 in an oxygen flow of 60 mL min−1.
20 were prepared for fixing the weight percentage of the catalyst. The catalysts used were analyzed with Raman spectroscopy, using a 5 mW He–Ne laser system working at 633 nm (THORLABS, HRR170 instrument). The powders were dispersed on the microslide, and each datum was acquired for a counting time of 60 s. Measurements of TGA used a thermal analyzer (NETZSCH STA 409PC) and the long-term used samples were heated to 800 °C at a rate of 10 °C min−1 in an oxygen flow of 60 mL min−1.
Experimental OSRE was carried out in a fixed-bed quartz reactor (4 mm inner diameter and 12 cm length). The mass flow of 0.5 L min−1 (STP) used with 150–320 mg of the catalysts and support would equal a GHSV of 1.6 × 10⁵ h−1. The carbon-to-oxygen ratio was determined by the concentration of the ethanol and air, a factor that would affect the total and partial oxidation processes. A heating furnace was used to control the vaporization temperatures of the fuels and catalytic bed in the OSRE. Under OSR and ATR of ethanol, the fuels were pumped into the reactor which contained the three zone fired furnace. The first and second zone was maintained at 220–240 °C to mix the evaporating gas. A catalytic bed was loaded into the third heating zone, and the furnace temperature was preheated to initially activate the fuels. The third heating zone could be maintained at activation temperature in OSRE; in contrast, the furnace temperature of the third heating zone was turned off after the catalytic reaction proceeded to an autothermal reaction. These products were analyzed by a gas chromatograph (Agilent GC 7890A) with a thermal-conductivity detector (TCD) for H2, CO, CO2, and a flame-ionization detector (FID) for CH4, C2H4, C2H5OH, and CH3CHO. The carbon balance was calculated ±5%. The general expression to calculate the selectivity of product species is defined below:
n = 1 for C2-species; 2 for C1-species; n = 3 for hydrogen
3. Results
3.1 Physicochemical properties of MxLa2−xCe1.8Ru0.2O7−δ (M = Mg, Ca) solid solution
Fig. 1A and B show the X-ray diffraction pattern of Mg- and Ca-substituted MxLa2−xCe1.8Ru0.2O7−δ (M = Mg, Ca). The major diffraction peaks correspond to the pyrochlore phase with a cubic lattice of high-symmetry Fd![[3 with combining macron]](https://www.rsc.org/images/entities/char_0033_0304.gif) m (no. 227). As the Mg2+ content increased, diffraction peaks of MgxLa2−xCe1.8Ru0.2O7−δ patterns shifted to a high 2θ range, indicating a trend to a reduction in the unit cell dimension. Mg2+ (C.N. = 8, 0.89 Å) ions are smaller than La3+ (C.N. = 8, 1.16 Å) ions, and it was expected that the unit cell parameters would be reduced upon Mg2+ replacement with La3+ ions. The results shown in Fig. 1(C) are consistent with Vegard's law for the La3+ substitution for the smaller Mg2+ cations. A single phase of MgxLa2−xCe1.8Ru0.2O7−δ (MLCRO) was observed for x = 0.0–0.3 (denoted as LCRO, MLCRO01-03), and a La2O3 (P
m (no. 227). As the Mg2+ content increased, diffraction peaks of MgxLa2−xCe1.8Ru0.2O7−δ patterns shifted to a high 2θ range, indicating a trend to a reduction in the unit cell dimension. Mg2+ (C.N. = 8, 0.89 Å) ions are smaller than La3+ (C.N. = 8, 1.16 Å) ions, and it was expected that the unit cell parameters would be reduced upon Mg2+ replacement with La3+ ions. The results shown in Fig. 1(C) are consistent with Vegard's law for the La3+ substitution for the smaller Mg2+ cations. A single phase of MgxLa2−xCe1.8Ru0.2O7−δ (MLCRO) was observed for x = 0.0–0.3 (denoted as LCRO, MLCRO01-03), and a La2O3 (P![[3 with combining macron]](https://www.rsc.org/images/entities/char_0033_0304.gif) m1, ICSD 96196) impurity phase started to appear when x = 0.4. On the other hand, when the size of Ca2+ (C.N. = 8, 1.12 Å) is similar to that of La3+, the substitution of Ca2+ into the A sites results in the lattice remaining close to the unsubstituted La2Ce1.8Ru0.2O7−δ (LCRO). A single phase was observed for x = 0.0–0.2, and diffraction peaks from La2O3 impurities was observed when x was higher than 0.2. The results indicate that calcium ions were substituted into the CaxLa2−xCe1.8Ru0.2O7−δ (CLCRO) lattice in a range of 0.0 < x < 0.2 (denoted as CLCRO01, 02).
m1, ICSD 96196) impurity phase started to appear when x = 0.4. On the other hand, when the size of Ca2+ (C.N. = 8, 1.12 Å) is similar to that of La3+, the substitution of Ca2+ into the A sites results in the lattice remaining close to the unsubstituted La2Ce1.8Ru0.2O7−δ (LCRO). A single phase was observed for x = 0.0–0.2, and diffraction peaks from La2O3 impurities was observed when x was higher than 0.2. The results indicate that calcium ions were substituted into the CaxLa2−xCe1.8Ru0.2O7−δ (CLCRO) lattice in a range of 0.0 < x < 0.2 (denoted as CLCRO01, 02).
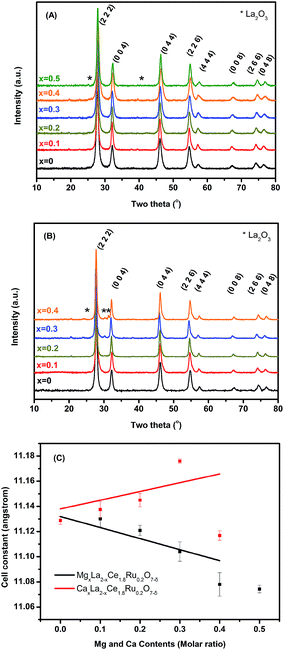 | ||
| Fig. 1 Phase identification of MxLa2−xCe1.8Ru0.2O7−δ (M = Mg, Ca): (A) powder X-ray diffraction of MLCRO0-05; (B) CLCRO0-04, and (C) cell constant refinement. | ||
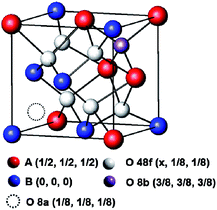
The synchrotron X-ray diffraction of the MxLa2−xCe1.8Ru0.2O7−δ (M = Mg, Ca) was characterized. The powder data on the highest substituted samples, MLCRO03 and CLCRO02, were refined by the Rietveld method, and these results are presented in Fig. S1 and Table S1.† The unsubstituted LCRO (P-type structure, Fd![[3 with combining macron]](https://www.rsc.org/images/entities/char_0033_0304.gif) m, no. 227) phase was used as an initial model. The occupation of the Ru/Ce was fixed with the as-prepared samples for MxLa2−xCe1.8Ru0.2O7−δ (M = Mg, Ca). The refinement of occupation and thermal parameters was constrained due to the correlation of both. There were two cation sites and three anion sites in the environment. The special crystallographic site 16d coordination was a distorted cube for a trivalent rare-earth cation; the special site 16c was a distorted octahedral for a tetravalent metal cation. There were three anion sites: the 48f and 8b sites were for O2− ions; and the 8a site was a vacant oxygen site, as shown in Scheme 1. The O (48f) atoms were connected to two (Mg, Ca)/La atoms and two Ru/Ce atoms. The O (48f) (x, 1/8, 1/8) positions for the parameter, x, increased from 0.367(2) to 0.392(2) for Mg- and 0.384(3) for the Ca-substituted structure due to partially substituted alkaline earth metal ions on the A-site, respectively. This affected the interatomic distances and bond angles, as shown in Table S1.† The results indicated that the A-site alkaline metal substitution, the structural environment was distorted and the oxidation state of Ce/Ru and oxygen vacancy needed to maintain the charge balance.
m, no. 227) phase was used as an initial model. The occupation of the Ru/Ce was fixed with the as-prepared samples for MxLa2−xCe1.8Ru0.2O7−δ (M = Mg, Ca). The refinement of occupation and thermal parameters was constrained due to the correlation of both. There were two cation sites and three anion sites in the environment. The special crystallographic site 16d coordination was a distorted cube for a trivalent rare-earth cation; the special site 16c was a distorted octahedral for a tetravalent metal cation. There were three anion sites: the 48f and 8b sites were for O2− ions; and the 8a site was a vacant oxygen site, as shown in Scheme 1. The O (48f) atoms were connected to two (Mg, Ca)/La atoms and two Ru/Ce atoms. The O (48f) (x, 1/8, 1/8) positions for the parameter, x, increased from 0.367(2) to 0.392(2) for Mg- and 0.384(3) for the Ca-substituted structure due to partially substituted alkaline earth metal ions on the A-site, respectively. This affected the interatomic distances and bond angles, as shown in Table S1.† The results indicated that the A-site alkaline metal substitution, the structural environment was distorted and the oxidation state of Ce/Ru and oxygen vacancy needed to maintain the charge balance.
The specific surface areas, ICP-AES, and crystal size data for the materials as prepared are summarized in Table 1. The surface areas of all the samples exhibited a lower surface area within a small range of 5 to 16 m2 g−1. The morphology and particle size were investigated with SEM (Fig. S2†), showed uneven shapes and particle sizes aggregated in a range of 10–25 nm due to a higher annealing temperature.
3.2 X-ray photoelectron spectra (XPS)
The surface properties, as well as the oxidation states of the constituent elements of MxLa2−xCe1.8Ru0.2O7−δ (M = Mg, Ca), were investigated by XPS. The XPS results of MLCRO were taken as a representative example. For MLCRO catalysts, Fig. 2(A) shows the La3d spectra of the substituted pyrochlore type structures. Four pairs of signals were observed from the La3d that correspond to the 3d5/2 and 3d3/2 levels for MLCRO. The binding energies of La3+ were 838 eV (La3d5/2) and 855 eV (La3d3/2) with their satellites at 834 eV and 851 eV, respectively. Other weak signals centered at 836 eV (La3d5/2) and 853 eV (La3d3/2) eV with their corresponding satellite peaks at 832 eV and 849 eV, which are attributed to the effects of structural distortion due to the Mg2+ and Run+ ions substitution on A and B sites, respectively.54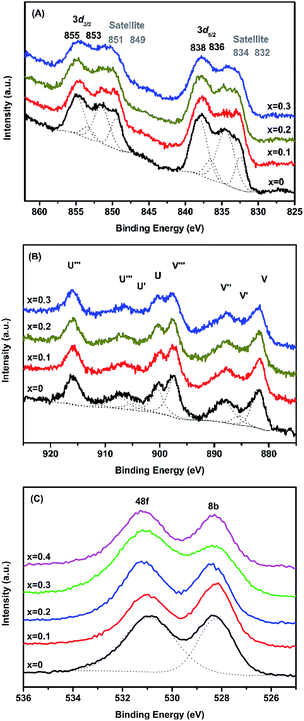 | ||
| Fig. 2 Peak deconvolution of MLCRO0-03: (A) La3d; (B) Ce3d, and (C) O1s in X-ray photoelectron spectra. | ||
The XPS spectra of Mg2p and Ca2p are shown in Fig. S3† with peaks centered at 50 eV (Mg2p), 347 eV (Ca2p1/2) and 350 eV (Ca2p3/2), respectively. The peaks correspond to the MLCRO of the Mg2+ ion and the CLCRO of the Ca2+ ion in the structure. The Ce3d spectra can be assigned as the result of the mixed oxidation states of Cen+ cations; the results are shown in Fig. 2(B). The relative compositions of Ce3+ and Ce4+ ions were evaluated with peak integrations; the results are shown in Table S2.† Peaks U′ and V′ centered at 884.0 and 903.0 eV resulted from the contribution of Ce3+ ions. The peaks (V, V′′, V′′′) and (U, U′, U′′′) corresponded to 3d5/2 and 3d3/2 and were assigned for the Ce4+ states, showing that the increased Mg2+ substitution affected a relative amount of Ce4+ to Ce3+.55 The Ru3d spectra show binding energies in a range of 281.7–283.7 eV for Ru3d5/2 (Fig. S3(C), Table S3†). The reported data on the Ru3d5/2 signal of Ru4+ were in the range of 280.7–281.0 eV, and the binding energies high oxidation states Run+ (n > +4) were located at 282.5–282.6 eV and 283.3 eV, respectively. The broad signal can be deconvoluted to several peaks in a range of 280–292 eV, indicative of multiple oxidation states of Run+ ions.56,57
The O1s spectra for MLCRO materials are shown in Fig. 2(C). It has a broad asymmetry peak which can be deconvoluted into two peaks. It presents the two binding energies, the O48f and O8b, due to the electronegativity effect. The electronegativity of the A-site (Mg/La) ions was smaller than for the B-site (Ce/Ru). The higher binding energy of O48f surrounded by a 2 A (Mg/La) site and 2 B(Ru/Ce) site, was comparable to the lower binding energy of O8b (4A (Mg/La)). Thus, the peak could be assigned to O48f with the binding energy of 531 eV and the binding energy of 528 eV could be assigned to O8b in the O1s spectrum.58 The results indicate that the Mg-substituted samples on the A-site not only affected the La–O distance, but also created mixed oxidation states of Ce3+/4+ and Run+ that led to the distribution of oxygen vacancies. The XPS analyses from Ca-substituted samples are similar to the Mg-substituted samples, and their results are summarized in Fig. S4, Tables S2 and S3.†
3.3 X-ray absorption spectroscopy (XAS)
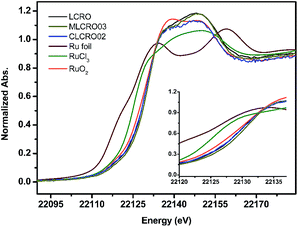
The oxidation state and local atomic environment in MxLa2−xCe1.8Ru0.2O7−δ (M = Mg, Ca) were investigated by an X-ray absorption near-edge structure (XANES) spectrum (Fig. 3). For comparison of the XANES of the Ru K-edge region of series materials, Ru-foil, RuCl3, and RuO2 powders were used as references and measured using the same procedure. The pre-edge region of LCRO, MLCRO03, and CLCRO02 are shown in Fig. 3. According to the first derivatives of the Ru XANES spectra, the apparent pre-edges of MLCRO03 and CLCRO02 are higher than that of RuO2, indicative of an oxidation state higher than 4+ for all Ru ions in Mg- and Ca-substituted pyrochlores in Fig. S5 and Table S4.† In order to evaluate the oxidation state of Ru ions in the pyrochlore structure, we analyzed the EXAFS fitting results obtained from the Fourier transform into the R-space as FT [k3χ(k)], shown in Fig. S6 and S7.† The EXAFS fitting results are shown in Table 2. The peak at around 1.93 Å is associated with electronic backscattering between Ru and O atoms in the first shell. The Ru–O bond length was affected by the electronic structure due to the mixed oxidation state of Run+. In comparison with RuO2, CLCRO02, MLCRO03, and LCRO, the averaged bond lengths of Ru–O were 2.02(1), 1.99(1), 1.983(5), and 1.969(7) Å, respectively. We found that the bond distance of Ru–O was different due to the effect of the electronic structure of Ru. The refined Ru–O lengths for MLCRO03 and CLCRO02 were close to RuO2 and longer than that of LCRO, suggesting the similar bond strength to RuO2.| a N/number: coordination number.b σ2: Debye–Waller factor.c R-Factor: the goodness of the fit. | ||||
|---|---|---|---|---|
| MgxLa2−xCe1.8Ru0.2O7−δ | x = 0 | x = 0.1 | x = 0.2 | x = 0.3 |
| Ru–O (Å) | 1.969(7) | 1.979(4) | 1.991(6) | 1.983(5) |
| N/numbera | 6 | 6 | 6 | 6 |
| σ2 (Å−2)b | 0.0067(3) | 0.0057(2) | 0.0046(2) | 0.0065(2) |
| R-Factorc (%) | 0.1 | 0.05 | 0.1 | 0.09 |
| E0 (eV) | −1.0 | −0.7 | −0.2 | −1.1 |
3.4 TPR process analysis and H2 reduction ability
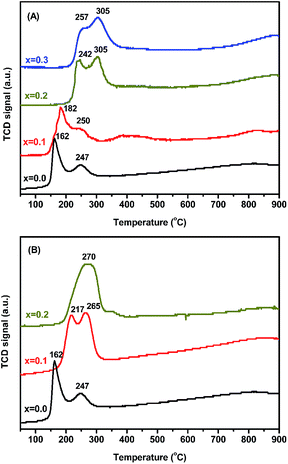
Fig. 4 depicts the TPR profiles of MxLa2−xCe1.8Ru0.2O7−δ (M = Mg, Ca), showing the contribution of Ru ions in the reduction to be between 150 °C and 350 °C. The reduction profiles could be convoluted into two temperature regions. It could be assigned to the reduction temperature region at 200 °C and 300 °C by Ru ions in the structure. A reduction in Run+ (n ≧ 4) to Ru3+ was observed at around 210 °C and 270 °C. The second reduction peak was attributed to the reduction of Ru3+ and Ru2+/0 centered at around 270 °C and 380 °C. The reduction of Ce4+ to Ce3+ species was not clearly observed at a temperature higher than 400 °C. The initial reduction temperature gradually increased and reached 200 °C, which correlated with the modified oxidation state of Run+ ions close to Ru4+ (Table S3†). There was a minor change in the initial reduction temperature in MLCRO (x = 0.1) which rose to ∼250 °C when x = 0.2 and 0.3. As for the Ca-substituted samples, the temperature shifted to high temperature ∼260 °C. Both Mg- and Ca-substituted samples show higher initial reduction temperatures than that of non-doped LCRO, indicative of a reduced oxidation state of Ru ions. When the active metal composition of Ru/Ce ions was fixed, the highest H2 consumption was 0.91 mmol g−1 for MLCRO0-03 and 1.44 mmol g−1 for CLCRO0-02, as shown in Fig. S8(A).† The average H2 molecule (two electron) consumed 0.57 and 0.89 mmol mmol−1 Ru for MLCRO01-03 and CLCRO01-02, as shown in Fig. S8(B),† respectively. The results indicate that the Mg- and Ca-substituted MxLa2−xCe1.8Ru0.2O7−δ affected the oxidation states of Run+ and Ce3+/4+ on the oxide surface.3.5 Catalytic performance
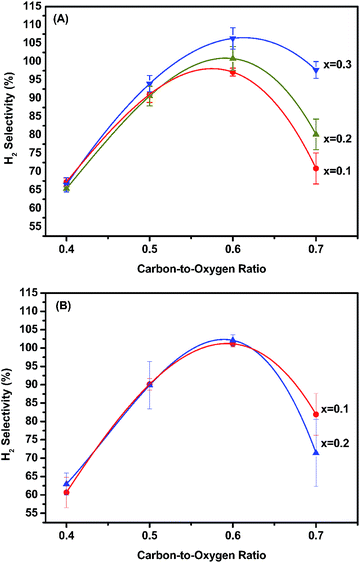
Catalytic activity as a function of temperature was studied, and the results are shown in Fig. 5 and S9.† The initial activation temperatures of MLCRO03 and CLCRO02 decreased to 350 and 280 °C, respectively, which were lower than that of LCRO/Al2O3 (400 °C), indicating that alkaline-substitution had markedly increased the activity of the catalyst. Once the process was initiated, the ethanol conversions remained ∼100%.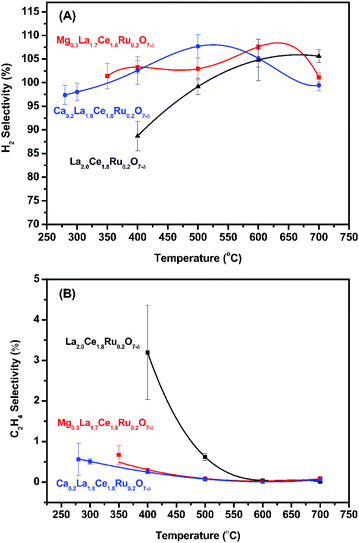 | ||
| Fig. 5 The activation temperature of MLCRO (M = Mg, Ca) catalysts for: (A) selectivity of H2 and (B) selectivity of C2H4 (H2O/ethanol = 3 and GHSV = 1.6 × 10⁵ h−1). | ||
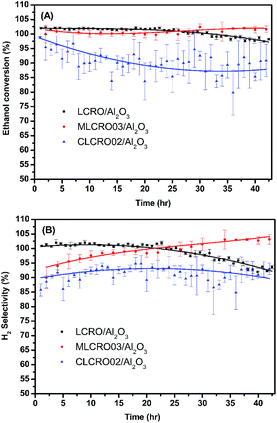 | ||
| Fig. 7 The long-term use of LCRO/Al2O3, MLCRO03/Al2O3, and CLCRO02/Al2O3: (A) ethanol conversion and (B) H2 selectivity for 400 °C, 350 °C, and 280 °C (OSR, H2O/ethanol = 3 and GHSV = 1.6 × 10⁵ h−1). | ||
We tested the enduring catalytic stability for a MLCRO03 catalyst supported on Al2O3 for 350 h, as shown in Fig. S11.† The initial ethanol conversion for OSRE was almost 100%. The major products were H2, CO, and CO2, and small amounts of CH4 and C2H4 (selectivity less than 5%) were formed. The activity remained stable during the 48 h experiment without degradation. However, the selectivity of hydrogen initially reached over 100% and gradually degraded to ∼90% after a 100 h test; it then decreased to 80% after the 320 h test. Overall, the average hydrogen selectivity was approximately 80%, and the ethanol conversion was around 90% for 350 h.
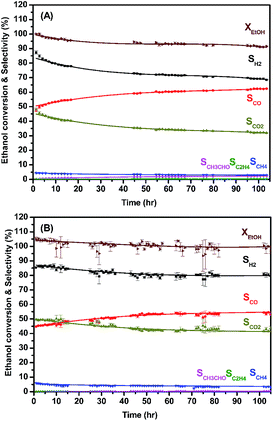
The enduring catalytic activity of LCRO, MLCRO03, and CLCRO02 catalysts was supported on lab-made La2Zr2O7 for 105 h (T = 400 °C, GHSV of 160![[thin space (1/6-em)]](https://www.rsc.org/images/entities/char_2009.gif) 000 h−1, and C/O of 0.6). The performances are shown in Fig. 8. The average ethanol conversions for OSRE were 100(3)%, 100.0(8)%, and 100(2)%, and it remained stable during the 105 h catalytic reaction. The major product was H2, and the average selectivities were 90(1)%, 90.1(3)%, and 90.1(8)% for LCRO, MLCRO03, and CLCRO02, respectively. The initial selectivities of CO for these catalysts were 42.0(1)%, 39.5(7)%, and 39.9(1)%, and the initial selectivities for CO2 were 54.64(3)%, 57.1(5)%, and 56.4(3)%, respectively. During the OSRE process, CO was gradually increased to 48.9(4)%, 49.2(1)%, and 46(1)%, and CO2 was decreased to 49.0(4)%, 47.7(1)%, and 52(1)% for LCRO, MLCRO03, and CLCRO02, respectively. Small amounts of CH4, C2H4, and CH3CHO (<5%) were detected. Compared to the catalysts supported on Al2O3, the catalysts supported on La2Zr2O7 remained active and stable under a vigorous exothermic reaction.
000 h−1, and C/O of 0.6). The performances are shown in Fig. 8. The average ethanol conversions for OSRE were 100(3)%, 100.0(8)%, and 100(2)%, and it remained stable during the 105 h catalytic reaction. The major product was H2, and the average selectivities were 90(1)%, 90.1(3)%, and 90.1(8)% for LCRO, MLCRO03, and CLCRO02, respectively. The initial selectivities of CO for these catalysts were 42.0(1)%, 39.5(7)%, and 39.9(1)%, and the initial selectivities for CO2 were 54.64(3)%, 57.1(5)%, and 56.4(3)%, respectively. During the OSRE process, CO was gradually increased to 48.9(4)%, 49.2(1)%, and 46(1)%, and CO2 was decreased to 49.0(4)%, 47.7(1)%, and 52(1)% for LCRO, MLCRO03, and CLCRO02, respectively. Small amounts of CH4, C2H4, and CH3CHO (<5%) were detected. Compared to the catalysts supported on Al2O3, the catalysts supported on La2Zr2O7 remained active and stable under a vigorous exothermic reaction.
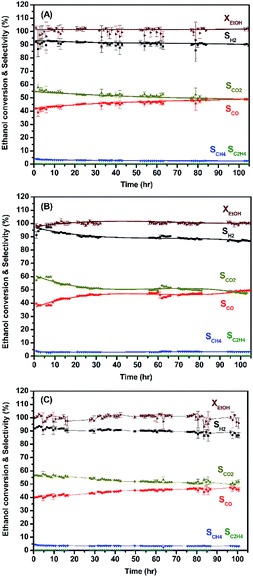 | ||
| Fig. 8 The long-term use of: (A) LCRO/LZO, (B) MLCRO03/LZO, and (C) CLCRO02/LZO for 400 °C (OSR, H2O/ethanol = 3 and GHSV = 1.6 × 10⁵ h−1). | ||
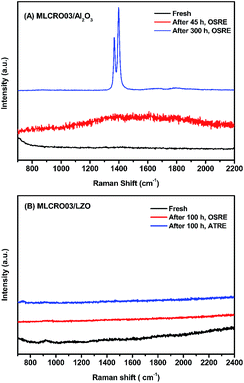
In Fig. 10(A), TGA measurements on used Al2O3-supported catalysts showed weight losses of used MLCRO03 and CLCRO02 catalysts of 3.8% and 7.7%, respectively. Raman spectra of fresh and used catalysts supported by Al2O3 are shown in Fig. 11(A) and S17(A),† respectively. The MLCRO03/Al2O3 (48 h) showed a weak and broad signal between 1000 and 2000 cm−1. The Raman profile of the MLCRO03/Al2O3 (350 h) catalyst exhibits a strong signal between 1200 and 1400 cm−1 contributed by a carbonaceous species. On the other hand, the Raman profile of the CLCRO02/Al2O3 (45 h) catalyst showed two broad bands centered at ∼1300 cm−1 and ∼1600 cm−1 corresponding to the disordered carbonaceous and ordered defective graphitic species. The intensities of the two signals were about the same, indicating that similar amounts of disordered/ordered carbonaceous species were used on the catalyst. The results suggest that the ethanol dehydration reaction caused the formation of polymeric carbon via the ethylene precursor, which was due to the acidic property of the Al2O3 support. It is possible that the carbon deposition of both catalysts was attributed to the decomposition and aggregation of the catalysts.
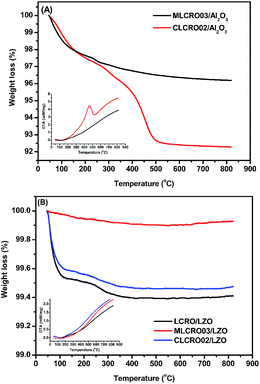 | ||
| Fig. 10 TGA and DSC profiles of: (A) OSR, MxLa2−xCe1.8Ru0.2O7−δ (M = Mg, Ca) on Al2O3 and (B) OSR, on LZO. | ||
For catalysts supported by LZO in long-term OSRE, as shown in Fig. 10(B), the weight losses shown by TGA measurements of used catalysts were 0.6% for non-doped, 0.1% for Mg-, and 0.5% for Ca-substituted catalysts, respectively. The Raman spectrum obtained for the used catalysts supported by a LZO catalyst were almost free of signals from carbonaceous species for Mg- and Ca-substituted catalysts, as seen in Fig. 11(B) and S17,† respectively. The results obtained for the TGA and Raman spectra indicate that carbon deposition on catalyst-supported LZO was significantly reduced compared to that of catalysts supported by Al2O3. It is clear that the supporting material played an important role regarding these catalysts; it not only suppressed carbon deposition but also maintained the catalysts' stability during the OSRE process.
The element distribution of catalysts after the OSR of ethanol was measured by element-mapping analysis using EDX on SEM, as shown in Fig. S18–S20.† From the images, it can be seen that the active metals were still evenly distributed on the used catalysts.
4. Discussion
Based on the EXAFS analyses, the order on the Ru–O length is LCRO < MLCRO03 < CLCRO02 (Table 2), which reflects the relative strength of the Ru–O bond and the oxidation state of Run+ ions.59,60 The results of Rietveld refinements indicate that the shift in the O (48f) position affected the coordination environments, which caused structural distortion during the metal ions substitutions on the A-site. The order of bond distances B–O (B = Ru/Ce) is LCRO < CLCRO02 < MLCRO03, which were contributed to by the combination of mixed occupied Run+ and Ce3+/4+ cations. In general, both the EXAFS and Rietveld analyses suggest that the average oxidation for the Run+ in the B-site of MxLa2−xCe1.8Ru0.2O7−δ is less than that of the unsubstituted LCRO but higher than for RuO2. Since the substitution of an alkaline earth metal into LCRO also reduced the oxidation state of the A-site, this would create oxygen vacancies in the lattice maintaining the charge balance of MxLa2−xCe1.8Ru0.2O7−δ.61 Overall, alkaline earth metal substitution affects the relative composition of Run+ and Ce4+/3+ ions and oxygen vacancies. The proposed oxidation state for ruthenium ion is consistent with the TPR experiment for the reduction of temperature on MxLa2−xCe1.8Ru0.2O7−δ.The concentration of Run+ ions with a high oxidation state plays an important role in the initial oxidation of ethanol during the OSRE process. In OSRE, the functional Ce3+ and Ce4+ showed that the Ce3+ could modify the oxygen vacancies and react with a methyl group to produce CO2 and suppress the formation of CH4. The reduced Ce3+ creates an oxygen vacancy and increases oxygen mobility, which promotes the cleavage of the O–H bonds (ethanol and water) on catalysts.62,63
The activation temperature of these catalysts decreased in the order of MLCRO03/Al2O3 (350 °C) > CLCRO02/Al2O3 (280 °C), which is lower than that of LCRO/Al2O3 (400 °C), indicating that the A-site substitution increased the activity of the catalyst. Since the MxLa2−xCe1.8Ru0.2O7−δ (M = Mg, Ca) catalysts contain the same amount of active metal and similar particle sizes, the effect of a substituted alkaline earth metal is significant. The oxidation states of Run+/Ce4+/3+ ions and oxygen vacancies enhance activity and stability during the OSRE process. The interaction of Run+–O–Ce4+/3+ attributed to ethanol oxidation. The Run+ and oxygen vacancies may adsorb ethanol and induce oxidization to form ethyl aldehyde, accompanied by reduced Ru/Ce ions. Furthermore, the adsorbed oxygen molecule or atom could induce decomposition of the ethyl aldehyde to produce H2, CO, and CO2.12
The interaction between the catalyst and support was investigated by TPR, as shown in Fig. S21.† The TPR experiment showed that the catalysts were active in the temperature range of 150–700 °C. The TPR profiles of MLCRO03/LZO catalysts reveal two broad signals in the temperature region at 200–350 °C and 350–700 °C. Similar results were observed for CLCRO02/LZO for temperature ranges of 150–350 °C and 350–650 °C. These reduction signals for both catalysts shifted to a higher temperature compared to the TPR plots for unsupported MLCRO03 and CLCRO02, indicative of strong interactions between the catalyst and support. The profiles also show that the first reduction peak for CLCRO02/LZO is lower than that for MLCRO03/LZO. The results suggest that the relative amount of high oxidation state for Run+ ions (n > 4) for CLCRO02/LZO is higher than for MLCRO03/LZO. The high oxidation state of Run+ ions is considered an important factor in initializing the ethanol oxidation reaction to acetaldehyde. The results from TPR measurements on catalysts supported by LZO support the low activation temperature on the CLCRO02/LZO catalyst.
Studies show that the ethanol dehydrogenation and dehydration routes on OSRE were dependent on the catalyst and acidic/basic of the support. It has been reported that catalysts using an Al2O3 support favored the dehydration pathway to produce ethylene and induce carbon deposition. Alkaline metal oxides like MgO and CaO are known to be basic promoters used to modify a Al2O3 support.64 The metal/oxide catalyst modified by MgO/CaO is favored for the dehydrogenation reaction on the active sites to produce acetaldehyde and hydrogen. The presence of Mg and Ca also enhances water adsorption on the catalyst that facilitates the adsorption of oxygen or hydroxyl radicals from the catalyst. The combined effects lead to suppressed ethylene formation, promoting water adsorption for WGS reaction, suppressing the formation of coke, and maintaining the catalyst's stability. The effect of the MgO/CaO-treated catalyst on the reaction route of SRE suggested that the alkaline earth metal substituted pyrochlore may exhibit a similar influence on mitigating the acidity of the catalyst and support that would lead to reduced ethylene selectivity. The proposed effect on the substituted Mg/Ca was checked with the relative selectivity of ethylene on the temperature dependent OSRE experiments. As shown in Fig. 5(B), the selectivity of C2H4 for LCRO is the highest compared to MLCRO03 and CLCRO02 in the temperature range of 280–600 °C. The differences on ethylene selectivity were reduced as the temperature increased, favoring the ethanol decomposition reaction. It is clear that the catalysts with alkaline metal reduced the yield of ethylene significantly; this is an important factor in reducing carbon deposition in the OSRE process. The surface property of LZO might exhibit a basic/neutral property that prevents the dehydration reaction of ethanol and leads to a reduced carbon deposition rate, as shown in Fig. S22.†
The catalyst support on LZO was tested under the auto thermal process. The ratios between H2O and C2H5OH, carbon-to-oxygen, and GHSV were fixed, and the temperature control was stopped when the conversion process was activated. The results are shown in Fig. 9 and summarized in Table 3. The average ethanol conversions were 94.3(6)% and 100(2)% for MLCRO03 and CLCRO02 catalysts, respectively. Both MLCRO03 and CLCRO02 catalysts exhibited nearly 87(1)% and 85.4(5)% initial H2 selectivity which gradually decreased to about 68.5(2)% and 78(2)% in the 105 h test. The initial selectivity values of CO were 47.3(9)% and 44.7(3)% which increased to 62.4(2)% and 52(3)% during the stream test. The average mole ratios of H2/CO were 1.96 and 2.38 for MLCRO03 and CLCRO02, respectively. For the minor products, the average selectivities of CH4 were 3.44(4)% and 4.0(2)%, and the selectivities of C2H4 were lower than 1%, respectively. The CH3CHO was observed for both catalysts, indicating that the catalytic reactions for these catalysts favored the dehydrogenation reaction. The selectivity of CH3CHO for MLCRO03 was higher than that of CLCRO02, indicative of incomplete ethanol conversion. The sintering of both catalysts was not obvious from the powder X-ray diffraction analyses (Fig. S16†). Overall, the MLCRO03 and CLCRO02 remained stable for 105 h proceeding with the ATR of the ethanol reaction.
| MLCRO03/LZO | SH2 | SCO | SCO2 | SCH4 | SC2H4 | SCH3CHO | XEtOH |
|---|---|---|---|---|---|---|---|
| OSRE (%) | 90.1(3) | 45.6(3) | 51.8(3) | 3.28(3) | 0.045(7) | 0 | 100.0(8) |
| ATRE (%) | 74.4(2) | 57.9(3) | 36.7(3) | 3.44(4) | 0.293(5) | 1.58(3) | 94.3(6) |
| CLCRO02/LZO | SH2 | SCO | SCO2 | SCH4 | SC2H4 | SCH3CHO | XEtOH |
|---|---|---|---|---|---|---|---|
| OSRE (%) | 90.1(7) | 44.2(6) | 53.0(6) | 3.44(8) | 0.036(1) | 0 | 100(1) |
| ATRE (%) | 81(1) | 51.4(7) | 44.5(9) | 4.0(2) | 0.037(3) | 0.11(5) | 100(2) |
The temperatures of the catalyst during the OSRE and ATR experiments were monitored by a K-type thermocouple on the reaction tube close to the reaction spot. According to the results on XPS, EXAFS, and Rietveld analyses, the oxidation states of both catalysts were changed, and oxygen vacancies were created in the lattice, which affected the activation temperature on the ethanol conversion. For the OSRE process, the temperatures were fixed in accordance to their activation temperatures of 350 °C for MLCRO03 and 280 °C for CLCRO02, respectively. The selectivity of the major products (H2, CO, CO2) remained close for both catalysts during the stream test. The average temperatures for MLCRO03 and CLCRO02 catalysts were 625 °C and 605 °C, respectively. The effect of the temperature control is unfavorable for the WGS reaction on the performance, but rather for methane steam reforming. The observed selectivity of CO and CO2 was close for both catalysts. However, there was a significant difference in the ATR reaction in terms of their product distributions. During the autothermal reaction, the selectivity of CO/CO2 for MLCRO03 was higher/lower than that of CLCRO02 catalysts, which indicates a low hydrogen production on the MLCRO03 catalyst. The activation temperature for CLCRO02 was lower than that of MLCRO03, and a high Ce3+ content on the surface CLCRO02 was beneficial to the WGS reaction to promote CO conversion.65 The average temperatures on the reaction zone under the ATR process for MLCRO03 and CLCRO02 were 425 °C and 420 °C, respectively. The low operational temperature for CLCRO02 may be due to its low activation temperature and the high catalytic activity of the catalyst. Although the temperature difference was minor, the combined effect of the reduced temperature and high activity of CLCRO02 facilitated more CO conversion that resulted in increased hydrogen selectivity.66,67 Characterizations on the used catalyst after the ATR process also showed minor carbon deposition without signs of structural decomposition.
A comparison of the ethanol conversion and hydrogen production observed over the OSRE process is summarized in Table S5.† Some metal/metal oxide catalysts with non-noble and noble metal have been reported as possessing high activity in OSRE processes. The yields of H2 production were around 41–69%.25 Metal oxides as catalysts, like perovskite and spinel phases, were also reported with hydrogen yields of 45–68%.38,41 The hydrogen yields of LCRO/LZO, MLCRO03/LZO, and CLCRO02/LZO under OSRE were 54.0%, 53.9%, and 54.3%, respectively, which are comparable to the catalyst with Rh metal in the OSRE process. Under the auto-thermal condition, CLCRO02/LZO exhibits a high activity with a 100% ethanol conversion and 49% yield of hydrogen. The H2 yield of the CLCRO02 catalyst was more than that of Li- and Mg substituted catalysts due to its low temperature operation that promoted the WGS reaction to produce additional hydrogen. This study and our previous studies clearly demonstrate that the metal-substituted pyrochlore catalysts with mixed-valence states of active metals facilitated the C–C and C–H bond due to the dynamic redox reactions. The LZO supported catalyst not only induced metal-support interaction but also maintained the catalyst's stability in the OSRE process.
5. Conclusions
Alkaline metals substituted on A-site pyrochlore oxide MxLa2−xCe1.8Ru0.2O7−δ (M = Mg, Ca) were studied as catalysts on the OSR/ATR of ethanol. The insertion of Mg2+ and Ca2+ into the LCRO structure changed the composition of Ce3+/Ce4+, the oxidation state of Run+, and oxygen vacancies to maintain charge balance. The content of alkaline earth metal cations in the pyrochlore structure not only modified the geometric and electronic properties, but also affected the active temperature of the OSRE reaction and suppressed the formation of ethylene. The even distribution of Run+ and Ce4+/3+ ions in the structure provided stable activity for the OSRE process. The supporting material (La2Zr2O7) exhibits strong catalyst support interaction, which effectively suppress the sintering of catalyst and deposition of carbonaceous species under oxidative/autothermal steam reforming of ethanol.Conflicts of interest
The authors declare no competing financial interest.Acknowledgements
We are grateful to Prof. Hiro-o Hamaguchi, Prof. Hirotsugu Hiramatsu, Miss Chen-Hua Wang, and Miss Szu-Hua Chen regarding the Raman experiments provided by the Ultimate Spectroscopy and Imaging Laboratory (USIL). We thank Dr Jyh-Fu Lee, Dr Ting-Shan Chan, and Mr Chung-Kai Chang at the National Synchrotron Radiation Research Center for the XRD and XAS experiments, and Prof. Hsin-Tien Chiu for the BET measurements. This work is supported by the Ministry of Science and Technology, Taiwan (Grant No. MOST 107-2113-M-009-006) and the Center for Emergent Functional Matter Science of National Chiao Tung University from The Featured Areas Research Center Program within the framework of the Higher Education Sprout Project by the Ministry of Education (MOE) in Taiwan.References
- ExxonMobil., Outlook for Energy: A View to 2040, 2018, pp. 1–63 Search PubMed.
- R. Alkama and A. Cescatti, Science, 2016, 351, 600–604 CrossRef CAS.
- P. Agre, M. Molina and S. Chu, Nature, 2017, 550, S62 CrossRef CAS PubMed.
- A. Midilli, M. Ay, I. Dincer and M. A. Rosen, Renewable Sustainable Energy Rev., 2005, 9, 255–271 CrossRef CAS.
- S. R. Foit, I. C. Vinke, L. G. J. de Haart and R.-A. Eichel, Angew. Chem., Int. Ed., 2017, 56, 5402–5411 CrossRef CAS.
- S. Chu, Y. Cui and N. Liu, Nat. Mater., 2016, 16, 16 CrossRef.
- J. P. W. Scharlemann and W. F. Laurance, Science, 2008, 319, 43–44 CrossRef CAS.
- D. Das and T. N. Veziroǧlu, Int. J. Hydrogen Energy, 2001, 26, 13–28 CrossRef CAS.
- M. S. Dresselhaus and I. L. Thomas, Nature, 2001, 414, 332–337 CrossRef CAS.
- D. Li, X. Li and J. Gong, Chem. Rev., 2016, 116, 11529–11653 CrossRef CAS PubMed.
- A. Haryanto, S. Fernando, N. Murali and S. Adhikari, Energy Fuels, 2005, 19, 2098–2106 CrossRef CAS.
- D. Zanchet, J. B. O. Santos, S. Damyanova, J. M. R. Gallo and J. M. C. Bueno, ACS Catal., 2015, 5, 3841–3863 CrossRef CAS.
- J. Goldemberg, Science, 2007, 315, 808–810 CrossRef CAS PubMed.
- J. Llorca, V. C. Corberán, N. J. Divins, R. O. Fraile and E. Taboada, in Renewable Hydrogen Technologies, ed. L. M. Gandía, G. Arzamendi and P. M. Diéguez, Elsevier, Amsterdam, 2013, pp. 135–169, DOI:10.1016/b978-0-444-56352-1.00007-6.
- T. Mondal, K. K. Pant and A. K. Dalai, Int. J. Hydrogen Energy, 2015, 40, 2529–2544 CrossRef CAS.
- M. H. Youn, J. G. Seo, H. Lee, Y. Bang, J. S. Chung and I. K. Song, Appl. Catal., B, 2010, 98, 57–64 CrossRef CAS.
- K. Sato, K. Kawano, A. Ito, Y. Takita and K. Nagaoka, ChemSusChem, 2010, 3, 1364–1366 CrossRef CAS PubMed.
- L. V. Mattos, G. Jacobs, B. H. Davis and F. B. Noronha, Chem. Rev., 2012, 112, 4094–4123 CrossRef CAS PubMed.
- L. J. I. Coleman, W. Epling, R. R. Hudgins and E. Croiset, Appl. Catal., A, 2009, 363, 52–63 CrossRef CAS.
- M. C. Sánchez-Sánchez, R. M. Navarro and J. L. G. Fierro, Catal. Today, 2007, 129, 336–345 CrossRef.
- J. Sun, X.-P. Qiu, F. Wu and W.-T. Zhu, Int. J. Hydrogen Energy, 2005, 30, 437–445 CrossRef CAS.
- R. U. Ribeiro, J. W. C. Liberatori, H. Winnishofer, J. M. C. Bueno and D. Zanchet, Appl. Catal., B, 2009, 91, 670–678 CrossRef CAS.
- A. Kaddouri and C. Mazzocchia, Catal. Commun., 2004, 5, 339–345 CrossRef CAS.
- C. Graschinsky, M. Laborde, N. Amadeo, A. Le Valant, N. Bion, F. Epron and D. Duprez, Ind. Eng. Chem. Res., 2010, 49, 12383–12389 CrossRef CAS.
- G. A. Deluga, J. R. Salge, L. D. Schmidt and X. E. Verykios, Science, 2004, 303, 993–997 CrossRef CAS.
- W.-T. Chen, K.-B. Chen, M.-F. Wang, S.-F. Weng, C.-S. Lee and M. C. Lin, Chem. Commun., 2010, 46, 3286–3288 RSC.
- Q. Yang, G. Liu and Y. Liu, Ind. Eng. Chem. Res., 2018, 57, 1–17 CrossRef CAS.
- M. Muñoz, S. Moreno and R. Molina, Int. J. Hydrogen Energy, 2017, 42, 12284–12294 CrossRef.
- C. Rodríguez, S. Moreno and R. Molina, Appl. Surf. Sci., 2019, 485, 293–303 CrossRef.
- N. Zhu, X. Dong, Z. Liu, G. Zhang, W. Jin and N. Xu, Chem. Commun., 2012, 48, 7137–7139 RSC.
- S.-F. Weng, H.-C. Hsieh and C.-S. Lee, Int. J. Hydrogen Energy, 2017, 42, 2849–2860 CrossRef CAS.
- M. Muñoz, S. Moreno and R. Molina, Appl. Catal., A, 2016, 526, 84–94 CrossRef.
- R. Guil-López, R. M. Navarro, M. A. Peña and J. L. G. Fierro, Int. J. Hydrogen Energy, 2011, 36, 1512–1523 CrossRef.
- M. Muñoz, S. Moreno and R. Molina, Catal. Today, 2013, 213, 33–41 CrossRef.
- M. Muñoz, S. Moreno and R. Molina, Int. J. Hydrogen Energy, 2014, 39, 10074–10089 CrossRef.
- S. Velu, K. Suzuki, M. Vijayaraj, S. Barman and C. S. Gopinath, Appl. Catal., B, 2005, 55, 287–299 CrossRef CAS.
- H. Chen, H. Yu, F. Peng, G. Yang, H. Wang, J. Yang and Y. Tang, Chem. Eng. J., 2010, 160, 333–339 CrossRef CAS.
- S. M. de Lima, A. M. da Silva, L. O. O. da Costa, J. M. Assaf, L. V. Mattos, R. Sarkari, A. Venugopal and F. B. Noronha, Appl. Catal., B, 2012, 121–122, 1–9 CrossRef CAS.
- Z. Wang, H. Wang and Y. Liu, RSC Adv., 2013, 3, 10027–10036 RSC.
- M. Morales and M. Segarra, Appl. Catal., A, 2015, 502, 305–311 CrossRef CAS.
- L. Huang, J. Xie, W. Chu, R. Chen, D. Chu and A. T. Hsu, Catal. Commun., 2009, 10, 502–508 CrossRef CAS.
- M. Espitia-Sibaja, M. Muñoz, S. Moreno and R. Molina, Fuel, 2017, 194, 7–16 CrossRef CAS.
- C. Pirez, M. Capron, H. Jobic, F. Dumeignil and L. Jalowiecki-Duhamel, Angew. Chem., Int. Ed., 2011, 50, 10193–10197 CrossRef CAS PubMed.
- W. Fang, C. Pirez, S. Paul, M. Jiménez-Ruiz, H. Jobic, F. Dumeignil and L. Jalowiecki-Duhamel, Int. J. Hydrogen Energy, 2016, 41, 15443–15452 CrossRef CAS.
- S.-F. Weng, Y.-H. Wang and C.-S. Lee, Appl. Catal., B, 2013, 134–135, 359–366 CrossRef CAS.
- H.-C. Hsieh, Y.-C. Chang, P.-W. Tsai, Y.-Y. Lin, Y.-C. Chuang, H.-S. Sheu and C.-S. Lee, Catal. Sci. Technol., 2019, 9, 1406–1419 RSC.
- B. H. Toby and R. B. Von Dreele, J. Appl. Crystallogr., 2013, 46, 544–549 CrossRef CAS.
- I. E. Grey, L. M. D. Cranswick, C. Li, L. A. Bursill and J. L. Peng, J. Solid State Chem., 1998, 138, 74–86 CrossRef CAS.
- B. Toby, J. Appl. Crystallogr., 2001, 34, 210–213 CrossRef CAS.
- S. I. Zabinsky, J. J. Rehr, A. Ankudinov, R. C. Albers and M. J. Eller, Phys. Rev. B: Condens. Matter Mater. Phys., 1995, 52, 2995–3009 CrossRef CAS.
- A. L. Ankudinov and J. J. Rehr, Phys. Rev. B: Condens. Matter Mater. Phys., 1997, 56, R1712–R1716 CrossRef CAS.
- M. Newville, P. Līviņš, Y. Yacoby, J. J. Rehr and E. A. Stern, Phys. Rev. B: Condens. Matter Mater. Phys., 1993, 47, 14126–14131 CrossRef CAS.
- E. Talik, A. Novosselov, M. Kulpa and A. Pajaczkowska, J. Alloys Compd., 2001, 321, 24–26 CrossRef CAS.
- B. Vijaya Kumar, R. Velchuri, V. Rama Devi, B. Sreedhar, G. Prasad, D. Jaya Prakash, M. Kanagaraj, S. Arumugam and M. Vithal, J. Solid State Chem., 2011, 184, 264–272 CrossRef.
- A. Trovarelli, Catalysis by Ceria and Related Materials, 2002 Search PubMed.
- I. A. Carbajal-Ramos, M. F. Gomez, A. M. Condó, S. Bengió, J. J. Andrade-Gamboa, M. C. Abello and F. C. Gennari, Appl. Catal., B, 2016, 181, 58–70 CrossRef CAS.
- L. Ji, J. Lin and H. C. Zeng, Chem. Mater., 2001, 13, 2403–2412 CrossRef CAS.
- P. Anithakumari, V. Grover, C. Nandi, K. Bhattacharyya and A. K. Tyagi, RSC Adv., 2016, 6, 97566–97579 RSC.
- N. Planas, L. Vigara, C. Cady, P. Miró, P. Huang, L. Hammarström, S. Styring, N. Leidel, H. Dau, M. Haumann, L. Gagliardi, C. J. Cramer and A. Llobet, Inorg. Chem., 2011, 50, 11134–11142 CrossRef CAS.
- S. J. Mugavero III, M. D. Smith, W.-S. Yoon and H.-C. zur Loye, Angew. Chem., Int. Ed., 2009, 48, 215–218 CrossRef PubMed.
- K. Fujii, Y. Sato, S. Takase and Y. Shimizu, J. Electrochem. Soc., 2015, 162, F129–F135 CrossRef CAS.
- K. Mudiyanselage, S. D. Senanayake, L. Feria, S. Kundu, A. E. Baber, J. Graciani, A. B. Vidal, S. Agnoli, J. Evans, R. Chang, S. Axnanda, Z. Liu, J. F. Sanz, P. Liu, J. A. Rodriguez and D. J. Stacchiola, Angew. Chem., Int. Ed., 2013, 52, 5101–5105 CrossRef CAS.
- G. Zhou, L. Barrio, S. Agnoli, S. D. Senanayake, J. Evans, A. Kubacka, M. Estrella, J. C. Hanson, A. Martínez-Arias, M. Fernández-García and J. A. Rodriguez, Angew. Chem., Int. Ed., 2010, 49, 9680–9684 CrossRef CAS PubMed.
- C. K. S. Choong, L. Huang, Z. Zhong, J. Lin, L. Hong and L. Chen, Appl. Catal., A, 2011, 407, 155–162 CrossRef CAS.
- F. Esch, S. Fabris, L. Zhou, T. Montini, C. Africh, P. Fornasiero, G. Comelli and R. Rosei, Science, 2005, 309, 752–755 CrossRef CAS.
- H. Idriss, M. Scott, J. Llorca, S. C. Chan, W. Chiu, P.-Y. Sheng, A. Yee, M. A. Blackford, S. J. Pas, A. J. Hill, F. M. Alamgir, R. Rettew, C. Petersburg, S. D. Senanayake and M. A. Barteau, ChemSusChem, 2008, 1, 905–910 CrossRef CAS PubMed.
- J. Comas, M. Laborde and N. Amadeo, J. Power Sources, 2004, 138, 61–67 CrossRef CAS.
Footnote |
| † Electronic supplementary information (ESI) available: Detailed information can be found in the ESI, including PXRD, XAS, XPS, SEM, TGA, and so on. See DOI: 10.1039/c9ra08385e |
| This journal is © The Royal Society of Chemistry 2019 |


