 Open Access Article
Temperature dependence of the interfacial bonding characteristics of silica/styrene butadiene rubber composites: a molecular dynamics simulation study†
Yanlong Luo *ab,
Haobei Liuc,
Bo Xiangab,
Xianling Chena,
Wei Yangd and
Zhenyang Luo
 *ab
*ab
aCollege of Science, Nanjing Forestry University, Nanjing 210037, China. E-mail: luozhenyang@njfu.edu.cn
bInstitute of Polymer Materials, Nanjing Forestry University, Nanjing 210037, China
cCollege of Materials Science and Engineering, Nanjing Tech University, Nanjing 21009, China
dState Key Laboratory of Advanced Power Transmission Technology, State Grid Global Energy Interconnection Research Institute, Beijing 102211, China
First published on 3rd December 2019
Abstract
Based on our previous studies on the modification of in-chain styrene butadiene rubber (SBR) using 3-mercaptopropionic acid as well as its composites filled with silica, we further constructed two types of models (amorphous and layered) to investigate the temperature dependence of the interfacial bonding characteristics of silica/SBR composites via molecular dynamics (MD) simulation. The competing effects of rubber–rubber interactions and filler–rubber interactions were identified, and the relationship between the competing effects and the temperature was determined. Besides this, the effect of temperature on the mobility and distribution of SBR chains on the surface of silica was investigated. It was found that the stronger the interfacial interactions, the less sensitive the motion of SBR chains to temperature. Finally, the number and length of hydrogen bonds as a function of temperature were analyzed. These simulated results deepened the understanding of interface temperature dependence of the silica/SBR composites and gave a molecular level explanation for the existence of an optimum modifier content (14.2 wt%) that is temperature independent.
1 Introduction
Solution-polymerized butadiene styrene rubber (SSBR) has excellent rolling resistance and wet skid resistance, and it is therefore frequently filled with silica to produce energy-saving tires.1 Since the first fabrication of SSBR, chemists have developed SSBRs with different chemical structures to obtain composites with better comprehensive properties, especially in terms of hysteresis. For example, it has been demonstrated that end-functionalized structures with ethoxy silyl or other large groups,2,3 star-shaped structures with a branch point4 and in-chain modified structures with the introduction of polar groups (carboxyl5 or amino6 groups) into the macromolecular chains are conducive to reducing rolling resistance. In recent years, increasingly more attention has been paid to SBR that has been in-chain modified via a thiol–ene click reaction.7–9 For one thing, the thiol–ene click reaction has the advantages of mild reaction conditions, strong selectivity and fast reaction rate.10 For another, SBR usually has a high vinyl content, which suggests that a thiol–ene click reaction between a sulfhydryl compound, such as 3-mercaptopropionic acid, and C![[double bond, length as m-dash]](https://www.rsc.org/images/entities/char_e001.gif) C bonds in the SBR chain has broad application potential through the modification of SBR. Our previous studies also revealed that the in-chain modification of SSBR using 3-mercaptopropionic acid can improve wet skid resistance while reduce rolling resistance.5,11 It is well known that interfacial bonding strength between filler and rubber and filler dispersion are two major factors that influence the final properties of composites. Previous studies have verified that a glass layer in a polymer–nanosheet interface can form as long as the strong interfacial interactions are strong, and the thickness of the glass layer determines the stress transfer and mechanical properties.12,13 It is based on the perspective of these interactions and filler dispersion that the introduction of polar groups was found to improve the polarity of SSBR, enhancing the interfacial bonding strength between the silica, a polar filler and SSBR and improving silica dispersion in our previous work.5 Additionally, we found that there was an optimum modifier content (14.2 wt%) at which the silica/SBR composite had the strongest interfacial interactions and the best silica dispersion.11
C bonds in the SBR chain has broad application potential through the modification of SBR. Our previous studies also revealed that the in-chain modification of SSBR using 3-mercaptopropionic acid can improve wet skid resistance while reduce rolling resistance.5,11 It is well known that interfacial bonding strength between filler and rubber and filler dispersion are two major factors that influence the final properties of composites. Previous studies have verified that a glass layer in a polymer–nanosheet interface can form as long as the strong interfacial interactions are strong, and the thickness of the glass layer determines the stress transfer and mechanical properties.12,13 It is based on the perspective of these interactions and filler dispersion that the introduction of polar groups was found to improve the polarity of SSBR, enhancing the interfacial bonding strength between the silica, a polar filler and SSBR and improving silica dispersion in our previous work.5 Additionally, we found that there was an optimum modifier content (14.2 wt%) at which the silica/SBR composite had the strongest interfacial interactions and the best silica dispersion.11
Based on our previous work, there is still some focus worth further study, such as temperature, which is an important factor that affects the microstructures and macroscopic properties, especially for some high-polarity materials.14,15 Many studies have indicated that the effect of temperature on cavity size,16 hysteresis,17 conductivity,18,19 dielectric properties,20 strain-induced crystallization21,22 and mechanical properties23,24 of rubbers and their composites is nonnegligible. Many properties of materials containing a large number of hydrogen bonds show more obvious temperature dependence, which results from the high temperature sensitivity of hydrogen bonds.25,26 For rubber composites, most previous studies have focused on the effect of temperature on the macroscopic properties, and almost all of the studies qualitatively attributed the change in macroscopic properties to the difference in the interfacial bonding characteristics of filler rubber. Quantitative analysis of temperature-induced microstructures, such as interfacial characteristics, at the molecular level is scarce, and this may be due to the limitation of experimental means by which to explore them. Therefore, it is important to gain insights into the effect of temperature on the microstructures at the molecular level.
Molecular dynamics (MD) simulation based on force fields has been demonstrated to be an effective tool for analyzing microstructures and predicting the macroscopic properties of polymers and their nanocomposites.27–29 In the field of MD simulation, great progress has been made on research about the interfacial characteristics of polymers filled with silica, graphene or carbon nanotubes.30–33 One of the studied factors is the effect that the surface chemistry of the filler has on the interfacial properties of nanocomposites. The temperature dependence of the polymer properties has also been studied extensively via MD simulation, and some examples are as follows: structural properties and chain configuration of polyethylene,34 thermal conductivity of cross-linked epoxies,35 polyglutamine aggregation,36 and the bulk modulus of polyisoprene,37 etc. Most of the early MD simulation studies focused on the temperature dependence of pure polymers, and the temperature dependence of polymer nanocomposites was rarely reported. In addition, MD simulation has unique advantages in the study of hydrogen bonds. Compared with experimental methods with which the information on hydrogen bonds is indirect, MD simulation can intuitively give the type, number and evolution of hydrogen bonds as a function of temperature, pressure or time.29,38
In this study, in-chain modified SBR models with various modifier (3-mercaptopropionic acid) content were first constructed. Then, the effect of temperature on the interfacial bonding characteristics of silica/SSBR composites was investigated at the molecular level using amorphous and layered models. It was elucidated in detail that the temperature dependence of hydrogen bonds can be divided into interfacial hydrogen bonds and bulk hydrogen bonds as well as the mobility and distribution of SBR chains on the surface of silica. On the basis of our previous study, the present study further deepens the understanding of the reason for the need for an optimum modifier content from the viewpoint of temperature dependence.
2 Model and simulation details
Experimental studies have shown that an addition reaction occurs between the vinyl groups of 1,2-polybutadiene and the sulfhydryl groups.5 The addition reactions occur as follows:Based on this modified structure, we constructed five kinds of in-chain modified SBR models with various 3-mercaptopropionic acid content, each containing 100 repeating units: g0, g3, g8, g10 and g15. The number following the letter g represents the number of 3-mercaptopropionic acid molecules. The simulated styrene and polybutadiene content of the g0 sample was in accordance with that of our previous experimental sample.11 Table 1 lists the simulated unit content of SBR and the weight content of the modifier.
| Samples | Styrene units (wt%) | 1,2-Polybutadiene units (wt%) | 1,4-Polybutadiene units (wt%) | No. of modifiers | Modifier (wt%) |
|---|---|---|---|---|---|
| g0 | 21.0 | 47.4 | 31.6 | 0 | 0 |
| g3 | 20.4 | 44.3 | 31.0 | 3 | 4.3 |
| g8 | 19.9 | 40.6 | 30.0 | 8 | 9.5 |
| g10 | 17.8 | 36.1 | 28.9 | 10 | 14.2 |
| g15 | 16.6 | 35.6 | 27.0 | 15 | 20.8 |
To gain better insight into the interfacial bonding characteristics of silica/SBR composites, we constructed amorphous and layered models for these composites as follows:
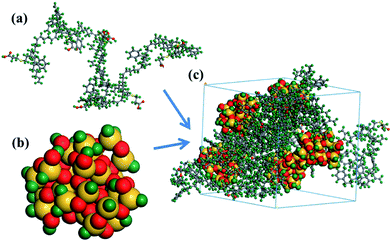
(1) Amorphous model. Amorphous models containing of five SBR chains (Fig. 1a) and five silica nanoparticles (Fig. 1b) with a diameter of 12 Å were constructed. We gave detailed reasons for the choice of diameter in the spherical silica model in our previous work.11 In brief, we calculated the Rg of the polymer chains and found that the Rg value of all polymer chains is greater than the radius of a silica nanoparticle (6 Å). Therefore, at the same mass of silica nanoparticles, the dynamic properties of the nanoparticles do not depend on the chain length, they only depend on the chemical structure of SBR. As an example, the amorphous model of the silica/g8 composite is shown in Fig. 1c. The unsaturated boundary conditions of silica were hydrotreated. Molecular models of silica have been widely studied,39–41 and it has been proven in our previous study that the silica nanoparticle size we constructed is reasonable.11 Binding energies (Ebinding), mean square displacement (MSD), fractional free volume (FFV) and rubber–rubber interactions were calculated using amorphous models.
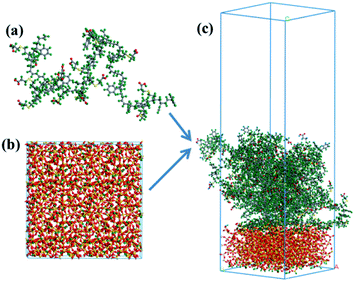
(2) Layered model. Layered models containing ten upper SBR chains (Fig. 2a) and a lower silica surface were constructed via the following process. Initially, the surface of silica (Fig. 2b) was built by cleaving the (0 0 1) plane of the three-dimensional silica cluster, and the hydrogen atoms were added to the surface of silica to avoid an unsaturated boundary effect. Afterwards, SBR chains were added onto the surface of silica to construct a silica/SBR layered model. A vacuum slab with a thickness of 50 Å was added to the above SBR layer so that the SBR chains only interact with one side of the silica layer. As an example, the layered model of the silica/g15 composite with an initial lattice parameter of 42.789 Å × 42.789 Å × 137.025 Å is shown in Fig. 2c. Concentration profiles and MSDs of the SBR chains at the interface as well as hydrogen bonds were analyzed using layered models.
In a simulation, geometry optimization with an energy convergence tolerance of 10−4 kcal mol−1 and force convergence tolerance of 5 × 10⁻³ kcal mol−1 Å−1 was first carried out to obtain a minimum in the potential energy surface for each cell using a Smart algorithm. Afterwards, an annealing procedure for ten annealing cycles with ten heating ramps per cycle and 100 dynamics steps per ramp from an initial temperature of 300 K to mid-cycle temperature of 500 K was performed to avoid trapping the structure in a conformation that represents a local energy minimum. After annealing, 500 ps NVT (constant number of particles, volume, and temperature) and 500 ps NPT (constant number of particles, pressure, and temperature) ensembles were calculated using the amorphous model, and a 500 ps NVT ensemble was calculated using the layered model. In all of the simulations, the initial density was set to 1.0 g cm−3 and periodic boundary conditions were used for each cell. The temperature was controlled using a Nose thermostat42 and the pressure was controlled using an Andersen barostat.43 The van der Waals interactions were calculated using an atom based summation method with a cut-off distance of 12.5 Å, and the electrostatic interactions were calculated using the Ewald summation method with an accuracy of 0.001 kcal mol−1. The Newtonian equation of motion was integrated using the Verlet method44 with a time step of 1 fs. All of the simulations were performed using Materials Studio 5.5, a commercial molecular simulation software, with condensed-phase optimized molecular potentials for atomistic simulation studies (COMPASS) with a force field.
3 Results and discussion
Before we discuss the temperature dependent properties of silica/SBR composites, it is necessary to first give the properties of pure SBRs with various modifier content. The density, cohesive energy and solubility parameters of SBR at 298 K, as well as the glass transition temperature (Tg), were predicted using Synthia, a module in the Materials Studio software that allows rapid estimates of polymer properties to be made. The principle of Tg calculation is that as a rubber is turned into the glassy state during the cooling process, where the density or specific volume changes abruptly at a certain temperature, i.e., Tg. As an example, the curve of density according to temperature for g0 is presented in Fig. S1 in the ESI.† It was found that all of these properties increase with increasing modifier content, as listed in Table 2. This result is attributed to the fact that upon increasing the modifier content, the polarity of the molecular chain and the intermolecular interactions increase. Meanwhile, the strong intermolecular interactions limit the segment motion, so the Tg increases. Additionally, the experimental values of density, solubility and Tg for the unmodified SBR are 0.94 g cm−3, 17.2–17.8 MPa1/2 and −50 to −70 °C, respectively, according to the literature.5,45,46 The predicted values (Table 2) for g0 are in good agreement with the experimental values.| Samples | Density (g cm−3) | Cohesive energy (kcal mol−1) | Solubility parameter (MPa1/2) | Tg (K) |
|---|---|---|---|---|
| g0 | 0.927 | 20.7 | 17.7 | 222.4 |
| g3 | 0.970 | 22.1 | 18.3 | 228.6 |
| g8 | 0.991 | 24.8 | 18.7 | 240.7 |
| g10 | 1.000 | 26.0 | 18.9 | 245.3 |
| g15 | 1.023 | 29.3 | 19.4 | 257.4 |
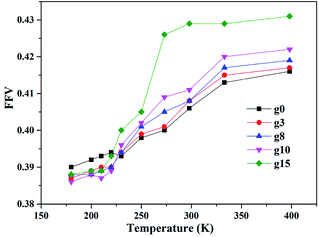
3.1 Fractional free volume
Fractional free volume (FFV) can be used to characterize the stacking capacity of polymer chains and is expressed as47
 | (1) |
3.2 Energy and dynamics properties of silica/SBR composites
The binding energy (Ebinding), a negative value of the interaction energy (Einter), is a quantification of the compatibility between two components mixed with each other.48 A negative Ebinding value indicates poor compatibility. On the contrary, a positive Ebinding value indicates good compatibility and the greater the positive value, the better the compatibility. The Ebinding between SBR and silica can be obtained using eqn (2), and the results of the Ebinding values at different temperatures are shown in Fig. 4a.| Ebinding = −Einter = −(Etotal − ESBR − Esilica) | (2) |
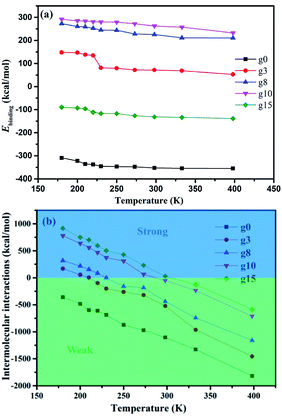 | ||
| Fig. 4 Energy properties of the silica/SBR composites: (a) Ebinding values between silica and SBR and (b) intermolecular interactions between the SBR chains. | ||
The intermolecular interactions between the SBR chains (Einter-SBR), also known as rubber–rubber interactions, were investigated. The Einter-SBR value decreases linearly with increasing temperature for each composite, and the Einter-SBR value increases as the modifier content increases, as shown in Fig. 4b. A positive Einter-SBR value indicates strong (attractive) interactions and negative Einter-SBR values indicates weak (repulsive) interactions.49 Note that the Einter-SBR value is zero at a certain temperature, referred to as the transition temperature. The transition temperatures of the g3, g8, g10 and g15 composites are around 210, 220, 273, and 298 K, respectively. That is, the higher the modifier content, the higher the transition temperature at which rubber–rubber interactions vary from strong to weak. Besides this, the g0 composite has no transition temperature, indicating its weak rubber–rubber interactions at an arbitrary temperature. Combining the Ebinding and Einter-SBR values, we found that at a certain modifier content, the SBR chains tend to interact with silica, while at a certain modifier content, the SBR chains tend to interact with other SBR chains rather than the silica. The competing effect between the Ebinding and Einter-SBR values may be the reason for the optimum modification content at which the interaction between silica and SBR is the largest.
Dynamics properties of the polymer chains depend on the Ebinding and Einter-SBR values and can be characterized using the mean square displacement (MSD), as follows:50
| MSD = 〈|ri(t) − ri(0)|2〉 | (3) |
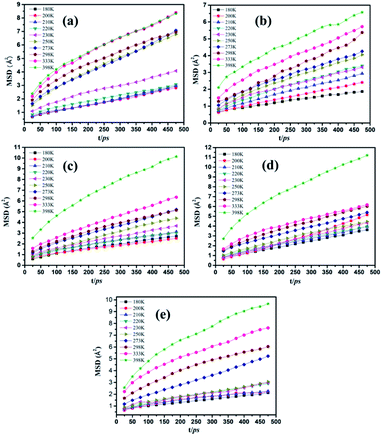 | ||
| Fig. 5 MSDs of SBR chains as a function of time at different temperatures for the (a) g0, (b) g3, (c) g8, (d) g10 and (e) g15 composites. | ||
3.3 Concentration profiles of SBR chains at the interface
To further explore the interfacial bonding characteristics of silica/SBR composites, the concentration profiles of SBR chains on the surface of silica (Z direction) were investigated based on a layered model, as shown in Fig. 6a. Concentration profiles were used to plot the relative concentrations of the specified atoms in layers parallel to the specific planes, and the relative concentrations of the SBR chains at 200, 298 and 373 K are shown in Fig. 6b–d. The relative concentrations of SBR chains at the interface between silica and SBR first increase rapidly within a distance of 5 Å from the silica surface, reaching a relatively stable point, and then decrease rapidly for any composite and temperature. At the stable point, the relative concentration of the g10 composite is almost the largest and the relative concentration of the g15 composite is almost the smallest at each temperature. The largest relative concentration of the g10 composite is attributed to it having the largest Ebinding value. The smallest relative concentration of the g15 composite results from the relatively low Ebinding value and it exhibiting the largest steric hindrance effect. That is, the concentration profile analysis is in good agreement with the results of the Ebinding and FFV values. However, the relative concentration increases upon increasing the modifier content in the rapidly decreasing phase of the concentration profile. This is attributed to the fact that the steric hindrance of the modifier makes the SBR chains move away from the silica surface so that the SBR chains tend to move toward the vacuum layer. It is noteworthy that the concentration profile of the g15 composite is significantly different from those of the other composites, and the difference is more obvious with an increase in the temperature. This may be due to the maximum steric hindrance of g15 and the largest number of hydrogen bonds being present in the g15 composite. At high temperature, more hydrogen bonds will dissociate in the composite with more hydrogen bonds. Additionally, the poor compatibility (negative Ebinding value) between g15 and silica leads to the fact that the g15 chains move further away from the silica surface with an increase in the temperature. | ||
| Fig. 6 Concentration profiles of the SBR chains in the Z direction for different composites at (a) 200 K, (b) 298 K and (c) 373 K. | ||
3.4 Mobility of the SBR chain at the interface
The effect of temperature on the mobility of SBR chains at different distances from the silica surface was investigated. The MSDs of the g10 composite at different distances from the silica surface at 200, 298, and 373 K are shown in Fig. 7. To further investigate the effect of modifier content on the mobility of SBR chains at the interface, the MSDs of the g0 and g15 composites at different temperatures are shown in Fig. S2 and S3 (ESI†). As shown in Fig. 7, it is obvious that the MSDs of the SBR chains at an arbitrary distance increase with increasing temperature. The MSDs within the range of 0–2 Å intersect with those within the range of 4–6 Å at 200 K (see Fig. 7a). Previous studies have indicated that the strong interfacial interactions of polymer nanocomposites could result in the formation of an interfacial layer in which the Tg value and density of the polymer are higher than those in the bulk.12,13 This is the reason for the intersection of the MSDs. At 298 K, the MSDs within the range of 0–2 Å intersect with those within the range of 2–4 Å, which indicates that the interfacial interactions and the thickness of the interface layer decreases with an increase in temperature. As the temperature rises to 373 K, the MSDs within 0–2 Å do not intersect with those within the arbitrary distance, which indicates that the interactions are further weakened with increasing temperature. As can be seen from Fig. S2,† the MSDs within 0–2 Å are the smallest at 200 K, but are not the smallest at 298 and 373 K. From Fig. S3,† it can be seen that the MSDs within 0–2 Å are the smallest and the MSDs increase with an increase in distance at any temperature. Thus, it can be seen that temperature has different effects on the MSDs of different systems. In addition, compared with the g0 and g15 composites, the MSD of the g10 composite is much lower due to it having the strongest interfacial interactions. This further proves that there is an optimum modification content of 14.2 wt%. The MSD results are in good agreement with the Ebinding results.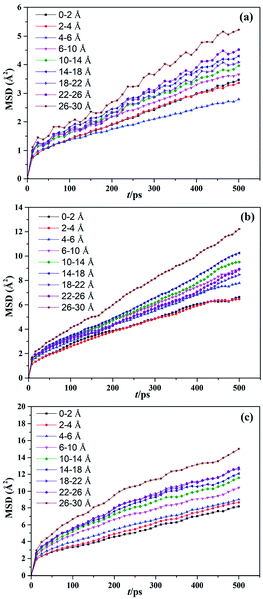 | ||
| Fig. 7 MSDs of the silica/g10 composite at different temperatures of (a) 200, (b) 298, and (c) 373 K. | ||
To quantitatively investigate the temperature dependence of the interfacial bonding characteristics of silica/SBR composites, we calculated the diffusion coefficient (D) of SBR chains at different distances from the silica surface using50
 | (4) |
| Distance | D (cm2 s−1) | ||||||||
|---|---|---|---|---|---|---|---|---|---|
| Silica/g0 composites | Silica/g10 composites | Silica/g15 composites | |||||||
| 200 K | 298 K | 373 K | 200 K | 298 K | 373 K | 200 K | 298 K | 373 K | |
| 0–2 Å | 50.75 | 77.30 | 95.32 | 21.97 | 31.78 | 50.95 | 20.02 | 38.05 | 64.80 |
| 2–4 Å | 58.25 | 60.73 | 91.90 | 21.33 | 32.42 | 55.05 | 24.89 | 45.28 | 71.53 |
| 4–6 Å | 53.48 | 60.65 | 102.08 | 15.33 | 35.85 | 53.42 | 27.42 | 62.15 | 83.60 |
| 6–10 Å | 54.78 | 58.50 | 97.68 | 22.70 | 38.00 | 58.48 | 39.45 | 94.58 | 108.08 |
| 10–14 Å | 59.82 | 62.82 | 117.22 | 24.85 | 41.32 | 66.58 | 53.25 | 112.00 | 167.21 |
| 14–18 Å | 74.73 | 80.82 | 160.93 | 27.35 | 43.20 | 70.20 | 57.72 | 133.38 | 183.81 |
| 18–22 Å | 87.33 | 132.32 | 228.13 | 26.88 | 34.23 | 76.32 | 68.33 | 118.10 | 212.45 |
| 22–26 Å | 114.53 | 143.6 | 338.97 | 30.93 | 36.40 | 76.30 | 67.33 | 116.10 | 185.13 |
| 26–30 Å | 140.96 | 165.78 | 399.40 | 36.03 | 57.73 | 88.70 | 72.06 | 124.90 | 167.20 |
3.5 Analysis of hydrogen bonds
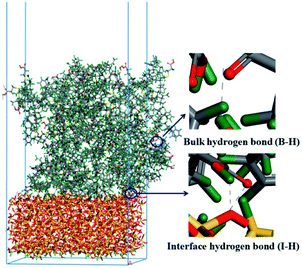
Based on our previous study, hydrogen bond interactions play an important role in the dynamic and static mechanical properties of silica/SBR composites.5,11 Two types of hydrogen bonds are crucial: one is the hydrogen bonding at the interface between the silica and SBR (referred to as I-H), and the other is the hydrogen bonding in the bulk of the SBR (referred to as B-H). The sum of I-H and B-H is defined as the total hydrogen bond (T-H). Schematic diagrams of hydrogen bonding in the bulk and at the interface are shown in Fig. 8, and the number of I-H, B-H and T-H at different temperatures are shown in Fig. 9. The number of I-H is less than that of B-H, and the proportion of I-H decreases with an increase in the modifier content. This indicates that with an increase in the modifier content, it is easier for SBR chains to bind to other SBR chains rather than to silica, which is in good agreement with the Ebinding and Einter-SBR results. In the g3 composite, the number of B-H increases with increasing temperature, whereas the number of T-H is almost constant. This may be due to the fact that the modifier content in the g3 composite is low, and the probability of hydrogen bond formation is low. At 200 K (lower than the Tg), the g3 chains do not have enough energy to move and the hydrogen bonds formed are frozen. With an increase in the temperature, the increasing mobility of the g3 chains will not promote the formation of hydrogen bonds, but will promote the dissociation of the original hydrogen bonds due to the low modifier content. Therefore, the number of B-H decreases with increasing temperature. As the temperature rises to 373 K, the hydrogen bonds in the g3 composites continue to dissociate, and the number of hydrogen bonds further decreases. In the g8, g10 and g15 composites, the numbers of T-H and B-H first increase, reach a maximum at 298 K, and then decrease with increasing temperature. This is because in composites with more hydrogen bonds, am appropriate increase in temperature improves the mobility of the SBR chains, which is conducive to a greater probability of forming hydrogen bonds. The number of I-H increases with increasing temperature for the g3 and g8 composites, whereas the number of I-H reaches a maximum at 298 K in the g10 and g15 composites. This is due to the fact that in composites (g3 and g8) with relatively few I-H, the mobility of the SBR chains increases with an increase in the temperature, and the large amount of hydroxyl groups on the surface of the silica have a greater probability of forming I-H with the modifiers on the SBR chains. However, in composites (g10 and g15) with relatively more I-H, many hydroxyl groups on the surface of silica participate in the formation of I-H below a certain temperature. When the temperature reaches a certain value (373 K), the I-H formed are destroyed by high temperature.38 No more residual hydroxyl groups on the surface of silica are involved in the formation of I-H so that the number of I-H decreases.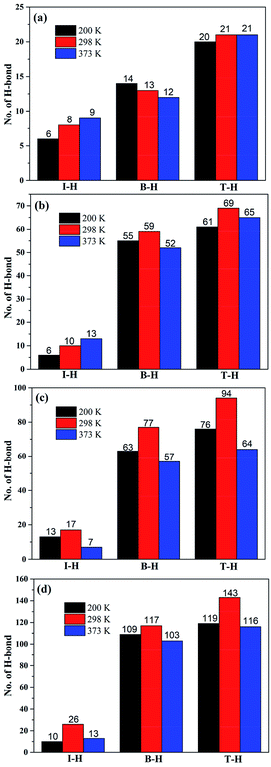 | ||
| Fig. 9 Temperature dependence of the number of hydrogen bonds in the (a) g3, (b) g8, (c) g10, and (d) g15 composites. The number above the column represents the number of hydrogen bonds. | ||
It can be also seen from Fig. 9 that in composites with a higher modifier content that the change in the number of hydrogen bonds is more sensitive to temperature. We calculates the average length of I-H at different temperatures to further explain the temperature dependence of the interfacial interactions. As listed in Table 4, the average length of I-H increases with an increase in the temperature, indicating that the average hydrogen bond interactions at the interface decrease. In addition, the average length of I-H increases with an increase in the modifier content, which may be due to the high steric hindrance effect of the modifier at a high modifier content. In summary, with an increase in the modifier content, although the number of I-H increases, the average hydrogen bond interactions decrease. The competing effects of the number and length of I-H may lead to the g10 composite exhibiting the maximum number of interfacial interactions. The above conclusions are applicable at any temperature, which also shows that the optimum modifier content does not change with temperature.
| Samples | Average length of hydrogen bonds at the interface (Å) | ||
|---|---|---|---|
| 200 K | 298 K | 373 K | |
| Silica/g3 | 1.8719 | 1.8942 | 1.9434 |
| Silica/g8 | 1.8897 | 1.9129 | 1.9519 |
| Silica/g10 | 1.9169 | 1.9291 | 1.9526 |
| Silica/g15 | 1.9230 | 1.9380 | 1.9970 |
4 Conclusions
Two types of models (amorphous and layered) were constructed for silica/SBR composites with different modifier content to investigate the temperature dependence of their interfacial bonding characteristics at the molecular level. The main conclusions are summarized in the following sections. These conclusions deepen the understanding of the interfacial bonding characteristics of silica/in-chain modified SBR composites and provide theoretical guidance for the rational interfacial design of composites.(i) The density, cohesive energy, solubility and Tg values of SBR increase with an increase in modifier content. The FFVs of silica/SBR composites with various modifier content show different dependence on temperature. Below the Tg value, the FFVs of unmodified SBR composites are the largest; above the Tg value, the FFVs of the composites increase with increasing modifier content. In addition, the higher the modifier content, the more sensitive the FFV is to temperature. The steric hindrance of modifier and hydrogen bonding are the causes of the different temperature dependence.
(ii) Filler-rubber interactions and rubber–rubber interactions decrease with increasing temperature. There is a transition temperature at which the rubber–rubber interactions change from strong to weak, and the transition temperature increases with increasing modifier content.
(iii) The relative concentration of SBR chains at the interface between silica and SBR first increases rapidly within a distance of 5 Å from the silica surface, reaches a relatively stable point, and then decreases rapidly for each composite and temperature. The concentration profile of the g15 composite is significantly different from those of the other composites, and the difference becomes more obvious with an increase in the temperature. Temperature has different effects on the mobility of SBR chains at the interface and the thickness of the interface layer decreases with increasing temperature. The stronger the interfacial interactions, the less sensitive the motion of SBR chains is to temperature.
(iv) The changes in the number of hydrogen bonds of composites with higher modifier content are more sensitive to temperature. The competing effects of hydrogen bonding and steric hindrance of modifier and rubber–rubber interactions lead to the existence of an optimum modifier content (14.2 wt%), and this optimum content is independent of temperature.
Conflicts of interest
There are no conflicts to declare.Acknowledgements
The authors gratefully acknowledge the National Natural Science Foundation of China (Grant No. 51903122) and the start-up funds for the talents of Nanjing Forestry University (No. 163101128).References
- P. Thaptong, P. Sae-Oui and C. Sirisinha, J. Appl. Polym. Sci., 2016, 133, 43342 CrossRef.
- X. Liu, S. Zhao, X. Zhang, X. Li and Y. Bai, Polymer, 2014, 55, 1964–1976 CrossRef CAS.
- B. Ahn, N. Park, D. Kim and W. Kim, Rubber Chem. Technol., 2019, 92, 364–377 CrossRef CAS.
- X. Liu, S. Zhao, Y. Yang, X. Zhang and Y. Wu, J. Appl. Polym. Sci., 2014, 131, 40348 Search PubMed.
- L. Qu, L. Wang, X. Xie, G. Yu and S. Bu, RSC Adv., 2014, 4, 64354–64363 RSC.
- C. Sun, S. Wen, H. Ma, Y. Li, L. Chen, Z. Wang, B. Yuan and L. Liu, Ind. Eng. Chem. Res., 2019, 58, 1454–1461 CrossRef CAS.
- J. Justynska, Z. Hordyjewicz and H. Schlaad, Polymer, 2005, 46, 12057–12064 CrossRef CAS.
- E. Passaglia and F. Donati, Polymer, 2007, 48, 35–42 CrossRef CAS.
- Z. Sun, Q. Huang, Y. Wang, L. Zhang and Y. Wu, Ind. Eng. Chem. Res., 2017, 56, 1471–1477 CrossRef CAS.
- C. Hoyle and C. Bowman, Angew. Chem., Int. Ed., 2010, 49, 1540–1573 CrossRef CAS PubMed.
- Y. Luo, L. Qu, H. Su, T. W. Chan and S. Wu, RSC Adv., 2016, 6, 14643–14650 RSC.
- D. Barbier, D. Brown, A. C. Grillet and S. Neyertz, Macromolecules, 2004, 37, 4695–4710 CrossRef CAS.
- L. Chen, K. Zheng, X. Y. Tian, K. Hu, R. X. Wang, C. Liu, Y. Li and P. Cui, Macromolecules, 2010, 43, 1076–1082 CrossRef CAS.
- F. Rabie, L. Polakova, S. Fallas, Z. Sedlakova, E. Marand and S. M. Martin, Membranes, 2019, 9, 104 CrossRef CAS PubMed.
- A. Fuoco, B. Comesana-Gandara, M. Longo, E. Esposito, M. Monteleone, I. Rose, C. G. Bezzu, M. Carta, N. B. McKeown and J. C. Jansen, ACS Appl. Mater. Interfaces, 2018, 10, 36475–36482 CrossRef CAS.
- W. Salgueiro, A. Somoza, L. Silva, G. Consolati, F. Quasso, M. A. Mansilla and A. J. Marzocca, Phys. Rev. E, 2011, 83, 051805 CrossRef CAS.
- A. Scurati, W. L. Hergenrother and C. J. Lin, J. Appl. Polym. Sci., 2008, 108, 1722–1736 CrossRef CAS.
- T. K. Lee, S. Afiqah, A. Ahmad, H. M. Dahlan and M. Y. A. Rahman, J. Solid State Electrochem., 2012, 16, 2251–2260 CrossRef CAS.
- L. V. Taranu, P. Notingher and C. Stancu, Rev. Roum. Sci. Tech., Ser. Electrotech. Energ., 2018, 63, 243–248 Search PubMed.
- M. F. Kabir, W. M. Daud, K. B. Khalid and H. A. A. Sidek, Wood Fiber Sci., 2001, 33, 233–238 CAS.
- N. Candau, R. Laghmach, L. Chazeau, J.-M. Chenal, C. Gauthier, T. Biben and E. Munch, Polymer, 2015, 60, 115–124 CrossRef CAS.
- Q. Demassieux, D. Berghezan, S. Cantournet, H. Proudhon and C. Creton, J. Polym. Sci., Part B: Polym. Phys., 2019, 57, 780–793 CrossRef CAS.
- C. Xu, Y. Chen, Y. Wang and X. Zeng, J. Appl. Polym. Sci., 2013, 128, 2350–2357 CrossRef CAS.
- X. Li, Y. Dong, Z. Li and Y. Xia, Rubber Chem. Technol., 2011, 84, 453–454 CrossRef CAS.
- B. Li, L. Xu, Q. Wu, T. Chen, P. Sun, Q. Jin, D. Ding, X. Wang, G. Xue and A.-C. Shi, Macromolecules, 2007, 40, 5776–5786 CrossRef CAS.
- F. Yuan, Q.-Y. Li and W. Wang, Chem. J. Chin. Univ., 2011, 32, 2667–2673 CAS.
- M. S. Ryu, H. G. Kim, H. Y. Kim, K.-S. Min, H. J. Kim and H. M. Lee, Phys. Chem. Chem. Phys., 2017, 19, 16498–16506 RSC.
- Y. Luo, Y. Wu, K. Luo, F. Cai, T. Zhai and S. Wu, Compos. Sci. Technol., 2018, 161, 32–38 CrossRef CAS.
- J. Zhu, X. Zhao, L. Liu, R. Yan, M. Song and S. Wu, Polymer, 2018, 155, 152–167 CrossRef CAS.
- Y. Li, Q. Wang and S. Wang, Composites, Part B, 2019, 160, 348–361 CrossRef CAS.
- C. Lv, Q. Xue, D. Xia and M. Ma, Appl. Surf. Sci., 2012, 258, 2077–2082 CrossRef CAS.
- W. Zhang, X. Deng, G. Sui and X. Yang, Carbon, 2019, 145, 629–639 CrossRef CAS.
- H. Eslami, M. Rahimi and F. Mueller-Plathe, Macromolecules, 2013, 46, 8680–8692 CrossRef CAS.
- H. Lu, Z. Zhou, T. Hao, X. Ye and Y. Ne, Macromol. Theory Simul., 2015, 24, 335–343 CrossRef CAS.
- A. Kumar, V. Sundararaghavan and A. R. Browning, Modell. Simul. Mater. Sci. Eng., 2014, 22, 025013 CrossRef.
- L. Deng, Y. Wang and Z.-c. Ou-yang, J. Phys. Chem. B, 2012, 116, 10135–10144 CrossRef CAS PubMed.
- J. Diani, B. Fayolle and P. Gilormini, Mol. Simul., 2008, 34, 1143–1148 CrossRef CAS.
- J. Chen, F. Li, Y. Luo, Y. Shi, X. Ma, M. Zhang, D. W. Boukhvalov and Z. Luo, J. Mater. Chem. A, 2019, 7, 15207–15214 RSC.
- M.-R. Pourhossaini and M. Razzaghi-Kashani, Polymer, 2014, 55, 2279–2284 CrossRef CAS.
- M. A. Sattar, A. S. Nair, P. J. Xavier and A. Patnaik, Soft Matter, 2019, 15, 2826–2837 RSC.
- G. Munao, A. Pizzirusso, A. Kalogirou, A. De Nicola, T. Kawakatsu, F. Mueller-Plathe and G. Milano, Nanoscale, 2018, 10, 21656–21670 RSC.
- J. E. Basconi and M. R. Shirts, J. Chem. Theory Comput., 2013, 9, 2887–2899 CrossRef CAS PubMed.
- M. Montes-Saralegui and G. Kahl, J. Phys.: Condens. Matter, 2015, 27, 325102 CrossRef PubMed.
- A. M. Mazzone, Int. J. Mod. Phys. C, 2001, 12, 31–38 CrossRef.
- C. H. Shin and D. S. Kim, Polym. Adv. Technol., 2008, 19, 1062–1068 CrossRef CAS.
- S. Ata, T. Mizuno, A. Nishizawa, C. Subramaniam, D. N. Futaba and K. Hata, Sci. Rep., 2014, 4, 7232 CrossRef PubMed.
- Y. Luo, R. Wang, W. Wang, L. Zhang and S. Wu, J. Phys. Chem. C, 2017, 121, 10163–10173 CrossRef CAS.
- B. Qiao, X. Zhao, D. Yue, L. Zhang and S. Wu, J. Mater. Chem., 2012, 22, 12339–12348 RSC.
- X. Zhang, N. Hoang, M. Daly, S. T. Nguyen and H. D. Espinosa, Nanoscale, 2019, 11, 12305–12316 RSC.
- K. Luo, W. Zheng, X. Zhao, X. Wang and S. Wu, Mater. Des., 2018, 154, 312–325 CrossRef CAS.
Footnote |
| † Electronic supplementary information (ESI) available: Glass transition temperature of g0, and mean square displacements (MSDs) of the silica/g0 and silica/g15 composites. See DOI: 10.1039/c9ra08325a |
| This journal is © The Royal Society of Chemistry 2019 |


