DOI:
10.1039/C9RA08079A
(Paper)
RSC Adv., 2019,
9, 40051-40061
Fabrication of stable superabsorbent hydrogels for successful removal of crystal violet from waste water†
Received
5th October 2019
, Accepted 28th November 2019
First published on 3rd December 2019
Abstract
Smart superabsorbent hydrogels consisting of acrylamide/sodium alginate (AS), acrylamide/sodium alginate/2-acrylamido-2-methylpropane sulphonic acid (ASAx, x = amount of AMPS) were synthesized via free radical polymerization. The swelling behavior of the hydrogels was studied in distilled and tap water. It was found that by increasing the amount of 2-acrylamido-2-methylpropanesulphonic (AMPS) in the hydrogel composition, the hydrogel swelling capability was enhanced from 3685% for AS to 4797% for ASA1 and 21![[thin space (1/6-em)]](https://www.rsc.org/images/entities/char_2009.gif) 175% for ASA2 in distilled water, while in tap water this property varied from 915% for AS to 988% and 1588% for ASA1 and ASA2, respectively. All the samples were found to be efficient for the removal of crystal violet from aqueous solution. The absorption efficiency and % removal increased from 1.78 mg g−1 and 62.6% for AS to 3.31 mg g−1 and 75% for ASA1 and 3.34 mg g−1 and 82.1% for ASA2. The effects of pH, contact time, initial dye concentration and hydrogel dosage on the removal process were studied in detail. The mechanism of CV removal occurs according to the Freundlich isotherm following pseudo second order kinetics. The thermodynamic parameters showed that the sorption process is spontaneous and endothermic in nature. The superabsorbent hydrogels were regenerated and reused in six consecutive cycles with 5% decrease in efficiency.
175% for ASA2 in distilled water, while in tap water this property varied from 915% for AS to 988% and 1588% for ASA1 and ASA2, respectively. All the samples were found to be efficient for the removal of crystal violet from aqueous solution. The absorption efficiency and % removal increased from 1.78 mg g−1 and 62.6% for AS to 3.31 mg g−1 and 75% for ASA1 and 3.34 mg g−1 and 82.1% for ASA2. The effects of pH, contact time, initial dye concentration and hydrogel dosage on the removal process were studied in detail. The mechanism of CV removal occurs according to the Freundlich isotherm following pseudo second order kinetics. The thermodynamic parameters showed that the sorption process is spontaneous and endothermic in nature. The superabsorbent hydrogels were regenerated and reused in six consecutive cycles with 5% decrease in efficiency.
1. Introduction
Various industries, like textile,1,2 paint,3,4 pharmaceutical,5 and food,6 are the direct contributors of pollutants like dyes,7 heavy metal ions8,9 and other organic pollutants10 to water. These pollutants are toxic and cause severe health problems in human beings and also seriously affect aquatic life.11 Therefore proper treatment of industrial water is required before discharging into water sources. Besides the development of new techniques and materials such as ozonation,12,13 advanced oxidation,14,15 catalysis,16,17 osmosis,18,19 adsorption,20,21 polymer hydrogels,22 activated carbon,23 and superabsorbents,24 water treatment is still a hot area of research.
Currently, due to simple synthesis process, high efficiency, environmental friendly and quick recoverability made superabsorbent hydrogels to be used for waste water treatment in terms of both organic and inorganic pollutants.25,26 The superabsorbent hydrogels are 3D cross-linked polymer network materials which can imbibe a huge amount of water inside its network. The swelling behavior and active charges on the network of superabsorbent hydrogels are responsible for the removal of pollutants from waste water. Therefore, the composition of hydrogels required a key consideration in its synthesis. The introduction of monomers in hydrogel for enhancing the swelling property is mostly due to ionizable hydrophilic groups which are responsive in nature.27 The synthesis of superabsorbent hydrogels with different monomer contribution is also carried out for the betterment of its properties. In previous study, we have prepared zwitterionic superabsorbent hydrogels based on cationic monomer 3-acrylamidopropyl trimethylammoniumchloride (APTMACl) and anionic monomer AMPS. The materials were applied for CV and Congo red (CR) removal from waste water and found efficient.28 In another study acrylamide and acrylicacid based superabsorbent hydrogels were synthesized in different monomer composition, and successfully applied for few selected heavy metal ions removal.29 But the low mechanical strength and fracturing, limits their applications to be used for a long time (in months) in aqueous medium. Therefore, the development of smart materials with superabsorption capacity and large mechanical stability is still a challenging task and needs a proper attention.
The AMPS is an anionic pH sensitive monomer consist of cleavable active sulphonic acid group (–SO3H). The protonation and deprotonation of –SO3H takes place with change in pH of the medium from the pKa value of AMPS, due to which the polymer network undergoes swelling and de-swelling transition.30 The acidic groups also increase the hydrophilicity of the polymeric network thus increase the swelling behavior more and can be applied for absorption of dyes, heavy metal ions and other organic pollutants.31 The fabrication of AMPS in acrylamide/sodiumalginate hydrogels is expected to produce superabsorbents with intense swelling behavior, prolong mechanical stability and high removal capability towards organic dyes.
In this paper we concentrate on the development of superabsorbent hydrogels with extra ordinary high swelling and mechanical behavior, by fabrication different amount of a pH sensitive monomer 2-acrylamido-2-methylpropane sulphonic acid (AMPS) in acrylamide/sodiumalginate hydrogel. The increase in AMPS amount in hydrogel composition introduces a high swelling capacity in hydrogels in both distilled and tap water. The superabsorbent hydrogels showed enhanced mechanical strength and remained stable in water for months without any fracture (physically confirmed). The superabsorbent hydrogels were further tested in the sorption process of toxic crystal violet (CV) from aqueous medium at different environmental conditions in detail. The materials were found more efficient and can be regenerated easily for further purification process. This study will open a new understanding for researchers to fabricate a new materials for waste water treatment in future.
2. Experimental
2.1. Materials
Acrylamide (AAm, BDH), sodium alginate (SA, Daejung Korea), 2-acrylamido-2-methylpropane sulfonic acid (AMPS, Alfa Aesar), N,N′-methylenebisacrylamide (MBA, BDH), ammonium persulphate (APS, Sigma Aldrich), phosphate buffers (pH = 3, 7 and 9, Daejung Korea), crystal violet (CV, Sigma Aldrich), NaNO3 (Merck), NaOH (BDH) and HCl (Sigma) reagents were used as received in this work. Milli-Q double deionized distilled water was used for all experimental work.
2.2. Synthesis of the superabsorbent hydrogels
In the current study the superabsorbent hydrogels were synthesized in a single step using the chemical crosslinking agent (MBA) and thermo-initiator (APS). Initially, the AAm monomer (4 g) and SA polymer (0.5 g) in a ratio of 8![[thin space (1/6-em)]](https://www.rsc.org/images/entities/char_2009.gif) :
:![[thin space (1/6-em)]](https://www.rsc.org/images/entities/char_2009.gif) 1 respectively were dissolved in 28 ml of deionized water in a reaction vessel for 4 h. The MBA, 0.25% with respect to the weight of AAm was added to the solution of AAm/SA and stirred for 30 min to obtain a transparent homogeneous solution. Finally, the APS solution 0.05 g 2 ml−1 of H2O was added and stirred the solution for 10 min. The solution was put in a Petri dish and placed in an oven at 60 °C for 3 h to complete the polymerization process. After 3 h, the prepared hydrogels were collected and cut into desired shape, the silicon oil was sprayed on the hydrogels to retain the water molecules inside the gel matrix. The sample was coded as AS and saved for further use at ambient temperature.
1 respectively were dissolved in 28 ml of deionized water in a reaction vessel for 4 h. The MBA, 0.25% with respect to the weight of AAm was added to the solution of AAm/SA and stirred for 30 min to obtain a transparent homogeneous solution. Finally, the APS solution 0.05 g 2 ml−1 of H2O was added and stirred the solution for 10 min. The solution was put in a Petri dish and placed in an oven at 60 °C for 3 h to complete the polymerization process. After 3 h, the prepared hydrogels were collected and cut into desired shape, the silicon oil was sprayed on the hydrogels to retain the water molecules inside the gel matrix. The sample was coded as AS and saved for further use at ambient temperature.
2-Acrylamido-2-methylpropane sulfonic acid (AMPS) functionalized AS hydrogels were prepared by the same procedure with different amount of AMPS, 0.12 g and 0.25 g. Here the amount of MBA was added with respect to both AAm and AMPS. These samples were coded as ASA1 and ASA2, where A1 and A2 represent the 0.12 g and 0.25 g weight of AMPS respectively used in the feed composition.
2.3. Characterization
The samples AS, ASA1 and ASA2 were characterized by gravimetric method for swelling investigation, FT-IR spectra were recorded using PerkinElmer Spectrum version 10.5.1, which provides information about the functional groups existence in hydrogels network and confirms the formation. Scanning Electron Microscopy (SEM, JSM-5910, JEOL) was performed for elucidation of surface morphology of the materials. The absorbance of the CV in aqueous medium was found by UV-Visible spectrophotometer (UV-2100).
2.4. Swelling ratio
The gravimetric method was used to investigate the water absorption capacity32 of the hydrogels in distilled as well as in tap water at different pH. The hydrogels were cut into small pieces having length and width of 1 cm and dry at ambient temperature for two days. Once the hydrogels are completely dry, then the weighted sample was placed in distilled and tap water. With different intervals of time the hydrogels were taken out from the water, the surface water was removed with tissue paper and increase in the weight was noted. The percent swelling was calculated from eqn (1);| |
 | (1) |
where ws representing the weight of the swollen hydrogels and wd is the weight of dried hydrogels.
2.5. Absorption study
Batch absorption experiments were performed to check the removal performance of superabsorbent hydrogels towards CV in aqueous medium. A typical amount of superabsorbent hydrogels were taken and placed in CV solution with known concentration. The experiments were performed at room temperature given 16 h equilibrium time. The concentration of the CV was found by measuring the absorption intensity at λmax = 588 nm with intervals of time. The provided conditions for each experiment is mentioned in each caption of the figures.
3. Results and discussion
3.1. Characterization of hydrogels before and after CV absorption
The samples AS, ASA1 and ASA2 were characterized by FT-IR spectroscopy as shown in Fig. S1.† The analysis were based on, before and after absorption of CV dye by each sample. In sample AS, two peaks at 1600 cm−1 and 1649 cm−1 were found which show N–H bending vibration and C![[double bond, length as m-dash]](https://www.rsc.org/images/entities/char_e001.gif) O stretching vibration, while 1320 cm−1 indicate the bending vibrations due to the presence of NH–CO group (amide) and –NH group respectively. The C
O stretching vibration, while 1320 cm−1 indicate the bending vibrations due to the presence of NH–CO group (amide) and –NH group respectively. The C![[double bond, length as m-dash]](https://www.rsc.org/images/entities/char_e001.gif) O asymmetrical brooding peak were found at 1650 cm−1 which is due to the bending mode of O–H strongly adhered molecules of water.33 Similarly, the N–H primary amine bending were mostly reported in the range of 1590–1650 cm−1 by the workers.34 The decrease in intensity and slight shifting in the peak at 1260 cm−1 in hydrogels after absorption of CV shows the interaction of C–N group of copolymer hydrogels with CV molecules.
O asymmetrical brooding peak were found at 1650 cm−1 which is due to the bending mode of O–H strongly adhered molecules of water.33 Similarly, the N–H primary amine bending were mostly reported in the range of 1590–1650 cm−1 by the workers.34 The decrease in intensity and slight shifting in the peak at 1260 cm−1 in hydrogels after absorption of CV shows the interaction of C–N group of copolymer hydrogels with CV molecules.
The new peak in FTIR spectra for ASA1 and ASA2 at 1173 cm−1 compared to AS, is due to bending vibration of –SO3 group and confirms the functionalization of AMPS in ASA hydrogels. However, after absorption of CV, this peak disappeared and shows the existence of interactions between –SO3 group of AMPS and CV molecules. Other peaks were found at 3336 cm−1 and 3177 cm−1 which are due to stretching vibration of –OH and –CO–OH groups respectively. The peak at 2941 cm−1 is for asymmetric stretching vibration of –CH2 groups present in the chain.
SEM analysis was performed to investigate the morphology of prepared materials and results are given in Fig. 1. Before absorption of CV, the surface of sample AS was rough and porous (Fig. 1a), the roughness and porosity was further enhanced with the incorporation of AMPS in ASA1 (Fig. 1b) and ASA2 (Fig. 1c) samples. Therefore, the removal capability of samples towards CV in aqueous environment follow ASA2 > ASA1 > AS order. The SEM analysis was also performed after absorption of dye molecules and results are given in Fig. 1(d–f), which shows the homogenous smooth surface for all hydrogels. It is because of occupying the surface active sites of hydrogels by CV molecules. Thus SEM is the key characterizing tools for the surface texture, surface shape, smoothness and surface porosity of the synthesized materials.35
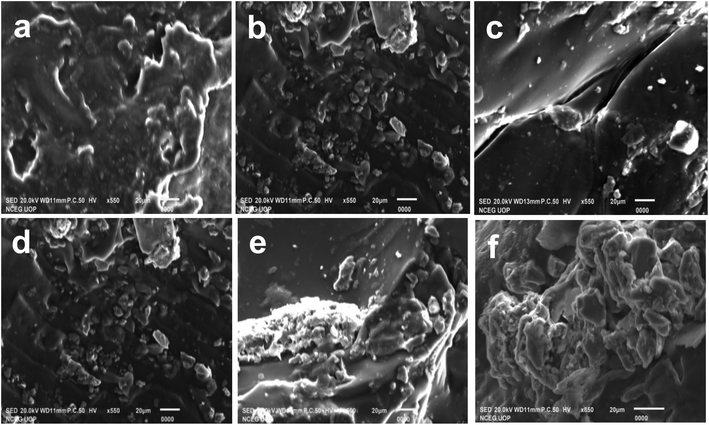 |
| | Fig. 1 SEM images of samples before absorption of CV (a) AS, (b) ASA1, (c) ASA2 and after absorption of CV (d) AS, (e) ASA1 and (f) ASA2. | |
3.2. Swelling properties
Fig. 2 shows the swelling properties of the superabsorbent hydrogels determined in both distilled and tap water. The results clearly indicate the super absorptive nature of the hydrogels in both types of water. According to our expectations, the addition of AMPS was very effective in case of absorption for both, but particularly to distilled water. The results shown in Fig. 2, clearly indicate that addition of AMPS increased the capability of the superabsorbent hydrogel to take up (swell) a lot of water (Fig. 2a), which varied from 3685% (AS) to 4797% (ASA1) and 21![[thin space (1/6-em)]](https://www.rsc.org/images/entities/char_2009.gif) 175% (ASA2) in distilled water (Fig. 2b), and from 915% (AS) to 988% and 1588% for ASA1 and ASA2 respectively in tap water (Fig. 2c). The Fig. 2a and Video S1† also confirm the stability and mechanical strength of these materials, because after one month in water, the hydrogels not underwent any rupture.
175% (ASA2) in distilled water (Fig. 2b), and from 915% (AS) to 988% and 1588% for ASA1 and ASA2 respectively in tap water (Fig. 2c). The Fig. 2a and Video S1† also confirm the stability and mechanical strength of these materials, because after one month in water, the hydrogels not underwent any rupture.
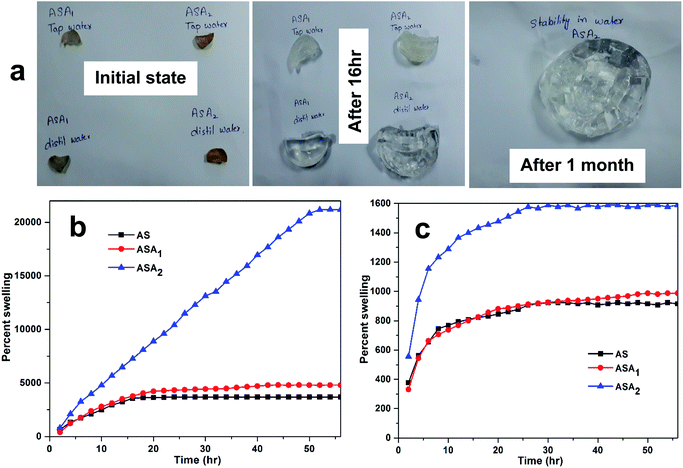 |
| | Fig. 2 (a) Physical changes in superabsorbent hydrogels during swelling and the percent swelling behavior in (b) distilled and (c) tap water. | |
The swelling behavior of the hydrogels depends on the ionizable groups attached with the backbone of the polymer hydrogel. Hydrogels with more ionizable groups show enhanced swelling capacity compared to non ionizable group's hydrogels. Furthermore density of crosslinking also affect the swelling properties of hydrogels in inverse manner.36,37 In the present study these ionizable groups are also responsible for the absorption of distilled water. Initially, AS consist of acrylamide and alginate, in which acrylamide contains non ionizable groups, while alginate contains carboxylic functional groups which is hydrophilic in nature, and deprotonated in distilled water and produce the electrostatic repulsion between carboxylic groups, due to which the hydrogel swells enough.38 As discussed above the addition of AMPS (0.12 g) enhance the water absorption capability of the hydrogel the reason behind this capability is that AMPS consist of –CONH and –SO3H groups which are the hydrophilic groups and produce additive effect by carboxylic group of sodium alginate and as a result the water up takes capability increase. Further increase in AMPS (0.25) amount were further increase the water absorption due to the number of hydrophilic groups present in AMPS.39,40
3.3. Absorption study
3.3.1. Point of zero charge (PZC) and effect of pH on the absorption of CV. PZC is the value at which the surface of the materials becomes zero and all the active sites remains neutral. The PZC of sample AS, ASA1 and ASA2 were determined by putting 0.1 g of each sample in 30 ml of 0.1 N NaNO3 solution. Each solution was distributed in 11 bottles with different pH ranging from 2–11. The pH of each bottle was adjusted by 0.1 M NaOH and 0.1 M HNO3 solution and monitored by pH meter (pH-2106). The bottles were shakeup in shaker and then leave the bottles for 24 h. The final pH of the bottles were determined and noted by pH meter and the PZC of the all the three samples was calculated by using equation ΔpH = pHi − pHf.41 Where pHi is the initial pH and pHf is the final pH of the solution.The PZC of sodium alginate was found pHzpc = 7.5, below this value the surface become positively charged and above which the surface acquired negative charge for the removal of positive dyes.41 The acrylamide affects the PZC of sodium alginate and due to the less % age of alginate and greater % age of acrylamide lowers the value of PZC to 7.06, 6.7 and 6.1 for AS, ASA1 and ASA2 respectively (Fig. 3a). The absorption and removal of the CV from aqueous medium by superabsorbent hydrogels occurs by two processes. First one is the diffusion of CV in the network of hydrogels with the penetration of water molecules and second process is associated with the electrostatic attractive forces. The pH has a considerable and observable effect on the absorption process of dye. The Fig. 3b shows that removal ability of all the samples increases with increase in pH of the medium, but at the point of PZC for all the samples the % removal slightly decreases due to the isoelectric point. The % removal at this stage is due to the swelling of the gel which compels the dye to diffuse within the gel network along with water. After PZC the % removal increased abruptly because of the availability of negative sites on the hydrogel network. The maximum absorption and % removal of the dyes by each sample depends on the amount of negative sites on the hydrogels. The % removal for AS increased from 60% to 65.7% and decreased to 64% at pH < PZC (pH 7.06) and again reached to 72% at pH 11, which is due to diffusion and electrostatic attractions between dye and polymer network. The % removal of ASA1 decreased from 70% to 68.7% at pH = PZC (pH 6.7) and immediately increased from 68.7% to 83% with increasing pH values due to the appearance of negative charge on hydrogel network. Similarly, for sample ASA2 the % removal increased from 81% to 85.2% at pH < PZC (pH 6.1), then again decreased to 84.7% at pH = PZC (pH 6.1) and then increased to 95.4% at pH 11. The % removals of all samples were calculated by using eqn (2);
| |
 | (2) |
where
Co is the initial concentration (ppm) and
Ce is the concentration (ppm) of dye at equilibrium.
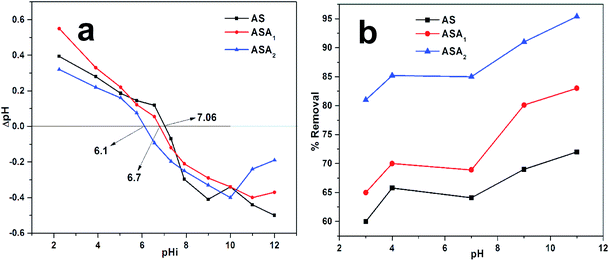 |
| | Fig. 3 (a) Point of zero charge (PZC) and (b) effect of pH on the % removal of CV by superabsorbent hydrogels. Conditions for PZC: temperature 25 °C, dose 0.1 g ± 0.05, equilibrium time 24 h, pH range (2–11) adjusted by 0.1 M HNO3 and NaOH, using NaNO3 0.1 N solution and volume taken 30 ml. | |
3.3.2. Effect of superabsorbent dosage. The dosage effect for all superabsorbent hydrogels on removal of CV was investigated by taking different amount of AS, ASA1 and ASA2. The dose of each sample was taken separately ranging from 0.02 to 0.12 g at pH 7.06 for sample AS, pH 6.7 for sample ASA2 and pH 6.1 for sample ASA1 at 25 °C for 16 h (equilibrium time). It was found that the % removal of CV increased from 55% to 71.6% for AS, 62 to 82% for ASA1 and 67.3 to 94.7% for ASA2 as indicated in Fig. 4. This shows the increase in sorption capacity with increase in amount of superabsorbent hydrogels, which is due to the more swelling and availability of greater number of active sites with increase in dose of superabsorbent. Thus both diffusion and sorption are responsible for the removal of CV from the model solution.
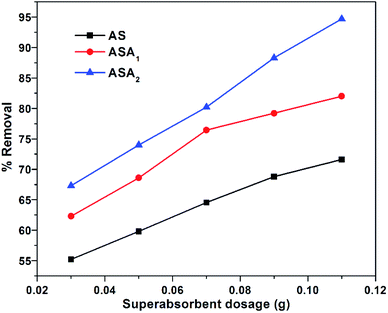 |
| | Fig. 4 % removal as a function of dosage of superabsorbent hydrogels. Conditions: temperature: 25 °C, equilibrium time: 16 h, concentration of CV: 5 mg L−1, pH for: AS 7.05, ASA2 6.1 and ASA1 6.7. | |
3.3.3. Effect of contact time. Contact time effect of each sample was studied for % removal of CV by taking different initial concentrations i.e. 3 ppm, 5 ppm, 7 ppm, 9 ppm and 11 ppm of CV at 25 °C. The equilibrium contact time range was from 0.2 to 16 h. The absorbed amount at any time t (qt, mg g−1) was plotted against time (t, h) as shown in Fig. 5. The rate of sorption was greater at first due to presence of large number of active sites on polymer network, but with the passage of time the sorption process is decreased due to occupation of active sites by CV molecules and reduces the number of active sites for electrostatic interaction between dye molecules and that of superabsorbent hydrogel till equilibrium was established. The equilibrium time for ASA2 was 16 h, and 14 h for AS and ASA1 samples. The difference in the equilibrium time was probably due to swelling pattern of samples and existence of AMPS monomer in polymer network.
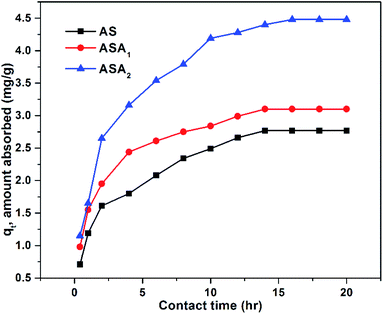 |
| | Fig. 5 qt (amount absorbed at time t) as a function of contact time (t). Conditions: initial concentration of CV: 9 mg L−1, temperature: 25 °C, pH for: AS 7.06, ASA1 6.8 and ASA2 6.1, superabsorbent hydrogel dose: 0.1 g. | |
3.3.4. Batch study. Batch experiments were performed to investigate the absorption capability of synthesized superabsorbent polymer hydrogels towards CV from aqueous solution. In this respect the different initial concentrations of CV i.e. 3 ppm, 5 ppm, 7 ppm, 9 ppm and 11 ppm were prepared and 20 ml from each solution in 50 ml bottles and mixed with each hydrogel sample (0.5 g of each adsorbent mass) separately. The concentration (ppm) of CV was found by measuring the absorption peak at λmax = 588 nm (the characteristic peak for CV). The decrease in intensity of this peak occurs with time, which indicates the removal of CV from aqueous solution by superabsorbent hydrogels, and becomes constant at equilibrium. The absorption capacity or maximum amount of CV adsorbed (qe mg g−1) in sorption process by each sample was calculated using eqn (3);| |
 | (3) |
where qe (mg g−1) is the maximum amount of CV absorbed in mg g−1 by AS, ASA1 and ASA2 super absorbent hydrogels, Co is the initial and Ce is the equilibrium concentration in mg L−1 of the CV in liquid solution, m (g) is the amount of AS, ASA1 and ASA2 used as an absorbent and V is the volume (ml) of solution. The % removal and qe values were measured and tabulated in Table 1. The obtained data indicates that the qe increased from 0.733 mg g−1 to 1.78 mg g−1 for AS, 0.925 mg g−1 to 3.31 mg g−1 for ASA1 and 0.95 mg g−1 to 3.34 mg g−1 for ASA2, which shows that the absorbed amount of CV increases with the increase in initial concentration from 3 ppm to 11 ppm (Fig. 6a). On the other hand the % removal of the CV decreases for all the three samples with increase in the initial concentration of CV from 3 ppm to 11 ppm (Fig. 6b) due to the occupying of the active sites of the adsorbent, while at low concentration (3 ppm) sufficient numbers of active surfaces are available for the removal and adsorption process.42
Table 1 Absorption capacity qe (mg g−1) and % removal of AS, ASA1 and ASA2 towards CV at different initial concentration
| Initial concentration (ppm) |
qe (mg g−1) |
% removal |
| AS |
ASA1 |
ASA2 |
AS |
ASA1 |
ASA2 |
| 3 |
0.73 |
0.925 |
0.95 |
76 |
90.1 |
97.44 |
| 5 |
1.15 |
1.47 |
1.55 |
71 |
85.2 |
95.2 |
| 7 |
1.4 |
2.06 |
2.13 |
67 |
81 |
91.88 |
| 9 |
1.51 |
2.64 |
2.73 |
64.1 |
77.3 |
84.23 |
| 11 |
1.78 |
3.31 |
3.34 |
62.6 |
75 |
82.1 |
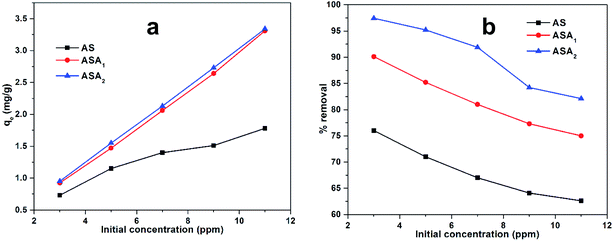 |
| | Fig. 6 (a) qe (mg g−1) and (b) % removal as a function of initial concentration of CV used. | |
3.3.5. Kinetic study. The kinetic study for the synthesized samples AS, ASA1 and ASA2 was performed by applying Lagergren pseudo first order and pseudo second order kinetics for CV removal during sorption process. The linear form of Lagergren pseudo first order kinetics is given in eqn (4);| |
ln(qe − qt) = ln![[thin space (1/6-em)]](https://www.rsc.org/images/entities/char_2009.gif) Qe − kLt Qe − kLt
| (4) |
where qe (mg g−1) is the maximum absorbed amount of CV at equilibrium, qt (mg g−1) is absorption at different intervals of time (t) before equilibrium, while kL1 (min−1) is known as the rate constant of pseudo first order kinetics equation. The experimental data obtained was plotted between ln(qe − qt) vs. t (h) (Fig. 7) and the kinetic parameters Qe and kL1 were calculated from the intercept and slope of the graph respectively. The Table 2 denotes all the calculated values for pseudo first order kinetics. The clear and pronounced difference between experimental absorption capacity (qexp) and calculated absorption capacity (qcal) of superabsorbent hydrogels (AS, ASA1 and ASA2) towards CV removal from aqueous solution indicates the deviation from pseudo first order kinetics. Also the irregularity in kL1 values and low values of regression factor (R2) than unity confirms the deviation from the pseudo first order kinetics.
 |
| | Fig. 7 Lagergren pseudo first-order kinetics for removal of CV by (a) AS, (b) ASA1 and (c) ASA2 from aqueous solution with different initial concentration of CV. | |
Table 2 Calculated kinetic parameters for the removal of CV by superabsorbent hydrogels from aqueous medium
| Sample |
Initial concentration (ppm) |
Pseudo first order kinetics |
Pseudo second order kinetics |
| kL (min−1) |
qexp (mg g−1) |
qcal (mg g−1) |
R2 |
k2 (min−1) |
qexp (mg g−1) |
qcal (mg g−1) |
R2 |
| AS |
3 |
0.253 |
0.73 |
0.53 |
0.93 |
1.12 |
0.73 |
0.728 |
0.98 |
| 5 |
0.208 |
1.15 |
0.63 |
0.95 |
1.05 |
1.15 |
1.153 |
0.99 |
| 7 |
0.267 |
1.40 |
1.35 |
0.83 |
0.699 |
1.40 |
1.4 |
0.99 |
| 9 |
0.137 |
1.51 |
0.73 |
0.82 |
0.56 |
1.51 |
1.506 |
0.99 |
| 11 |
0.294 |
1.78 |
1.46 |
0.98 |
0.416 |
1.78 |
1.777 |
0.99 |
| ASA1 |
3 |
0.127 |
0.925 |
0.316 |
0.98 |
1.91 |
0.925 |
0.926 |
0.99 |
| 5 |
0.110 |
1.47 |
0.433 |
0.15 |
0.458 |
1.47 |
1.469 |
0.97 |
| 7 |
0.157 |
2.06 |
1.18 |
0.82 |
0.392 |
2.06 |
2.056 |
0.97 |
| 9 |
0.260 |
2.64 |
2.74 |
0.91 |
0.176 |
2.64 |
2.643 |
0.95 |
| 11 |
0.139 |
3.31 |
2.91 |
0.92 |
0.09 |
3.31 |
3.315 |
0.90 |
| ASA2 |
3 |
0.328 |
0.95 |
0.943 |
0.95 |
0.392 |
0.95 |
0.949 |
0.97 |
| 5 |
0.369 |
1.55 |
1.145 |
0.88 |
0.511 |
1.55 |
1.552 |
0.99 |
| 7 |
0.496 |
2.13 |
3.38 |
0.92 |
0.320 |
2.13 |
2.132 |
0.98 |
| 9 |
0.626 |
2.73 |
5.982 |
0.90 |
0.251 |
2.73 |
2.727 |
0.98 |
| 11 |
0.297 |
3.34 |
3.25 |
0.97 |
0.187 |
3.34 |
3.339 |
0.98 |
The obtained data was further interpreted by applying pseudo second order kinetics using a linear eqn (5);
| |
 | (5) |
where
k2 (min
−1) is the rate constant of second order kinetics. A plot was plotted between
t/
qt vs. t at different concentration for each superabsorbent hydrogel sample and the results are shown in
Fig. 8. The unknown parameters were calculated from the slope and intercept of the equation and tabulated in
Table 2. In this case the experimental (
qexp) and calculated (
qcal) values for sample AS, ASA
1 and ASA
2 are in a close relation. Similarly, the regression factor (
R2) are very close to unity, thus showed that the data for all samples was best fit in pseudo second order kinetics.
 |
| | Fig. 8 Pseudo second order kinetics for removal of CV by (a) AS, (b) ASA1 and (c) ASA2 from aqueous solution with different initial concentration of CV. | |
3.4. Sorption mechanism
The Freundlich and Langmuir isotherms were applied to check the sorption mechanism of superabsorbent hydrogels towards the CV from aqueous solution. The models were investigated at temperatures 303, 308 and 313 K, but for the present investigation the optimum temperature was selected.
3.4.1. Langmuir isotherm. Langmuir isotherm model is based on the monolayer formation of adsorbate (CV in this study) on the surface of adsorbent (superabsorbent hydrogels) and the mathematical expression is mentioned in eqn (6);| |
 | (6) |
where Ce (mg L−1) is equilibrium concentration of CV in aqueous medium, qe (mg g−1) is the maximum amount of CV absorbed on adsorbent, KL (L g−1) is the Langmuir constant (free energy) and qm (mg g−1) is the adsorption capacity for monolayer formation of adsorbent. The experimental data was plotted in Fig. 9, the graph was obtained between Ce/qe vs. Ce, while the KL and qm (mg g−1) values were calculated from the intercept and slope of the graph respectively. The Langmuir constant (KL) gives information about the strength of interaction between adsorbate and absorbent. High the KL value, stronger will be the interaction and vice versa. In this study, the KL value for all superabsorbent hydrogel samples are very small (shown in Table 3), which shows weak extent of interaction between these materials and CV. Moreover, the less values of R2 and the deviated theoretical qe values from experimental qe values clearly indicate that the sorption process not follows the Langmuir model (Table 3). However, the greater values of ΔH° such as 249 kJ mol−1 for AS, 377 kJ mol−1 for ASA1 and 403 kJ mol−1 for ASA2 indicates the chemisorption interaction of the CV with superabsorbent hydrogels. The separation factor (RL) for AS, ASA1 and ASA2 was calculated by using eqn (7). The RL values for all samples lies between 0 to 1 (Table 3), which shows that the process is favorable.| |
 | (7) |
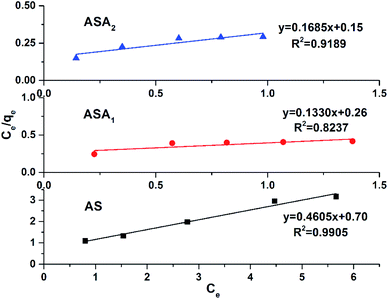 |
| | Fig. 9 Langmuir isotherm model for removal of CV from aqueous medium using superabsorbent hydrogels. | |
Table 3 The measured parameters with application of different isotherms
| Samples |
Langmuir isotherm |
Freundlich isotherm |
| KL (L g−1) |
qm,exp (mg g−1) |
qm,cal (mg g−1) |
R2 |
RL |
KF (L g−1) |
n |
1/n |
R2 |
| AS |
0.658 |
1.78 |
2.172 |
0.9905 |
0.105 |
0.871 |
2.41 |
0.415 |
0.974 |
| ASA1 |
0.512 |
3.31 |
7.519 |
0.8237 |
0.073 |
3.169 |
1.56 |
0.641 |
0.994 |
| ASA2 |
1.123 |
3.34 |
5.935 |
0.9189 |
0.043 |
2.455 |
1.43 |
0.700 |
0.986 |
3.4.2. Freundlich isotherm. The data was further analyzed by Freundlich isotherm to check the mechanism of the removal of CV by superabsorbent hydrogels. Freundlich adsorption mechanism is based on multilayer formation and is not limited to monolayer of adsorbate on surface of adsorbent and heterogeneous in nature. All the samples data were plotted by using the logarithmic form of Freundlich isotherm as mentioned in eqn (8);| |
 | (8) |
where qe (mg g−1) is the adsorption capacity of dye absorbed on absorbent, Ce (mg L−1) equilibrium concentration of dye in aqueous medium, KF (mg g−1) is the Freundlich adsorption constant, while n indicates the adsorption intensity (Freundlich parameter). The KF and n values were calculated from the intercept and slope respectively by plotting log![[thin space (1/6-em)]](https://www.rsc.org/images/entities/char_2009.gif) qe vs. log
qe vs. log![[thin space (1/6-em)]](https://www.rsc.org/images/entities/char_2009.gif) Ce as shown in Fig. 10 (Table 3). The higher the KF value in comparision to KL value (Langmuir constant) of all sample along with regression factor R2 close to 1, supported the dye removal mechanism by Freundlich isotherm model. However, the other parameter of the Freundlich model like value of n further highlight the interface concentration within the solution, which can be justify by the n values. When the n value is greater than 1, the process strongly support the sorption process. In this study the value of n for all samples was greater than 1 such as for AS was 2.41, for sample ASA1 was 1.56 and for sample ASA2 the value was 1.43. Therefore we can conclude that the removal of CV from aqueous medium by superabsorbent hydrogels follows the Freundlich isotherm mechanism.
Ce as shown in Fig. 10 (Table 3). The higher the KF value in comparision to KL value (Langmuir constant) of all sample along with regression factor R2 close to 1, supported the dye removal mechanism by Freundlich isotherm model. However, the other parameter of the Freundlich model like value of n further highlight the interface concentration within the solution, which can be justify by the n values. When the n value is greater than 1, the process strongly support the sorption process. In this study the value of n for all samples was greater than 1 such as for AS was 2.41, for sample ASA1 was 1.56 and for sample ASA2 the value was 1.43. Therefore we can conclude that the removal of CV from aqueous medium by superabsorbent hydrogels follows the Freundlich isotherm mechanism.
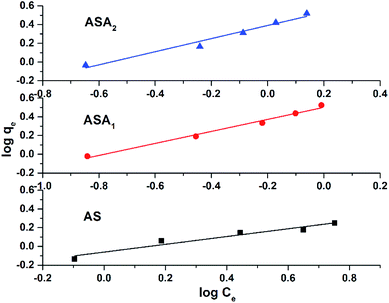 |
| | Fig. 10 Freundlich isotherm model for removal of CV from aqueous medium using superabsorbent hydrogels. | |
3.5. Thermodynamics study
The thermodynamic investigation was performed at different temperatures by measuring the thermodynamic parameters such as ΔG°, ΔH° and ΔS° by using Vont Hoff's equations (eqn (9) to (11)) given as;| |
ΔG° = −RT![[thin space (1/6-em)]](https://www.rsc.org/images/entities/char_2009.gif) ln ln![[thin space (1/6-em)]](https://www.rsc.org/images/entities/char_2009.gif) K K
| (10) |
| |
 | (11) |
where T is the temperature in kelvin, R is universal gas constant (8.314 kJ mol−1 K−1) and K is the thermodynamic equilibrium constant, ΔS° (J mol−1 K−1), ΔH° (kJ mol−1) and ΔG° (kJ mol−1) are change in entropy, enthalpy and Gibb's free energy, respectively. The Fig. 11 shows the graphical representation of the obtained data by potting ln![[thin space (1/6-em)]](https://www.rsc.org/images/entities/char_2009.gif) K vs. 1/T. The slope and intercept of the graph were used to calculate the values of ΔS° and ΔH° and tabulated in Table 4. The ΔG° was calculated by eqn (9) or (10), which confirms the spontaneity of the sorption process. Similarly, K value was obtained by the ratio of Cads/Ce. The obtained positive value of enthalpy change for absorption process of CV dye by AS, ASA1 and ASA2 showed that the process is endothermic and the removal of CV increases with increase in temperature. Similarly, the positive value of entropy change indicated that the randomness in arrangement of dye molecules on superabsorbents with temperature changes. For this purpose the parameters for all samples were studied at three different temperatures i.e. 303 K, 308 K and 313 K. The spontaneity of the process pattern is such that for AS the ΔG° value changed from −178 to −192 kJ mol−1, for ASA1 it was changed to –32.09 from −19 kJ mol−1 and for ASA2 the value changed from −26.66 to −40.83 kJ mol−1. This indicates that the removal of CV is less spontaneous by increasing temperature from 303 K to 313 K. However, the spontaneity of sample AS is less as compared to ASA1 and ASA2 as shown in Table 4. Comparatively speaking the introduction of anionic monomer in sample ASA1 and ASA2 enhanced the thermodynamic parameters of superabsorbent hydrogels.
K vs. 1/T. The slope and intercept of the graph were used to calculate the values of ΔS° and ΔH° and tabulated in Table 4. The ΔG° was calculated by eqn (9) or (10), which confirms the spontaneity of the sorption process. Similarly, K value was obtained by the ratio of Cads/Ce. The obtained positive value of enthalpy change for absorption process of CV dye by AS, ASA1 and ASA2 showed that the process is endothermic and the removal of CV increases with increase in temperature. Similarly, the positive value of entropy change indicated that the randomness in arrangement of dye molecules on superabsorbents with temperature changes. For this purpose the parameters for all samples were studied at three different temperatures i.e. 303 K, 308 K and 313 K. The spontaneity of the process pattern is such that for AS the ΔG° value changed from −178 to −192 kJ mol−1, for ASA1 it was changed to –32.09 from −19 kJ mol−1 and for ASA2 the value changed from −26.66 to −40.83 kJ mol−1. This indicates that the removal of CV is less spontaneous by increasing temperature from 303 K to 313 K. However, the spontaneity of sample AS is less as compared to ASA1 and ASA2 as shown in Table 4. Comparatively speaking the introduction of anionic monomer in sample ASA1 and ASA2 enhanced the thermodynamic parameters of superabsorbent hydrogels.
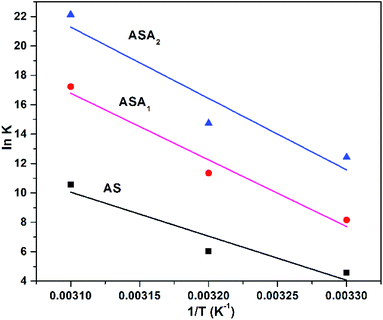 |
| | Fig. 11 Effect of temperature on absorption of CV by superabsorbent hydrogels. Conditions: dose 0.1 g; pH 9 for AS, pH 5.3 for ASA1 and pH 6.8 for ASA2; temperature 303 K, 308 K and 313 K. | |
Table 4 Measured thermodynamic parameters for removal of CV by superabsorbent hydrogels
| Sample |
Initial conc. (mg L−1) |
ΔS° (J mol−1 K−1) |
ΔH° (kJ mol−1) |
R2 |
ΔG° (kJ mol−1) |
| 303 K |
308 K |
313 K |
| AS |
3 |
1.41 |
249 |
0.84 |
−178 |
−185 |
−192 |
| ASA1 |
3 |
1.307 |
377 |
0.94 |
−19.02 |
−25.25 |
−32.09 |
| ASA2 |
3 |
1.42 |
403.6 |
0.83 |
−26.66 |
−33.76 |
−40.83 |
3.6. Recycling performance
The beauty of these superabsorbent hydrogels is the simple regeneration by removing the entrapped dye molecules from inside its network structure. For this purpose the dye entrapped superabsorbent hydrogels were treated with acetone via the solvent extraction method. This method is preferred and more appropriate than other methods because in this method the dye molecules not decompose and recovered in its correct initial state. The recycling performance of these superabsorbent hydrogels was investigated in six consecutive cycles and results are given in Fig. 12. The results indicate that less than 5% decrease in % removal occurred in the sixth (6th) cycle in the recycling process. Which confirms the suitability of these materials to be used for the removal of pollutants from water at any condition.
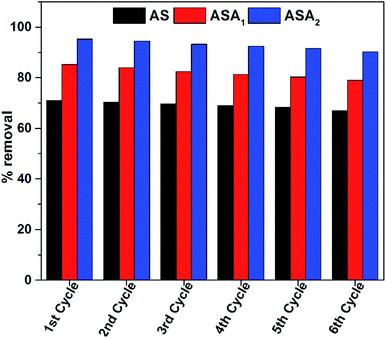 |
| | Fig. 12 Recycling performance of superabsorbent hydrogels towards CV removal. | |
4. Conclusion
Superabsorbent hydrogels of acrylamide/sodiumalginate (AS), acrylamide/sodiumalginate/2-acrylamido-2-methylpropane sulphonic acid (ASA1 and ASA2) were successfully fabricated by free radical polymerization. The comparative study towards swelling behavior and removal of crystal violet (CV) from aqueous medium was studied in detail. The swelling ability of superabsorbents was found increased with the addition of AMPS in both distilled and tap water. The % swelling for AS was 3685%, which increased to 4797% for ASA1 and 21![[thin space (1/6-em)]](https://www.rsc.org/images/entities/char_2009.gif) 175% for ASA2 in distilled water, while in tap water, this property is varied from 915% for AS to 988% and 1588% for ASA1 and ASA2 respectively. All the samples were found more efficient in the sorption process of CV from aqueous medium with adsorption efficiency of 1.78 mg g−1 for AS with % removal of 62.6%, 3.31 mg g−1 for ASA1 with % removal of 75% and 3.34 mg g−1 for ASA2 with 82.1% at pH > PZC for particular sample. The samples kinetics data were best fitted in pseudo second order model, while the mechanism of sorption for all the samples followed Freundlich model. The thermodynamics parameters were investigated and the negative value of ΔG° indicates the spontaneity of the process, while positive value of ΔH° confirmed the endothermic nature of the process. Due to large swelling ability of ASA2, it showed efficient and better removal performance of CV compared to ASA1 and AS. Simple regeneration process, high recycling performance, easy synthesis, easy handling and nontoxic environmental friendly behavior make these materials a good candidate for waste water treatment.
175% for ASA2 in distilled water, while in tap water, this property is varied from 915% for AS to 988% and 1588% for ASA1 and ASA2 respectively. All the samples were found more efficient in the sorption process of CV from aqueous medium with adsorption efficiency of 1.78 mg g−1 for AS with % removal of 62.6%, 3.31 mg g−1 for ASA1 with % removal of 75% and 3.34 mg g−1 for ASA2 with 82.1% at pH > PZC for particular sample. The samples kinetics data were best fitted in pseudo second order model, while the mechanism of sorption for all the samples followed Freundlich model. The thermodynamics parameters were investigated and the negative value of ΔG° indicates the spontaneity of the process, while positive value of ΔH° confirmed the endothermic nature of the process. Due to large swelling ability of ASA2, it showed efficient and better removal performance of CV compared to ASA1 and AS. Simple regeneration process, high recycling performance, easy synthesis, easy handling and nontoxic environmental friendly behavior make these materials a good candidate for waste water treatment.
Conflicts of interest
There are no conflicts of interest to declare.
Acknowledgements
L. A. Shah is highly thankful to Higher Education Commission (HEC) of Pakistan for financial support under research grant no. 7309 National Research Program for Universities (NRPU).
References
- J. Núñez, M. Yeber, N. Cisternas, R. Thibaut, P. Medina and C. Carrasco, J. Hazard Mater., 2019, 371, 705–711 CrossRef.
- G. C. de Oliveira Neto, J. M. F. Correia, P. C. Silva, A. G. de Oliveira Sanches and W. C. Lucato, J. Clean. Prod., 2019, 228, 1514–1525 CrossRef.
- D. Krithika and L. Philip, Int. Biodeterior. Biodegrad., 2016, 107, 31–41 CrossRef CAS.
- M. Taheri, Surf. Interfaces, 2017, 9, 13–20 CrossRef CAS.
- S. Zhou, C. Di Paolo, X. Wu, Y. Shao, T.-B. Seiler and H. Hollert, Environ. Int., 2019, 128, 1–10 CrossRef CAS PubMed.
- N. González, M. Marquès, M. Nadal and J. L. Domingo, Food Chem. Toxicol., 2019, 125, 370–375 CrossRef PubMed.
- K. Hunger, Industrial dyes: chemistry, properties, applications, John Wiley & Sons, 2007 Search PubMed.
- R. S. Lokhande, P. U. Singare and D. S. Pimple, Resour. Environ., 2011, 1, 13–19 Search PubMed.
- P. A. Kobielska, A. J. Howarth, O. K. Farha and S. Nayak, Coord. Chem. Rev., 2018, 358, 92–107 CrossRef CAS.
- L.-M. Beckers, W. Busch, M. Krauss, T. Schulze and W. Brack, Water Res., 2018, 135, 122–133 CrossRef CAS.
- Y. Liu, Y. Nie, J. Wang, J. Wang, X. Wang, S. Chen, G. Zhao, L. Wu and A. Xu, Ecotoxicol. Environ. Saf., 2018, 162, 92–102 CrossRef CAS PubMed.
- F. Daoud, D. Pelzer, S. Zuehlke, M. Spiteller and O. Kayser, Chemosphere, 2017, 185, 953–963 CrossRef CAS PubMed.
- O. A. Alsager, M. N. Alnajrani, H. A. Abuelizz and I. A. Aldaghmani, Ecotoxicol. Environ. Saf., 2018, 158, 114–122 CrossRef CAS PubMed.
- P. Gautam, S. Kumar and S. Lokhandwala, J. Clean. Prod., 2019, 117639 CrossRef CAS.
- M. A. Álvarez, M. Ruidíaz-Martínez, G. Cruz-Quesada, M. V. López-Ramón, J. Rivera-Utrilla, M. Sánchez-Polo and A. J. Mota, Chem. Eng. J., 2019, 122334 Search PubMed.
- L. A. Shah, A. Haleem, M. Sayed and M. Siddiq, J. Environ. Chem. Eng., 2016, 4, 3492–3497 CrossRef CAS.
- L. A. Shah, J. Mol. Liq., 2019, 288, 111045 CrossRef CAS.
- S. Yang, B. Gao, A. Jang, H. kyong Shon and Q. Yue, Chemosphere, 2019, 124485 CrossRef CAS PubMed.
- S. Lee, Y. Kim, J. Park, H. K. Shon and S. Hong, J. Membr. Sci., 2018, 556, 238–247 CrossRef CAS.
- C. Shen, Y. Zhao, W. Li, Y. Yang, R. Liu and D. Morgen, Chem. Eng. J., 2019, 372, 1019–1027 CrossRef CAS.
- Z. Yang, L. Liu, L. Zhao, G. Su, Z. Wei, A. Tang and J. Xue, J. Environ. Sci., 2019, 86, 24–37 CrossRef.
- R. Javed, L. A. Shah, M. Sayed and M. S. Khan, RSC Adv., 2018, 8, 14787–14797 RSC.
- A. Rahman, H. J. Hango, L. Daniel, U. Veikko, S. J. Jaime, S. V. Bhaskaruni and S. B. Jonnalagadda, J. Clean. Prod., 2019, 117689 CrossRef CAS.
- E. Álvarez-Castillo, C. Bengoechea, N. Rodríguez and A. Guerrero, J. Clean. Prod., 2019, 223, 651–661 CrossRef.
- Y. Kong, Y. Zhuang, Z. Han, J. Yu, B. Shi, K. Han and H. Hao, J. Environ. Sci., 2019, 78, 81–91 CrossRef PubMed.
- Y. Zhuang and B. Shi, J. Environ. Sci., 2019, 85, 147–155 CrossRef PubMed.
- T. Xiang, T. Lu, W.-F. Zhao and C.-S. Zhao, Langmuir, 2018, 35, 1146–1155 CrossRef.
- T. U. Rehman, L. A. Shah, M. Khan, M. Irfan and N. S. Khattak, RSC Adv., 2019, 9, 18565–18577 RSC.
- L. A. Shah, M. Khan, R. Javed, M. Sayed, M. S. Khan, A. Khan and M. Ullah, J. Clean. Prod., 2018, 201, 78–87 CrossRef CAS.
- M. Said, Y. Atassi, M. Tally and H. Khatib, J. Polym. Environ., 2018, 26, 3937–3948 CrossRef CAS.
- P. M. Pakdel and S. J. Peighambardoust, J. Environ. Manag., 2018, 217, 123–143 CrossRef PubMed.
- J. Liu, X. Zheng and K. Tang, Rev. Adv. Mater. Sci., 2013, 33, 452–458 CAS.
- J. Ren, F. Weber, F. Weigert, Y. Wang, S. Choudhury, J. Xiao, I. Lauermann, U. Resch-Genger, A. Bande and T. Petit, Nanoscale, 2019, 11, 2056–2064 RSC.
- A. B. D. Nandiyanto, R. Oktiani and R. Ragadhita, Indonesian Journal of Science and Technology, 2019, 4, 97–118 CrossRef.
- K. Elwakeel, A. El-Bindary, A. Ismail and A. Morshidy, J. Dispersion Sci. Technol., 2017, 38, 943–952 CrossRef CAS.
- M. J. Zohuriaan-Mehr and K. Kabiri, Iran. Polym. J., 2008, 17, 451 CAS.
- B. H. Cipriano, S. J. Banik, R. Sharma, D. Rumore, W. Hwang, R. M. Briber and S. R. Raghavan, Macromolecules, 2014, 47, 4445–4452 CrossRef CAS.
- A. Riaz, N. M. Ranjha, A. Jalil, F. Sahar, M. S. Haider, H. S. Sarwar and F. Naeem, Lat. Am. J. Pharm., 2016, 35, 1378–1390 CAS.
- A. Nesic, V. Panic, S. Ostojic, D. Micic, I. Pajic-Lijakovic, A. Onjia and S. Velickovic, Mater. Chem. Phys., 2016, 174, 156–163 CrossRef CAS.
- K. Kabiri, S. Faraji-Dana and M. J. Zohuriaan-Mehr, Polym. Adv. Technol., 2005, 16, 659–666 CrossRef CAS.
- M. El-Bindary, I. El-Deen and A. Shoair, J. Mater. Environ. Sci., 2019, 10, 604–617 Search PubMed.
- A. K. Meena, K. Kadirvelu, G. Mishraa, C. Rajagopal and P. Nagar, J. Hazard Mater., 2008, 150, 619–625 CrossRef CAS.
Footnote |
| † Electronic supplementary information (ESI) available. See DOI: 10.1039/c9ra08079a |
|
| This journal is © The Royal Society of Chemistry 2019 |
Click here to see how this site uses Cookies. View our privacy policy here.  Open Access Article
 *a,
Abbas Khanb and
Muhammad Ateeqb
![[thin space (1/6-em)]](https://www.rsc.org/images/entities/char_2009.gif) 175% for ASA2 in distilled water, while in tap water this property varied from 915% for AS to 988% and 1588% for ASA1 and ASA2, respectively. All the samples were found to be efficient for the removal of crystal violet from aqueous solution. The absorption efficiency and % removal increased from 1.78 mg g−1 and 62.6% for AS to 3.31 mg g−1 and 75% for ASA1 and 3.34 mg g−1 and 82.1% for ASA2. The effects of pH, contact time, initial dye concentration and hydrogel dosage on the removal process were studied in detail. The mechanism of CV removal occurs according to the Freundlich isotherm following pseudo second order kinetics. The thermodynamic parameters showed that the sorption process is spontaneous and endothermic in nature. The superabsorbent hydrogels were regenerated and reused in six consecutive cycles with 5% decrease in efficiency.
175% for ASA2 in distilled water, while in tap water this property varied from 915% for AS to 988% and 1588% for ASA1 and ASA2, respectively. All the samples were found to be efficient for the removal of crystal violet from aqueous solution. The absorption efficiency and % removal increased from 1.78 mg g−1 and 62.6% for AS to 3.31 mg g−1 and 75% for ASA1 and 3.34 mg g−1 and 82.1% for ASA2. The effects of pH, contact time, initial dye concentration and hydrogel dosage on the removal process were studied in detail. The mechanism of CV removal occurs according to the Freundlich isotherm following pseudo second order kinetics. The thermodynamic parameters showed that the sorption process is spontaneous and endothermic in nature. The superabsorbent hydrogels were regenerated and reused in six consecutive cycles with 5% decrease in efficiency.![[thin space (1/6-em)]](https://www.rsc.org/images/entities/char_2009.gif) :
:![[thin space (1/6-em)]](https://www.rsc.org/images/entities/char_2009.gif) 1 respectively were dissolved in 28 ml of deionized water in a reaction vessel for 4 h. The MBA, 0.25% with respect to the weight of AAm was added to the solution of AAm/SA and stirred for 30 min to obtain a transparent homogeneous solution. Finally, the APS solution 0.05 g 2 ml−1 of H2O was added and stirred the solution for 10 min. The solution was put in a Petri dish and placed in an oven at 60 °C for 3 h to complete the polymerization process. After 3 h, the prepared hydrogels were collected and cut into desired shape, the silicon oil was sprayed on the hydrogels to retain the water molecules inside the gel matrix. The sample was coded as AS and saved for further use at ambient temperature.
1 respectively were dissolved in 28 ml of deionized water in a reaction vessel for 4 h. The MBA, 0.25% with respect to the weight of AAm was added to the solution of AAm/SA and stirred for 30 min to obtain a transparent homogeneous solution. Finally, the APS solution 0.05 g 2 ml−1 of H2O was added and stirred the solution for 10 min. The solution was put in a Petri dish and placed in an oven at 60 °C for 3 h to complete the polymerization process. After 3 h, the prepared hydrogels were collected and cut into desired shape, the silicon oil was sprayed on the hydrogels to retain the water molecules inside the gel matrix. The sample was coded as AS and saved for further use at ambient temperature.

![[double bond, length as m-dash]](https://www.rsc.org/images/entities/char_e001.gif) O stretching vibration, while 1320 cm−1 indicate the bending vibrations due to the presence of NH–CO group (amide) and –NH group respectively. The C
O stretching vibration, while 1320 cm−1 indicate the bending vibrations due to the presence of NH–CO group (amide) and –NH group respectively. The C![[double bond, length as m-dash]](https://www.rsc.org/images/entities/char_e001.gif) O asymmetrical brooding peak were found at 1650 cm−1 which is due to the bending mode of O–H strongly adhered molecules of water.33 Similarly, the N–H primary amine bending were mostly reported in the range of 1590–1650 cm−1 by the workers.34 The decrease in intensity and slight shifting in the peak at 1260 cm−1 in hydrogels after absorption of CV shows the interaction of C–N group of copolymer hydrogels with CV molecules.
O asymmetrical brooding peak were found at 1650 cm−1 which is due to the bending mode of O–H strongly adhered molecules of water.33 Similarly, the N–H primary amine bending were mostly reported in the range of 1590–1650 cm−1 by the workers.34 The decrease in intensity and slight shifting in the peak at 1260 cm−1 in hydrogels after absorption of CV shows the interaction of C–N group of copolymer hydrogels with CV molecules.

![[thin space (1/6-em)]](https://www.rsc.org/images/entities/char_2009.gif) 175% (ASA2) in distilled water (Fig. 2b), and from 915% (AS) to 988% and 1588% for ASA1 and ASA2 respectively in tap water (Fig. 2c). The Fig. 2a and Video S1† also confirm the stability and mechanical strength of these materials, because after one month in water, the hydrogels not underwent any rupture.
175% (ASA2) in distilled water (Fig. 2b), and from 915% (AS) to 988% and 1588% for ASA1 and ASA2 respectively in tap water (Fig. 2c). The Fig. 2a and Video S1† also confirm the stability and mechanical strength of these materials, because after one month in water, the hydrogels not underwent any rupture.


![[thin space (1/6-em)]](https://www.rsc.org/images/entities/char_2009.gif) Qe − kLt
Qe − kLt


![[thin space (1/6-em)]](https://www.rsc.org/images/entities/char_2009.gif) qe vs. log
qe vs. log![[thin space (1/6-em)]](https://www.rsc.org/images/entities/char_2009.gif) Ce as shown in Fig. 10 (Table 3). The higher the KF value in comparision to KL value (Langmuir constant) of all sample along with regression factor R2 close to 1, supported the dye removal mechanism by Freundlich isotherm model. However, the other parameter of the Freundlich model like value of n further highlight the interface concentration within the solution, which can be justify by the n values. When the n value is greater than 1, the process strongly support the sorption process. In this study the value of n for all samples was greater than 1 such as for AS was 2.41, for sample ASA1 was 1.56 and for sample ASA2 the value was 1.43. Therefore we can conclude that the removal of CV from aqueous medium by superabsorbent hydrogels follows the Freundlich isotherm mechanism.
Ce as shown in Fig. 10 (Table 3). The higher the KF value in comparision to KL value (Langmuir constant) of all sample along with regression factor R2 close to 1, supported the dye removal mechanism by Freundlich isotherm model. However, the other parameter of the Freundlich model like value of n further highlight the interface concentration within the solution, which can be justify by the n values. When the n value is greater than 1, the process strongly support the sorption process. In this study the value of n for all samples was greater than 1 such as for AS was 2.41, for sample ASA1 was 1.56 and for sample ASA2 the value was 1.43. Therefore we can conclude that the removal of CV from aqueous medium by superabsorbent hydrogels follows the Freundlich isotherm mechanism.
![[thin space (1/6-em)]](https://www.rsc.org/images/entities/char_2009.gif) ln
ln![[thin space (1/6-em)]](https://www.rsc.org/images/entities/char_2009.gif) K
K

![[thin space (1/6-em)]](https://www.rsc.org/images/entities/char_2009.gif) K vs. 1/T. The slope and intercept of the graph were used to calculate the values of ΔS° and ΔH° and tabulated in Table 4. The ΔG° was calculated by eqn (9) or (10), which confirms the spontaneity of the sorption process. Similarly, K value was obtained by the ratio of Cads/Ce. The obtained positive value of enthalpy change for absorption process of CV dye by AS, ASA1 and ASA2 showed that the process is endothermic and the removal of CV increases with increase in temperature. Similarly, the positive value of entropy change indicated that the randomness in arrangement of dye molecules on superabsorbents with temperature changes. For this purpose the parameters for all samples were studied at three different temperatures i.e. 303 K, 308 K and 313 K. The spontaneity of the process pattern is such that for AS the ΔG° value changed from −178 to −192 kJ mol−1, for ASA1 it was changed to –32.09 from −19 kJ mol−1 and for ASA2 the value changed from −26.66 to −40.83 kJ mol−1. This indicates that the removal of CV is less spontaneous by increasing temperature from 303 K to 313 K. However, the spontaneity of sample AS is less as compared to ASA1 and ASA2 as shown in Table 4. Comparatively speaking the introduction of anionic monomer in sample ASA1 and ASA2 enhanced the thermodynamic parameters of superabsorbent hydrogels.
K vs. 1/T. The slope and intercept of the graph were used to calculate the values of ΔS° and ΔH° and tabulated in Table 4. The ΔG° was calculated by eqn (9) or (10), which confirms the spontaneity of the sorption process. Similarly, K value was obtained by the ratio of Cads/Ce. The obtained positive value of enthalpy change for absorption process of CV dye by AS, ASA1 and ASA2 showed that the process is endothermic and the removal of CV increases with increase in temperature. Similarly, the positive value of entropy change indicated that the randomness in arrangement of dye molecules on superabsorbents with temperature changes. For this purpose the parameters for all samples were studied at three different temperatures i.e. 303 K, 308 K and 313 K. The spontaneity of the process pattern is such that for AS the ΔG° value changed from −178 to −192 kJ mol−1, for ASA1 it was changed to –32.09 from −19 kJ mol−1 and for ASA2 the value changed from −26.66 to −40.83 kJ mol−1. This indicates that the removal of CV is less spontaneous by increasing temperature from 303 K to 313 K. However, the spontaneity of sample AS is less as compared to ASA1 and ASA2 as shown in Table 4. Comparatively speaking the introduction of anionic monomer in sample ASA1 and ASA2 enhanced the thermodynamic parameters of superabsorbent hydrogels.

![[thin space (1/6-em)]](https://www.rsc.org/images/entities/char_2009.gif) 175% for ASA2 in distilled water, while in tap water, this property is varied from 915% for AS to 988% and 1588% for ASA1 and ASA2 respectively. All the samples were found more efficient in the sorption process of CV from aqueous medium with adsorption efficiency of 1.78 mg g−1 for AS with % removal of 62.6%, 3.31 mg g−1 for ASA1 with % removal of 75% and 3.34 mg g−1 for ASA2 with 82.1% at pH > PZC for particular sample. The samples kinetics data were best fitted in pseudo second order model, while the mechanism of sorption for all the samples followed Freundlich model. The thermodynamics parameters were investigated and the negative value of ΔG° indicates the spontaneity of the process, while positive value of ΔH° confirmed the endothermic nature of the process. Due to large swelling ability of ASA2, it showed efficient and better removal performance of CV compared to ASA1 and AS. Simple regeneration process, high recycling performance, easy synthesis, easy handling and nontoxic environmental friendly behavior make these materials a good candidate for waste water treatment.
175% for ASA2 in distilled water, while in tap water, this property is varied from 915% for AS to 988% and 1588% for ASA1 and ASA2 respectively. All the samples were found more efficient in the sorption process of CV from aqueous medium with adsorption efficiency of 1.78 mg g−1 for AS with % removal of 62.6%, 3.31 mg g−1 for ASA1 with % removal of 75% and 3.34 mg g−1 for ASA2 with 82.1% at pH > PZC for particular sample. The samples kinetics data were best fitted in pseudo second order model, while the mechanism of sorption for all the samples followed Freundlich model. The thermodynamics parameters were investigated and the negative value of ΔG° indicates the spontaneity of the process, while positive value of ΔH° confirmed the endothermic nature of the process. Due to large swelling ability of ASA2, it showed efficient and better removal performance of CV compared to ASA1 and AS. Simple regeneration process, high recycling performance, easy synthesis, easy handling and nontoxic environmental friendly behavior make these materials a good candidate for waste water treatment.


