 Open Access Article
Metabolic profile analysis of Zhi-zi-chi decoction in feces of normal and chronic unpredictable mild stress-induced depression rats based on UHPLC-ESI-Q-TOF-MS/MS and multiple analytical strategies †
Kaiwen Luo‡
 * and
Yadong Xing‡
School of Pharmacy, Bengbu Medical University, 2600 Donghai Avenue, Bengbu, 233030, China. E-mail: kevinrowe@163.com
First published on 5th December 2019
Abstract
Zhi-zi-chi decoction (ZZCD) has been verified by clinical application that it has definite curative effects and low side effects on depression. Because it is administered orally, the metabolites of ZZCD in the intestinal tract may influence the curative effects significantly. In this study, UHPLC-ESI-Q-TOF-MS/MS was used in combination with untargeted metabolomics-driven strategy, series product ion filtering and diagnostic fragment ion strategy for acquiring the comprehensive metabolic profile of ZZCD in feces of normal and chronic unpredictable mild stress (CUMS)-induced depression rats after oral administration, while the rat depression model was evaluated by behavior tests and plasma biochemical indices. Finally, a total of 56 compounds, including 35 prototype compounds and 21 metabolites, were identified or tentatively characterized in fecal samples. Among these, ten compounds were sieved as potential chemical markers that would reflect the antidepressant effect of ZZCD, which may offer important information for quality assessment, pharmacokinetic study and clinical security. In conclusion, the metabolic profile of ZZCD in normal and CUMS-induced depression rats would be helpful for the further study of anti-depression material basis and mechanism.
Introduction
The Zhi-zi-chi decoction (ZZCD), composed of Gardenia jasminoides Ellis (ZZ) and Semen Sojae Praeparatum (DDC), is a famous traditional Chinese medicine formula (TCMP) described in Treatise on Cold Damage Diseases (Shang-Han-Lun). Clinical applications over a long period of time have proved that ZZCD is effective in treating depression with low side effects.1 In vitro studies have shown that ZZCD contains a variety of components, such as iridoid glycosides, isoflavones, and organic acids.2 An increasing amount of research has shown that the pharmacological activity of this decoction is ascribed to the superimposed effects of the prototype components,3 metabolites or both in vivo4 via regulating different signaling pathways. Thus, sound research about the metabolic profile of ZZCD in vivo is of great significance.Up to now, the metabolism of ZZCD in plasma, bile and urine has been studied.2,5 However, the metabolism of ZZCD in feces has never been explored yet. Due to the existence of gut microbiota, the intestinal tract can act as an organ with a metabolic potential at least equal to that of the liver,6,7 particularly for TCMPs that are administered orally. The gut microbiota express various enzymes that can metabolically activate, inactivate, or reactivate drugs.7–12 Some chemical components of ZZCD, such as geniposide, caffeic acid, daidzin, and dihydrodaidzein, can be biotransformed by various enzymes from gut microbiota.7,13–16 The reactions include hydrolysis, oxidation, reduction, isomerization, rearrangement, esterification, and condensation.17,18 This indicates that microorganisms may be important for the metabolism of ZZCD. Moreover, researches claimed that the disposition of drugs in disease models is different from normal ones.19,20 If there are significant alterations in gut microbiota in a depressed living organism,21–23 then the metabolic profile of chemical components from ZZCD in the intestinal tract would change. In view of the correlation among the chemical components of ZZCD, gut microbiota and depression, it is significant to reveal the pharmacodynamic material basis of ZZCD for studying its metabolic in feces of normal and depression rats.7,21–24
In view of the interference of a great variety of compounds and microorganisms in feces of a living organism, it is difficult to study the analytes of interest.25–27 For avoiding the metabolism of the microorganisms present in the rat feces samples from affecting the composition of the sample under study, multiple analytical strategies were adopted in this study. Liquid chromatography mass spectrometry (LC-MS) has become an efficient tool for acquiring the structural information of chemical substances in biological samples due to its high separation ability and high resolution.11,28 Nowadays, with the improvements in high-resolution multistage mass spectrometry and related software, such as UHPLC-Q-TOF-MS/MS,29 the information of traditional Chinese medicine prescription (TCMP) metabolites transformed by various metabolic pathways could be acquired in one injection cycle by independent data acquisition (IDA) criteria,30 which is an important data acquisition technique for acquiring the global structural information of samples. The data acquisition in IDA is alternant in low and high level of collision energy (CE). When the CE level is low, the MS spectrum is acquired, while the MS/MS spectrum is acquired under high level of CE. The parent ions are not pre-screened; therefore, the global fragment ions of the chemical components in the samples can be obtained. Moreover, the XCMS online platform (xcmsonline.scripps.edu) is one of the effective tools for data processing.31,32 It is a cloud-based informatic platform, which allows users to easily upload and process liquid chromatography/mass spectrometry-based data with only a few steps. Then, a complete untargeted metabolomic workflow including feature detection, retention time correction, alignment, annotation, statistical analysis, and data visualization provided by XCMS online is operated.33 As a result, three-dimensional datasets including peak codes, m/z-retention time (tR) pairs and ion intensity are acquired,34 which can be downloaded as zip files for offline analysis.33 Additionally, off-line data mining technologies, such as series product ion filtering (sPIF),35 diagnostic fragment ion strategy (DFIS),36,37 principal component analysis (PCA),34 orthogonal partial least square discriminant analysis (OPLS-DA)35 and extracted ion chromatogram (XIC) provided by SIMCA-P (13.0, Umetrics, Umea, Sweden)38 and Peakview™ software (AB Sciex)39 could be useful for the screening and identification of the complex chemical components and metabolites.
In this study, the global metabolic profile of ZZCD in the feces of normal rats and CUMS-induced depression rats was characterized, while multiple identification strategies based on UHPLC-Q-TOF-MS/MS and chemometrics were used. The exogenous constituents in rat feces could be screened and identified comprehensively. Synchronously, the correlation between depression and metabolic compounds of ZZCD, which could show its significance, has been examined in this study.
Experimental
Chemicals and materials
All plant materials were purchased from a Tongrentang chain drugstore (Bengbu, China), while Gardenia jasminoides Ellis (ZZ) (no. 170731) and Sojae Semen Praeparatum (DDC) (no. 170803) were collected from Jiangxi and Anhui, China respectively, which were authenticated by Professor Xian Li (Department of Chinese Materia Medica, Bengbu Medical University, Bengbu, China).Methanol (HPLC-grade) was purchased from Merk (Darmstadt, Germany), while formic acid (HPLC-grade) was purchased from Sigma Chemical (St. Louis, USA). Fresh ultra-pure water was obtained from a Milli-Q system (Bedford, USA). The standards of chlorogenic acid, geniposide, p-cumaric acid and daidzein (purity > 98%) were purchased from Mansite Biotechnology Company (Chengdu, China). All other chemicals and reagents were analytical grade or higher.
Preparation of ZZCD sample
The ZZCD sample was prepared according to the original composition and preparation recorded in the Treatise on Cold Pathogenic Diseases (Shang-Han-Lun). The powder of ZZ (15 g) was decocted in water (300 mL) by boiling. Then, DDC (10 g) was added while the volume of water was reduced to about 200 mL. The decoction was boiled further until the water volume reduced to about 100 mL. The extract was filtered by six layers of gauze and concentrated to 50 mL. Then, the solution was labeled and stored at −20 °C until analysis.For the LC-MS analysis, an aliquot of 2.5 mL of ZZCD was diluted to 10 mL with water and vortexed for 5 min. Then, 3 mL of the diluent was diluted to 10 mL with ethanol and vortexed for 5 min. After placing the mixed liquor for 24 h at 4 °C, it was centrifuged at 12![[thin space (1/6-em)]](https://www.rsc.org/images/entities/char_2009.gif) 000 rpm for 10 min and then, the supernatant was filtered through a 0.22 μm membrane.
000 rpm for 10 min and then, the supernatant was filtered through a 0.22 μm membrane.
Animal experiments
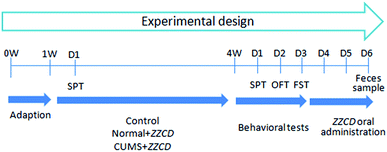
Prescribed by the guide of relevant national legislation and local guidelines, the animal experiments were executed. In brief, male Sprague-Dawley rats (5–6 weeks, 150 ± 20 g) were acquired from the laboratory animal center of Bengbu Medical University (Bengbu, China). In total, 24 rats were adapted in the animal breeding room for one week, with regulated temperature (20–25 °C), humidity (40–70%), and a 12 h light/dark cycle. Purified water and food were provided ad libitum. All rats were fasted with free access to water for 12 h prior to the experiment.Based on the result of the sucrose preference test (SPT) in week 2, rats were divided into three groups randomly with eight in each group. The experimental design can be seen in Fig. 1. Rats in control and normal + ZZCD groups received no treatment, while rats in the CUMS + ZZCD group were subjected to chronic unpredictable mild stress (CUMS) for 3 weeks. Besides, these rats were fed separately, each in a single cage. The protocol of CUMS consisted of ten stressors: forced swimming in ice-water for 10 min, food deprivation for 24 h, water deprivation for 24 h, noise stimulation for 1 h, restraint stress for 2 h, overnight illumination for 8 h, clipping tail for 5 min, horizontal oscillation for 20 min, cage tilting at 45° for 24 h, and a soiled cage environment (600 mL water added to 300 g sawdust bedding) for 24 h. All rats were subjected to various behavioural tests in week 4, including SPT, open-field test (OFT) and forced swimming test (FST).
ZZCD was orally administrated to both the normal + ZZCD group and CUMS + ZZCD group at a dose of 2.625 g kg−1 d−1 for three continuous days. Then, each rat was fed in its respective metabolic cage. Fecal samples were collected from 0 h to 24 h in one bottle per rat. After drying in the darkness on a filter paper and grinding into powder at ambient temperature, the samples were labeled and stored at −20 °C until analysis.
Depression-like behaviours and biochemical analysis
Depression-like behaviours were examined using SPT, open-field test (OFT) and forced swimming test (FST). In SPT, rats were given purified water and 1% sucrose solution ad libitum for 1 h at the same time. Then, the preference to 1% sucrose was calculated by the consumption of purified water and 1% sucrose solution: preference (%) = consumption of 1% sucrose solution/(consumption of 1% sucrose solution + consumption of purified water). In OFT, square boxes (length: 50 cm, width: 50 cm, height: 25 cm), which were divided to 9 squares on average, were used. The score of each rat was based on the time of square-crossing and standing in 3 min. In FST, rats were allowed to swim for 6 min, while the time in immobility in last 4 min was recorded.For biochemical analysis, the plasma of each rat was collected. In short, blood samples of about 1.0 mL were collected in heparinized tubes from the orbital venous plexus, and centrifuged at 3000 rpm for 5 min. Then, the supernates were stored at −20 °C. For analysis, 0.5 mL supernates were acquired for the enzyme-linked immunosorbent assay (Jianglaibio, China). As a result, the concentration of serotonin (5-HT) and dopamine (DA) in plasma levels were measured.
Preparation of feces samples
For the extraction and concentration of chemical components in rat feces, all fecal samples were prepared as follows. Initially, 5 mL 50% methanol-water was chosen as the solvent for dissolving 0.5 g of each sample. Then, ultrasonic treatment at 40 kHz and centrifugation at 4500 rpm were performed for 30 min and 10 min, respectively, in sequence. After transferring to another glass tube, the supernatant was dried to residues by a gentle stream of nitrogen at 30 °C. For LC-MS analysis, 200 μL 50% methanol–water was added to the obtained residues for reconstitution. The mixtures were vortex-mixed (2 min) and centrifuged (12![[thin space (1/6-em)]](https://www.rsc.org/images/entities/char_2009.gif) 000 rpm, 10 min, 4 °C), and an aliquot of 10 μL of the supernatant was injected per sample. For the correction of rats' individual differences, samples which were pooled by the supernatants of homologous samples in equal volume were analyzed by LC-MS for typical chromatograms.
000 rpm, 10 min, 4 °C), and an aliquot of 10 μL of the supernatant was injected per sample. For the correction of rats' individual differences, samples which were pooled by the supernatants of homologous samples in equal volume were analyzed by LC-MS for typical chromatograms.
Chromatographic and mass spectrometric conditions
Samples were analyzed by UHPLC-ESI-Q-TOF-MS/MS systems, which consisted of a Shimadzu Nexera UHPLC LC-30A system coupled to a hybrid quadrupole time-of-flight tandem mass spectrometer equipped with Turbo V sources and a Turbo ion spray interface (AB Triple-TOF 5600+, AB SCIEX, Foster City, CA) to obtain the accurate mass and structure information of xenobiotic prototype components and metabolites of ZZCD in vivo. The linear elution gradient of the mobile phase consisting of A (acetonitrile) and B (CH3COOH![[thin space (1/6-em)]](https://www.rsc.org/images/entities/char_2009.gif) :
:![[thin space (1/6-em)]](https://www.rsc.org/images/entities/char_2009.gif) H2O = 0.1
H2O = 0.1![[thin space (1/6-em)]](https://www.rsc.org/images/entities/char_2009.gif) :
:![[thin space (1/6-em)]](https://www.rsc.org/images/entities/char_2009.gif) 100, v/v) was as follows: 0–10 min, 0–50% A; 10–13 min, 50–95% A; 13–15 min, 95–95% A; 15–16 min, 95–0% A; and 16–18 min, 0–0% A, at a constant flow rate of 0.3 mL min−1. A Waters HSS T3 column (150 × 3 mm, 1.8 μm) was used to separate the analytes at the column temperature of 35 °C. The liquid chromatography effluent was split and then introduced into the inlet of the MS. Each mass detector was equipped with an electrospray ionization (ESI) source and operated in both positive and negative ionization modes.
100, v/v) was as follows: 0–10 min, 0–50% A; 10–13 min, 50–95% A; 13–15 min, 95–95% A; 15–16 min, 95–0% A; and 16–18 min, 0–0% A, at a constant flow rate of 0.3 mL min−1. A Waters HSS T3 column (150 × 3 mm, 1.8 μm) was used to separate the analytes at the column temperature of 35 °C. The liquid chromatography effluent was split and then introduced into the inlet of the MS. Each mass detector was equipped with an electrospray ionization (ESI) source and operated in both positive and negative ionization modes.
The conditions of UHPLC-ESI-Q-TOF-MS/MS were optimized and set as follows: capillary voltage: 5000 V (+)/4500 V (−); mass range of Q-MS and TOF MS/MS scanning (m/z): 100–1500 and 50–1000; scan mode: IDA criteria; capillary temperature: 500 °C; declustering potential (DP): 60 V; collision energy (CE): 35 V. The collision energy spread (CES) was set at 15 eV, enabling us to obtain average EPI scan spectra when the CE was 20, 35 and 50 eV. A real-time multiple mass defect filter (MMDF) and dynamic background subtraction (DBS) were used to fulfill the IDA criteria. Data were acquired by the Analyst® TF 1.6 software (AB SCIEX, Foster City, CA). For calibrating the mass detector, the calibrant delivery system (CDS), under which the correction solution was injected by an independent secondary probe, was used to automatically adjust the ion mass in real time during the procedure of sample analysis. The correction solution was a polypropylene glycol (PPG) solution (2.0 × 10⁻⁷ M for positive ion mode and 3.0 × 10⁻⁵ M for negative ion mode). The m/z values 175.1330 and 906.6730 were chosen as PPG preventative maintenance values for positive ion mode, while m/z values 59.0130 and 933.64 were chosen for negative mode. The mass error and mass deviation were less than 2 ppm and ±0.1 Da, respectively.
Strategies for screening and identification of ZZCD in rat feces
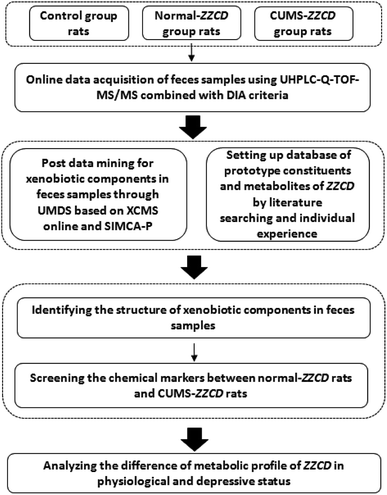
In order to figure out the metabolic profile of ZZCD in rat feces, an identification strategy combined with on-line data acquisition and off-line data analysis techniques was used in this study. It could be divided into three steps (Fig. 2).In step one, the IDA criterion was chosen as the mass spectrometer on-line analysis strategy. Then, the MS spectra and MS/MS spectra of the samples were acquired in the condition of low and high collision energy accordingly in both positive and negative ionization modes. The structural information of chemical ingredients in the samples, including parent ions, fragment ions and neutral loss, were obtained globally.
In step two, post data mining for exogenous components in the samples was carried out through an untargeted metabolomics-driven strategy. In brief, data extraction and data analysis were performed in this step. The XCMS online platform, a preprocessing tool of LC-MS chromatograms, was used for data extraction.35,40 It can automatically align the retention time and pick peaks of multiple compounds. As a result, three-dimensional (3D) datasets including peak codes, m/z–retention time (tR) pairs and ion intensity for both blank group and drug-containing group were acquired. For data analysis, the resulting 3D datasets were introduced to the SIMCA-P software (13.0.3 version, Umetrics, Umea, Sweden). Then, PCA and OPLS-DA were executed; the ions with VIP values greater than 1.0 in the score plots and S-plots were regarded as xenobiotics in the fecal samples. At the same time, a database of ZZCD was established in an Excel electronic form through literature search and previous research, in which the information including component names, accurate m/z of quasi-molecular ions, MS/MS fragmentation, formulae, molecular weight and relative polarity between the isomeride of prototype compounds and metabolites were listed clearly.
In step three, the xenobiotics identified above were matched based on the database hits through comparing their MS information with the database by sPIF and DIFS.34,35 Then, the chemical compositions were identified by sPIF through matching the database of ZZCD. When two or more fragment ions were matched, the chemical compounds in the database were chosen as the candidate components quickly. For the identification of the candidate components, DFIS was used to compare the characteristic ions related to the nucleus structure, possible metabolic and fragment pathways between candidates, and chemical compositions. With the view of further verification of the result, the chemical composition information was characterized by XIC in original MS spectra.
Chemical markers screening and analysis
In this step, the 3D datasets including peak codes, m/z–tR pairs and ion intensity of exogenous compounds present in normal + ZZCD feces and CUMS + ZZCD feces were imported into the SIMCA-P software for multivariate data analysis. Then, the chemical compounds that most significantly contributed to the discrimination (VIP > 1.0 and p < 0.05) of the normal + ZZCD and CUMS + ZZCD groups were screened out as the chemical markers, which may be closely related with the anti-depression material basis of ZZCD.Results and discussion
Depression-like behaviours and biochemical analysis
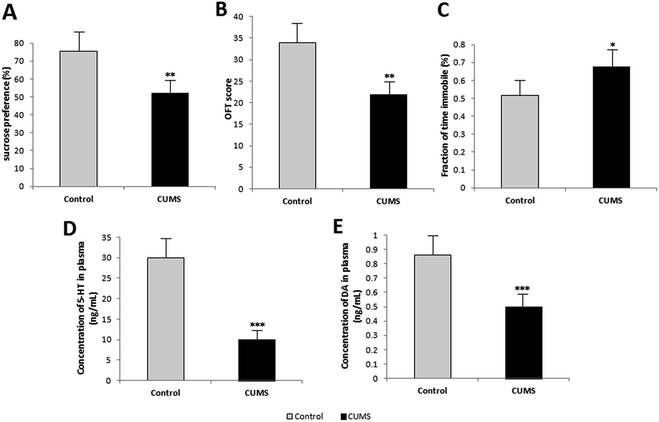
The results of behavioural tests in week 4 are listed in Fig. 3. Rats in the CUMS group showed low sucrose preference in SPT (Fig. 3(A)), low score in OFT (Fig. 3(B)), and more time in immobility in FST (Fig. 3(C)). This indicated that these rats exhibited significant depression-like behaviours. Further, the plasma levels of 5-HT and DA were measured as the indices of depression, which can be seen in Fig. 3(D) and (E). The plasma levels of 5-HT and DA of CUMS-induced depression rats were lower than those of normal rats. As a result, the depression model was attested to be successful by behaviour tests and biochemical analysis.Optimization of sample collection and preparation methods
In consideration of the excretion kinetics of multiple constituents and their metabolites of ZZCD, the collection time was set as 0 h–24 h by preliminary experiments, during which majority of the components were totally excreted in the feces. Due to the different polarity and the different metabolic pathways of the chemical components, the metabolic profile of ZZCD in rat feces is complex. Therefore, the preparation method that can retain the most xenobiotics should be chosen. In this study, the solvents used for both the preparation assisted by ultrasonic treatment and reconstitution were compared for fecal samples, including 20% methanol–water, 50% methanol–water, 80% methanol–water and pure methanol. As a result, 50% methanol–water was chosen as the solvent in both preparation and reconstitution because the signal strength of majority of the compounds was the highest, which indicates that it has better extractability for the constituents having different partition coefficients.Optimization of LC and MS conditions
Mobile phase compositions, which were closely linked to the peak shape and separation of the constituents in biological samples and ZZCD samples, were screened in this study. For aqueous phases, acetic acid and formic acid of different concentrations in water were compared, while methyl alcohol and acetonitrile were compared for the choice of the organic phase. As a result, acetonitrile and 0.1% acetic acid in water were selected as the mobile phases based on gradient elution.The parameters of Q-TOF-MS/MS spectra, which were related to the resolution, greater baseline stability and higher ionization efficiency, including capillary voltage, mass range of m/z, scan mode, capillary temperature, declustering potential (DP), collision energy (CE), and collision energy spread (CES), were optimized. For fulfilling IDA criteria, real-time MMDF and DBS were used. The typical total ion chromatograms (TICs) of control rat feces, normal + ZZCD rat feces and CUMS + ZZCD rat feces in both positive and negative ion modes are listed in Fig. S1 and S2.† The TICs of standard compounds and ZZCD samples are listed in Fig. S3.†
Metabolic profile identification of ZZCD in rat feces
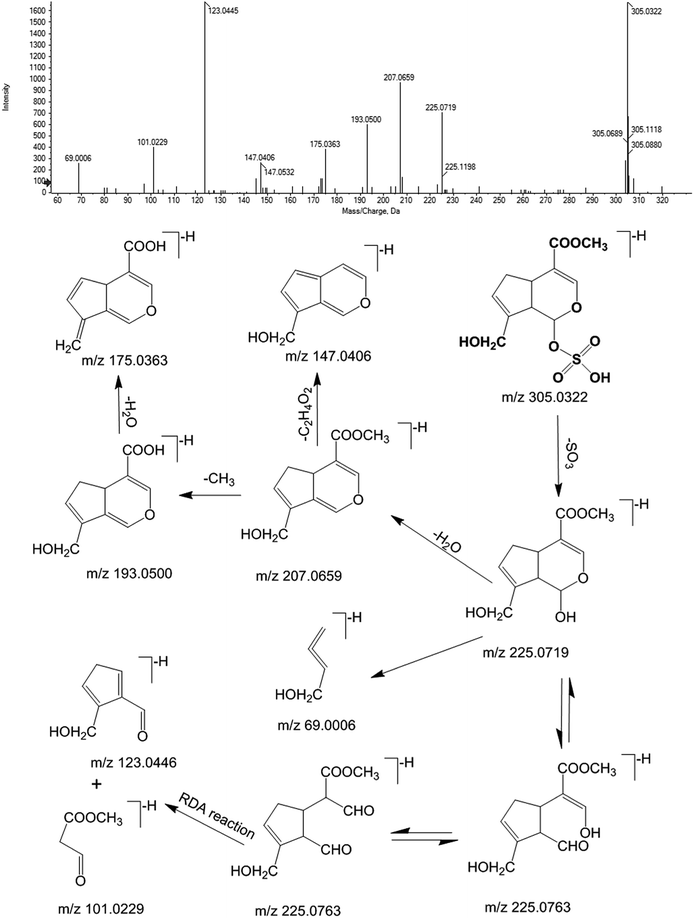
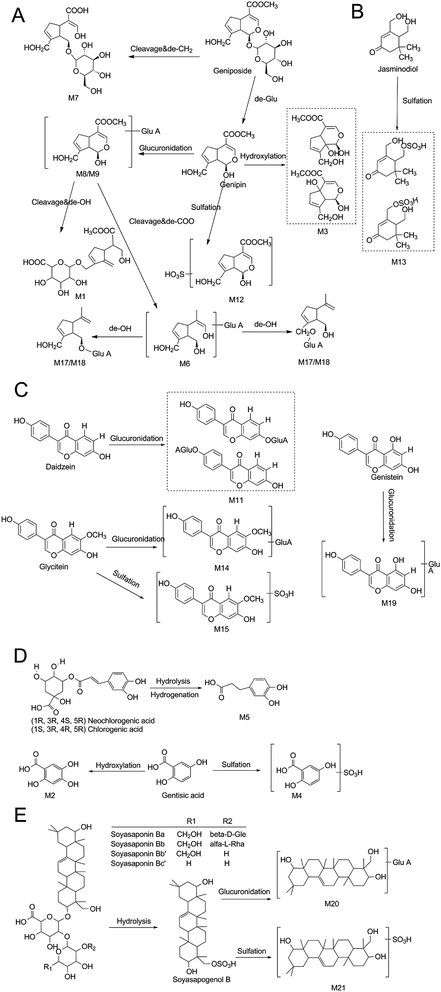
Furthermore, M12 was chosen as an example for expounding the process of the detailed identification by an integrated identification strategy. The m/z–tR pairs of fecal samples in the negative ion mode, including M305-T8.15, M225-T8.15, M207-T8.15, M193-T8.15, M175-T8.15, M123-T8.15, and M101-T8.15, were screened as xenobiotics from ZZCD based in their performance in the OPLS-DA S-plot and VIP values (VIP > 1.0 and p < 0.05). Then, they were pooled as a fragment ion group due to the same retention time, which could be regarded as fragment ions coming from one chemical component. The strategy of sPIF was used to screen the possible candidate components by comparing the fragment ion group with the database of ZZCD, which was established through literature search and previous research.2,5,34,35,43–47 Genipin-related prototype compounds or metabolites were chosen as the candidate components of M12 due to two or more fragment ions congruously, including m/z 207, 193 and 175. In order to further confirm the structure of M12, an extracted ion chromatogram (XIC) was obtained to find out the retention time and structure information of M12, while DIFS was used to identify the possible metabolic and fragment pathway by characteristic ions. As can be seen from Fig. 5, m/z 305 and m/z 225 were chosen as diagnostic fragment ions, and M12 was defined as the sulfate conjugate due to the neutral loss fragment (NLF) of 80 Da (−SO3). The calculated molecular formula of M12, for which the quasi-molecular ions in negative ESI mode of Q-TOF-MS/MS was 305.0322 [M − H]− (ppm = −4.6), was speculated to be C11H14O8S based on the analysis of elemental composition and fractional isotope abundance. The m/z 225, which could be found in Fig. 5, was the characteristic ion of genipin [M − H]−. By losing H2O, CH and CO continuously, genipin could give the series of product ions of m/z 207, 193 and 175, which accord with the information of the fragment ion group. Additionally, m/z 123 and 101 are from the Retro Diels–Alder (RDA) reaction of the iridoid skeleton. By comparing the information with the reports in related literature,2,13 M12 was tentatively identified as genipin-O-sulfate, and the molecular weight of all the fragment ions followed the nitrogen rule of mass spectrometry.35 The proposed metabolite pathway of iridoid glycosides-related metabolites in rat feces after oral administration of ZZCD is shown in Fig. 7(A).
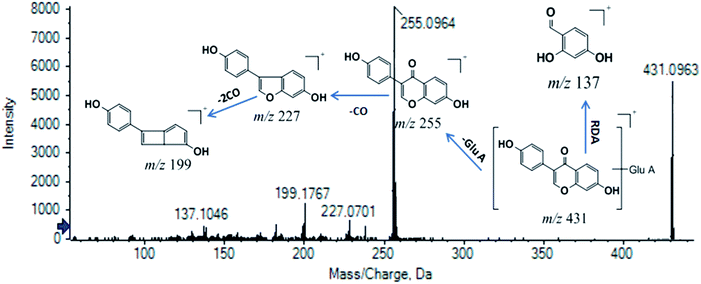
M11 was chosen as another example for expounding the process of identification. M11 (tR = 8.005 min, m/z (+) 431.0963) was screened as the xenobiotic from ZZCD in feces based on its performance in the OPLS-DA S-plot (VIP > 1.0 and p < 0.05). The calculated molecular formula was speculated to be C21H18O10 based on the analysis of its elemental composition and fractional isotope abundance (ppm = −2.3). The fragment ions, including that of m/z 431, were chosen as the product ions of m/z 431.0963 based on the same tR, which were verified by XIC in the original MS spectra. The NLF of 176 Da (C6H8O6) indicated that M11 was a glucuronide conjugate. Then, m/z 255 and m/z 199 were chosen as the diagnostic ions of M11 due to the higher relative abundance. As a result, daidzein-O-glucuronide was found to conform to the fragment pathway.48 The fragment ions with m/z 255, m/z 227, m/z 199 and m/z 137 were identified as [M–GluA + H]+, [M–GluA–CO + H]+, [M + H–2CO]+ and [M + H–C8H6O]+, respectively. The XIC of M11 in the positive ion mode and proposed fragmentation pathway are illustrated in Fig. 6. The proposed metabolic profiles of flavonoid-related metabolites are shown in Fig. 7(C).
As a result, 36 prototype constituents and 21 metabolites of ZZCD were identified or tentatively confirmed by the integrated data-mining strategy, and two xenobiotic components were unidentified. M10 (m/z–tR 367.1150–7.727) was speculated as a sulfate conjugate due to the loss of a neutral fragment of 80 Da (–SO3), while the possible structure was still unclear. In the same way, M16 (m/z–tR 465.1896–9.104) was speculated as a sulphate and glucuronide conjugate. The MS/MS spectra of M10 and M16 are illustrated in Fig. S5.†
| Type | Amount of detected constituents | |
|---|---|---|
| Prototype compounds | In total | 35 |
| Iridoid glycosides | 9 | |
| Monoterpenoids | 8 | |
| Flavonoids | 7 | |
| Soyasaponins | 6 | |
| Quinic acid derivatives | 4 | |
| Organic acids | 1 | |
| Metabolites | In total | 21 |
| Hydroxylation | 2 | |
| Dihydroxylation | 1 | |
| Ring-opened and de-hydroxy of mono-glucuronidation | 2 | |
| Loss of CH2 and cleavage | 1 | |
| Ring-opened and methyl formate removal derivative of mono-glucuronidation | 1 | |
| Mono-sulfate conjugation | 5 | |
| Mono-glucuronide conjugation | 4 | |
| Sulfate and glucuronide conjugation | 1 | |
| Hydrolysis and glucuronidation | 1 | |
| Hydrolysis and sulfation | 1 | |
| In total | 56 |
Iridoid glycosides, soyasaponins and isoflavones were the main constituents of ZZ and DDC, respectively. In this study, nine iridoid glycosides-related metabolites, such as M3, M6, and M7, were identified, while the main exitence form of soyasaponins and isoflavones in rat feces was prototype. Since studies have shown that geniposide or genipin, which is the main metabolite of geniposide, have hepatotoxicity in vivo,49 the results of this study may suggest that ZZCD reduced the toxicity and enhanced the efficacy after oral administration. A previous research claimed that DDC has different degrees of regulatory effects on gut microbes,50 and changes in intestinal flora can affect the development of depression.21,22 It can be speculated that gut microbes may be one of the antidepressant targets of ZZCD.
Chemical markers screening and identification
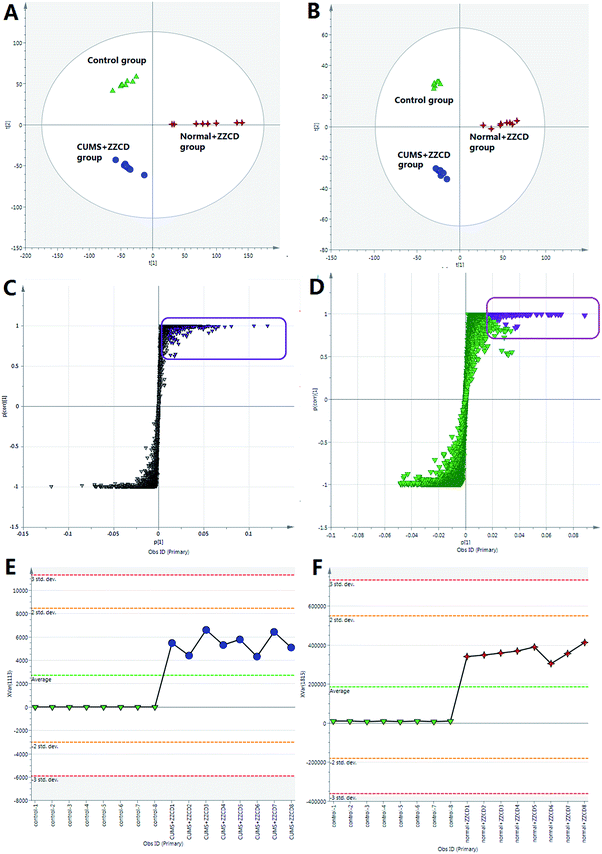
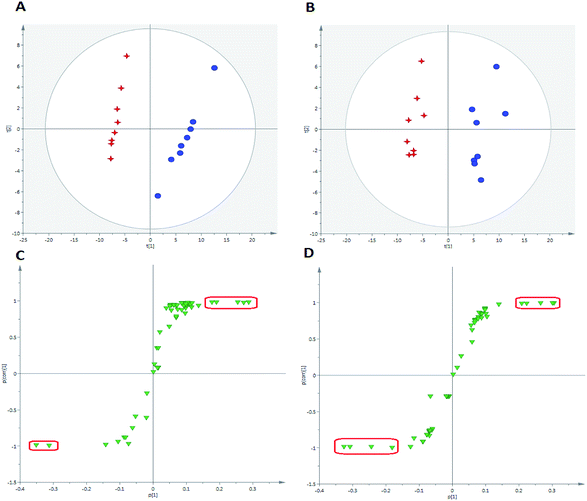
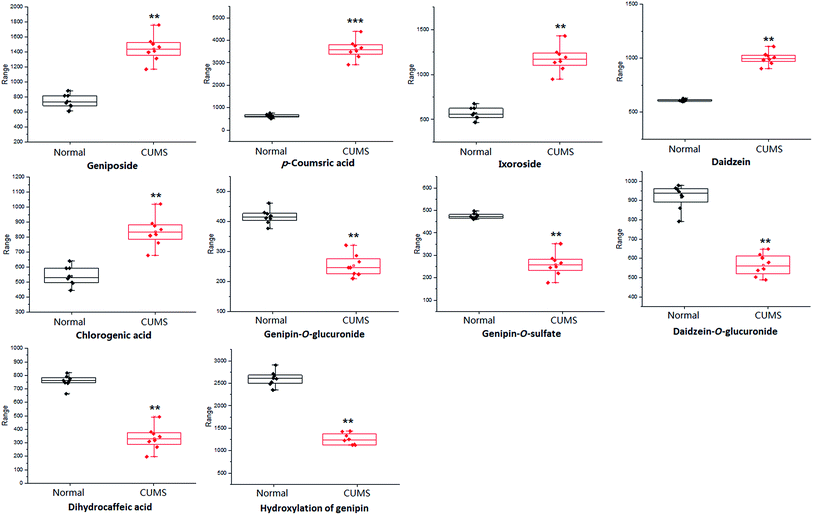
For the purpose of studying the chemical composition difference between the normal and CUMS-induced depression rats, the 3D datasets (peak code, tR–m/z pairs, and ion intensity) of the 56 exogenous compounds were imported into the SIMCA-P software for multivariate data analysis, the results of which can better elucidate the material basis of ZZCD in antidepression. It can be seen in Fig. 8(A) and (B) that the two groups are clearly divided into two areas, which indicates that there are differences in the distributions of these 56 xenobiotics in the feces of normal and CUMS-induced rats. For the further study of screening the chemical markers, which may be the potential bioactive components of ZZCD in vivo, the S-plots were acquired in both positive-ion mode (Fig. 8(C)) and negative-ion mode (Fig. 8(D)). In addition, 10 chemical components with VIP > 1.0 were screened out as the potential chemical markers. Among these, the content of geniposide, p-coumaric acid, ixoroside, daidzein, chlorogenic acid in feces of CUMS-induced rats was higher than that in normal rats, while the content of genipin-O-glucuronide, genipin-O-sulfate, daidzein-O-glucuronide, dihydrocaffeic acid and hydroxylation of genipin were lower in the depression model rats (Fig. 9).Conclusion
The metabolic profile of ZZCD in rat feces could provide the basis for studying the effective components of antidepressants due to the correlation between intestinal flora and depression. For identifying the cause of signality and complicacy, an effective and systematic identification strategy is needed urgently. In this study, multiple strategies based on UHPLC-ESI-Q-TOF-MS/MS and data mining softwares were used to screen and identify the prototype components and metabolites of ZZCD in rat feces after oral administration. According to the results, 36 prototype components and 21 metabolites were identified or temporarily confirmed. It can be seen that the strategies mentioned in this study were easy to automate, for which the time for screening and identifying is distinctly shorter. The results indicated that mono-sulfate conjugation and mono-glucuronide conjugation were the main metabolic pathways of ZZCD in rat feces. For iridoid glycosides, hydrolysis, ring-opening, hydroxylation and loss of CH2 metabolic pathways were observed. For organic acids, the hydrolysis metabolic pathway was identified. Even for soyasaponins, the hydrolysis metabolic pathway was identified. The study of the metabolic profile of ZZCD in rat plasma revealed that glucuronidation was the main metabolic pathway,5 compared with which the metabolic pathways of ZZCD in feces were more complex. Furthermore, there were differences in the metabolic pathways of geniposide and glycitein among rat bile, urine and feces.2 For bile and urine, homocysteine conjugation, methylation, N-acetylcysteine, ketone formation and N-heterocyclization conjugation pathways were identified. For feces, the loss of OH and CO2 pathways was determined. The formation of the specific metabolites of ZZCD in rat feces may be due to the gut microbiota.35There were no differences in fecal metabolite types between the normal and CUMS-induced depression rats. However, the concentration of some constituents was significantly different. Further, a total of 10 chemical markers, which significantly contributed to the discrimination of the metabolic profile of ZZCD in rat feces, were screened as the potential bioactive components of ZZCD by statistical analysis between the normal + ZZCD group and CUMS + ZZCD group. The discrepancy in these metabolites on concentration may relate to the distinct perturbation of the composition of gut microbiota in induced depression rats, such as Bacteroides, Clostridium, Coprococcus, Pseudobutyrivibrio and Dorea genus, which could change the alteration of gastrointestinal motility.21,51 Furthermore, previous studies have claimed that some chemical components of ZZCD, such as daidzein, genistein, chlorogenic acid, p-coumaric acid, geniposide, caffeic acid, daidzin, and dihydrodaidzein, could modulate the gut microbiota composition,7,10,24,50,52 while the change in the composition of gut microbiota can influence the functioning of the hypothalamic-pituitary-adrenal (HPA) and immune system and thus, it may play a crucial role in depression through the brain-gut axis.21,22,51 The ZZCD-related chemical components, whose concentration changed significantly in feces of normal and depression rats, including excreted components and the residual components from the initial ingested decoction, may be responsible for the antidepressant effects of ZZCD in vivo.
In conclusion, this study could be helpful for the research of anti-depression material basis and mechanism of ZZCD, and the strategy proposed in this study would be a practical and systematic solution for screening and identifying untargeted compounds (including prototype constituents and metabolites) and bioactive components of TCMP in vivo.
Ethical statement
This study was performed in strict accordance with the NIH guidelines for the care and use of laboratory animals (NIH Publication No. 85–23 Rev. 1985) and was approved by the Institutional Animal Care and Use Committee of Bengbu Medical University (Bengbu, China).Conflicts of interest
There are no conflicts to declare.Acknowledgements
This study was supported by the Natural Science Foundation of Anhui Province (1908085QH376), National innovation plan for college students of China (201810367013), and the Key Project of the Natural Science Foundation of Bengbu Medical University (BYKF1725).References
- M. Wu, Q. Yang and Z. Chen, Discussion on formula significance and clinical application of Zhizichi Decoction, Shanghai J. Tradit. Chin. Med., 2018, 52, 30–31 Search PubMed.
- Q. Dong, M. Liu and S. Li, et al., Screening and identification of multiple constituents and their metabolites of Zhi-zi-chi decoction in rat urine and bile by ultra-high-performance liquid chromatography quadrupole time-of-flight mass spectrometry, Biomed. Chromatogr., 2017, 31 DOI:10.1002/bmc.3978.
- Y. Zhao, H. Li and F. Fang, et al., Geniposide improves repeated restraint stress-induced depression-like behavior in mice by ameliorating neuronal apoptosis via regulating GLP-1R/AKT signaling pathway, Neurosci. Lett., 2018, 676, 19–26 CrossRef CAS PubMed.
- B. Bose, D. Tripathy and A. Chatterjee, et al., Secondary metabolite profiling, cytotoxicity, anti-inflammatory potential and in vitro inhibitory activities of Nardostachys jatamansi on key enzymes linked to hyperglycemia, hypertension and cognitive disorders, Phytomedicine, 2019, 55, 58–69 CrossRef CAS PubMed.
- Z. Long, J. Dai and K. Bi, et al., Identification of multiple constituents in the traditional Chinese medicine formula Zhi-zi-chi decoction and rat plasma after oral administration by liquid chromatography coupled to quadrupole time-of-flight tandem mass spectrometry, Rapid Commun. Mass Spectrom., 2012, 26, 2443–2453 CrossRef PubMed.
- R. R. Scheline, Metabolism of foreign compounds by gastrointestinal microorganisms, Pharmacol. Rev., 1973, 25, 451–523 CAS.
- W. Feng, H. Ao and C. Peng, et al., Gut microbiota, a new frontier to understand traditional Chinese medicines, Pharmacol. Res., 2019, 142, 176–191 CrossRef CAS PubMed.
- M. P. Gonthier, C. Remesy and A. Scalbert, et al., Microbial metabolism of caffeic acid and its esters chlorogenic and caftaric acids by human faecal microbiota in vitro, Biomed. Pharmacother., 2006, 60, 536–540 CrossRef CAS PubMed.
- F. Tomas-Barberan, R. Garcia-Villalba and A. Quartieri, et al., In vitro transformation of chlorogenic acid by human gut microbiota, Mol. Nutr. Food Res., 2014, 58, 1122–1131 CrossRef CAS PubMed.
- T. Ozdal, D. A. Sela and J. Xiao, et al., The Reciprocal Interactions between Polyphenols and Gut Microbiota and Effects on Bioaccessibility, Nutrients, 2016, 8, 78 CrossRef PubMed.
- L. Lin, H. Lin and M. Zhang, et al., Types, principle, and characteristics of tandem high-resolution mass spectrometry and its applications, RSC Adv., 2015, 5, 107623–107636 RSC.
- H. I. Swanson, Drug Metabolism by the Host and Gut Microbiota: A Partnership or Rivalry?, Drug Metab. Dispos., 2015, 43, 1499–1504 CrossRef CAS PubMed.
- L. Q. Wang, M. R. Meselhy and Y. Li, et al., The heterocyclic ring fission and dehydroxylation of catechins and related compounds by Eubacterium sp. strain SDG-2, a human intestinal bacterium, Chem. Pharm. Bull., 2001, 49, 1640–1643 CrossRef CAS PubMed.
- M. Kim, S. I. Kim and J. Han, et al., Stereospecific biotransformation of dihydrodaidzein into (3S)-equol by the human intestinal bacterium Eggerthella strain Julong 732, Appl. Environ. Microbiol., 2009, 75, 3062–3068 CrossRef CAS PubMed.
- D. H. Kim, E. A. Jung and I. S. Sohng, et al., Intestinal bacterial metabolism of flavonoids and its relation to some biological activities, Arch. Pharmacal Res., 1998, 21, 17–23 CrossRef CAS PubMed.
- M. J. Kang, T. Khanal and H. G. Kim, et al., Role of metabolism by human intestinal microflora in geniposide-induced toxicity in HepG2 cells, Arch. Pharmacal Res., 2012, 35, 733–738 CrossRef CAS PubMed.
- T. S. Postler and S. Ghosh, Understanding the Holobiont: How Microbial Metabolites Affect Human Health and Shape the Immune System, Cell Metab., 2017, 26, 110–130 CrossRef CAS PubMed.
- I. D. Wilson and J. K. Nicholson, Gut microbiome interactions with drug metabolism, efficacy, and toxicity, Transl. Res., 2017, 179, 204–222 CrossRef CAS PubMed.
- X. Wang, A. Zhang and J. Miao, et al., Gut microbiota as important modulator of metabolism in health and disease, RSC Adv., 2018, 8, 42380–42389 RSC.
- L. Lin, L. Luo and M. Zhong, et al., Gut microbiota: a new angle for traditional herbal medicine research, RSC Adv., 2019, 9, 17457–17472 RSC.
- M. Valles-Colomer, G. Falony and Y. Darzi, et al., The neuroactive potential of the human gut microbiota in quality of life and depression, Nat. Microbiol., 2019, 4, 623–632 CrossRef CAS PubMed.
- L. Sun, L. Ma and H. Zhang, et al., Fto Deficiency Reduces Anxiety- and Depression-Like Behaviors in Mice via Alterations in Gut Microbiota, Theranostics, 2019, 9, 721–733 CrossRef CAS PubMed.
- S. Hu, A. Li and T. Huang, et al., Gut Microbiota Changes in Patients with Bipolar Depression, Adv. Sci., 2019, 6, 1900752 CrossRef PubMed.
- J. Song, N. Zhou and W. Ma, et al., Modulation of gut microbiota by chlorogenic acid pretreatment on rats with adrenocorticotropic hormone induced depression-like behavior, Food Funct., 2019, 10, 2947–2957 RSC.
- S. Pusalkar, M. Plesescu and N. Gupta, et al., Biotransformation of [(14)C]-ixazomib in patients with advanced solid tumors: characterization of metabolite profiles in plasma, urine, and feces, Cancer Chemother. Pharmacol., 2018, 82, 803–814 CrossRef CAS PubMed.
- W. W. Dong, X. Z. Han and J. Zhao, et al., Metabolite profiling of ginsenosides in rat plasma, urine and feces by LC-MS/MS and its application to a pharmacokinetic study after oral administration of Panax ginseng extract, Biomed. Chromatogr., 2018, 32 Search PubMed.
- J. J. Kirkland, Method for high-speed liquid chromatographic analysis of benomyl and-or metabolite residues in cow milk, urine, feces, and tissues, J. Agric. Food Chem., 1973, 21, 171–177 CrossRef CAS PubMed.
- D. S. Zhao, L. L. Jiang and L. L. Wang, et al., Integrated Metabolomics and Proteomics Approach To Identify Metabolic Abnormalities in Rats with Dioscorea bulbifera Rhizome-Induced Hepatotoxicity, Chem. Res. Toxicol., 2018, 31, 843–851 Search PubMed.
- Y. Chen, X. Feng and L. Li, et al., UHPLC-Q-TOF-MS/MS method based on four-step strategy for metabolites of hinokiflavone in vivo and in vitro, J. Pharm. Biomed. Anal., 2019, 169, 19–29 CrossRef CAS PubMed.
- P. S. Dhurjad, V. K. Marothu and R. Rathod, Post-acquisition data mining techniques for LC-MS/MS-acquired data in drug metabolite identification, Bioanalysis, 2017, 9, 1265–1278 CrossRef CAS PubMed.
- H. Gowda, J. Ivanisevic and C. H. Johnson, et al., Interactive XCMS Online: Simplifying Advanced Metabolomic Data Processing and Subsequent Statistical Analyses, Anal. Chem., 2014, 86, 6931–6939 CrossRef CAS PubMed.
- T. Huan, E. M. Forsberg and D. Rinehart, et al., Systems biology guided by XCMS Online metabolomics, Nat. Methods, 2017, 14, 461–462 CrossRef CAS PubMed.
- R. Tautenhahn, G. J. Patti and D. Rinehart, et al., XCMS Online: a web-based platform to process untargeted metabolomic data, Anal. Chem., 2012, 84, 5035–5039 CrossRef CAS PubMed.
- K. Luo and F. Feng, Identification of absorbed components and metabolites of Zhi-Zi-Hou-Po decoction in rat plasma after oral administration by an untargeted metabolomics-driven strategy based on LC-MS, Anal. Bioanal. Chem., 2016, 408, 5723–5735 CrossRef CAS PubMed.
- K. Luo, Q. Shi and F. Feng, Characterization of global metabolic profile of Zhi-Zi-Hou-Po decoction in rat bile, urine and feces after oral administration based on a strategy combining LC-MS and chemometrics, J. Chromatogr. B: Anal. Technol. Biomed. Life Sci., 2017, 1040, 260–272 CrossRef CAS PubMed.
- M. Juvonen, M. Kotiranta and J. Jokela, et al., Identification and structural analysis of cereal arabinoxylan-derived oligosaccharides by negative ionization HILIC-MS/MS, Food Chem., 2019, 275, 176–185 CrossRef CAS PubMed.
- M. Wang, Q. Hu and Q. Shi, et al., Metabolic profile elucidation of Zhi-Zi-Da-Huang decoction in rat intestinal bacteria using high-resolution mass spectrometry combined with multiple analytical perspectives, Xenobiotica, 2019, 49(1), 1–12 CrossRef CAS PubMed.
- R. Vitale, F. Marini and C. Ruckebusch, SIMCA Modeling for Overlapping Classes: Fixed or Optimized Decision Threshold?, Anal. Chem., 2018, 90, 10738–10747 CrossRef CAS PubMed.
- Z. Jiang, C. Peng and W. Huang, et al., A High Throughput Three-step Ultra-performance Liquid Chromatography Tandem Mass Spectrometry Method to Study Metabolites of Atractylenolide-III, J. Chromatogr. Sci., 2019, 57, 163–176 CAS.
- S. K. Manier, A. Keller and M. R. Meyer, Automated optimization of XCMS parameters for improved peak picking of liquid chromatography-mass spectrometry data using the coefficient of variation and parameter sweeping for untargeted metabolomics, Drug Test. Anal., 2019, 11, 752–761 CrossRef CAS PubMed.
- E. M. Forsberg, T. Huan and D. Rinehart, et al., Data processing, multi-omic pathway mapping, and metabolite activity analysis using XCMS Online, Nat. Protoc., 2018, 13, 633–651 CrossRef CAS PubMed.
- C. W. Hsu, Y. T. Chen and Y. J. Hsieh, et al., Integrated analyses utilizing metabolomics and transcriptomics reveal perturbation of the polyamine pathway in oral cavity squamous cell carcinoma, Anal. Chim. Acta, 2019, 1050, 113–122 CrossRef CAS PubMed.
- H. Han, L. Yang and Y. Xu, et al., Identification of metabolites of geniposide in rat urine using ultra-performance liquid chromatography combined with electrospray ionization quadrupole time-of-flight tandem mass spectrometry, Rapid Commun. Mass Spectrom., 2011, 25, 3339–3350 CrossRef CAS PubMed.
- Y. Ding, J. W. Hou and Y. Zhang, et al., Metabolism of Genipin in Rat and Identification of Metabolites by Using Ultraperformance Liquid Chromatography/Quadrupole Time-of-Flight Tandem Mass Spectrometry, J. Evidence-Based Complementary Altern. Med., 2013, 2013, 957030 Search PubMed.
- J. Chen, H. Wu and M. Dai, et al., Identification and distribution of four metabolites of geniposide in rats with adjuvant arthritis, Fitoterapia, 2014, 97, 111–121 CrossRef CAS PubMed.
- C. Carrasco-Pozo, M. Gotteland and R. L. Castillo, et al., 3,4-Dihydroxyphenylacetic acid, a microbiota-derived metabolite of quercetin, protects against pancreatic beta-cells dysfunction induced by high cholesterol, Exp. Cell Res., 2015, 334, 270–282 CrossRef CAS PubMed.
- R. Zhang, X. Zhao and X. Meng, et al., Determination and pharmacokinetics of geniposidic acid in rat plasma after oral administration of Gardenia jasminoides fruit crude extract and Zhi-zi-chi decoction, %A Long Z, Biomed Chromatogr, 2013, 27, 812–816 CrossRef PubMed.
- W. Zhao, Z. Shang and Q. Li, et al., Rapid Screening and Identification of Daidzein Metabolites in Rats Based on UHPLC-LTQ-Orbitrap Mass Spectrometry Coupled with Data-Mining Technologies, Molecules, 2018, 23(1), 151 CrossRef PubMed.
- L. Wei, H. Zhang and H. Li, Comparative study on hepatotoxicity of geniposide, genipin and gardenia blue in vivo and in vitro, Chin. Arch. Tradit. Chin. Med., 2019, 37, 311–314 Search PubMed.
- L. Chen, X. Guan and L. Zhang, et al., Regulatory effect of Sojae Semen Praeparatum on 6 common gut microbes, Chin. J. Microecol., 2017, 29, 1122–1126 Search PubMed.
- T. G. Dinan and J. F. Cryan, Melancholic microbes: a link between gut microbiota and depression?, Neurogastroenterol. Motil., 2013, 25, 713–719 CrossRef CAS PubMed.
- Y. Zhang, Y. Wang and D. Chen, et al., Dietary chlorogenic acid supplementation affects gut morphology, antioxidant capacity and intestinal selected bacterial populations in weaned piglets, Food Funct., 2018, 9, 4968–4978 RSC.
Footnotes |
| † Electronic supplementary information (ESI) available. See DOI: 10.1039/c9ra06486a |
| ‡ These authors contributed equally to this work. |
| This journal is © The Royal Society of Chemistry 2019 |

