
 Open Access Article
 This Open Access Article is licensed under a Creative Commons Attribution-Non Commercial 3.0 Unported Licence
New spirobisnaphthalenes from an endolichenic fungus strain CGMCC 3.15192 and their anticancer effects through the P53–P21 pathway†
Jingwen Li‡
a,
Rong Ding‡b,
Hao Gao a,
Liangdong Guoc,
Xinsheng Yaoa,
Youwei Zhang*d and
Jinshan Tang*a
a,
Liangdong Guoc,
Xinsheng Yaoa,
Youwei Zhang*d and
Jinshan Tang*a
aInstitute of Traditional Chinese Medicine and Natural Products, International Cooperative Laboratory of Traditional Chinese Medicine Modernization and Innovative Drug Development of Chinese Ministry of Education (MOE), College of Pharmacy, Jinan University, Guangzhou 510632, P. R. China. E-mail: gztangjinshan@126.com
bSchool of Pharmaceutical Science, Xiamen University, Xiamen 361005, P. R. China
cState Key Laboratory of Mycology, Institute of Microbiology, Chinese Academy of Science, Beijing 100101, P. R. China
dDepartment of Pharmacology, Case Comprehensive Cancer Center, Case Western Reserve University, School of Medicine, Cleveland, OH 44106, USA. E-mail: yxzl69@case.edu
First published on 28th November 2019
Abstract
Natural products from fungi have remained a rich resource for drug discovery. Here we report the isolation of three new spirobisnaphthalenes, namely sacrosomycin A-C (1–3), and three known analogues (4–6), from the ethyl acetate extract of a nonsporulating endolichenic fungus derived from Peltigera elisabethae var. mauritzii. The structures of these compounds were elucidated by IR, UV, MS, and NMR. Biological functions of these compounds were evaluated using cultured human cancer cell lines. Short-term cell growth and long-term cell survival assays show that compound 5 demonstrated the strongest cancer cell growth inhibition effect. We reveal that compound 5 induced both cell cycle arrest at the G2/M phase and cell death. Using western blotting, luciferase reporter assay and quantitative PCR (qPCR), we show that compound 5 induced up-regulation of the P53–P21 pathway, supporting the cell cycle arrest and growth inhibition effect of this compound. In contrast, these compounds did not induce cell death in a normal cell line. These results demonstrate a potential anticancer effect of this rare family of spirobisnaphthalene compounds isolated from endolichenic fungi.
Introduction
Spirobisnaphthalenes, also called bisnaphthospiroketals, belong to a relatively rare family of bioactive natural products that contain a 1,8-dihydroxynaphthalene derived spiroketal unit linked to a second, oxidized naphthalene moiety.1–3 Generally, spirobisnaphthalenes are divided into three subtypes, namely, spiroxin, preussomerin and deoxypreussomerin according to the linkage type of the two naphthalene rings, with the former joined together by two oxygen bridges and one carbon–carbon bridge and the later both joined together with three or two oxygen bridges, respectively.4 Recently, a small group of the fourth subtype of spirobisnaphthalenes was also discovered with only eight compounds reported up to now.5–7 Spirobisnaphthalenes have attracted much attention because of their unique structures and broad spectrum of biological activities including antibacterial, antifungal, herbicidal, cytotoxic and anti-tumor activities.3,7 The unique skeleton and broad spectrum of bioactivities of spirobisnaphthalenes demonstrate great promise for the discovery of new agents for the treatment of human diseases, especially cancer.P53 is a transcriptional factor that regulates the expression of a cascade of genes involved in cell cycle, apoptosis, autophagy, metabolism, pluripotency, and many other cellular processes.8 P53 induces apoptosis through inducing expression of the pro-apoptotic BCL-2 family proteins including PUMA, BAX, NOXA, etc.9–12 On the other hand, P53 induces upregulation of P21,13–16 contributing largely to the cell cycle arrest function of P53.17,18 Hence, P53 is a critical gene in suppressing tumorigenesis.19 Consistently, P53 mutation is detected in almost half of all human cancers.16 P21 is an endogenous inhibitor of the cyclin-dependent kinase, which inhibits cell cycle progression genes such as CDC25C, CDK1, CDK2, CCNE1, CCNB1, etc.,20,21 leading to cell cycle arrest in G1 or G2/M phase.16,22–24
As part of our ongoing efforts to search for new bioactive metabolites from rarely studied fungal species, we cultured a nonsporulating endolichenic fungus (CGMCC 3.15192) derived from Peltigera elisabethae var. mauritzii. From the ethyl acetate extract, we isolated three new spirobisnaphthalenes named sarcosomycin A–C (1–3) and three known analogues (4–6). Here we report the isolation, structural elucidation of sarcosomycin A–C (1–3) and biological assessment of these six compounds in the anticancer regimen. Our results show that compound 5 exhibited the strongest anticancer effect in cultured human cancer cell lines. We further reveal that this compound induced cell cycle arrest through up-regulating the P53–P21 pathway. These data demonstrate potential anticancer activity of spirobisnaphthalene compounds, laying foundation for detailed medicinal chemistry research for these compounds in the near future.
Results and discussion
Chemical identification of spirobisnaphthalenes
The fungus strain (CGMCC 3.15192) was cultured in solid state fermentation with rice at 25 °C for 47 days. The fermented material was extracted with ethyl acetate (EtOAc) and the extracts were subjected to silica gel and ODS column chromatography, which yielded five fractions (W1–W5). Preliminary screening revealed that fractions W2 (50% MeOH in H2O) and W3 (70% MeOH in H2O) showed different degrees of cytotoxic activities against five cancer cell lines (HL-60, SMMC-7721, A-549, MCF-7 and SW480). Hence, fractions W2 and W3 were further subjected to silica gel, ODS, Sephadex LH 20 column chromatography and RPHPLC to yield three new spirobisnaphthalenes, named sarcosomycin A–C (1–3), along with urnucratin C (4), Plecmillin A (5), and Plecmillin C (6) (Fig. 1).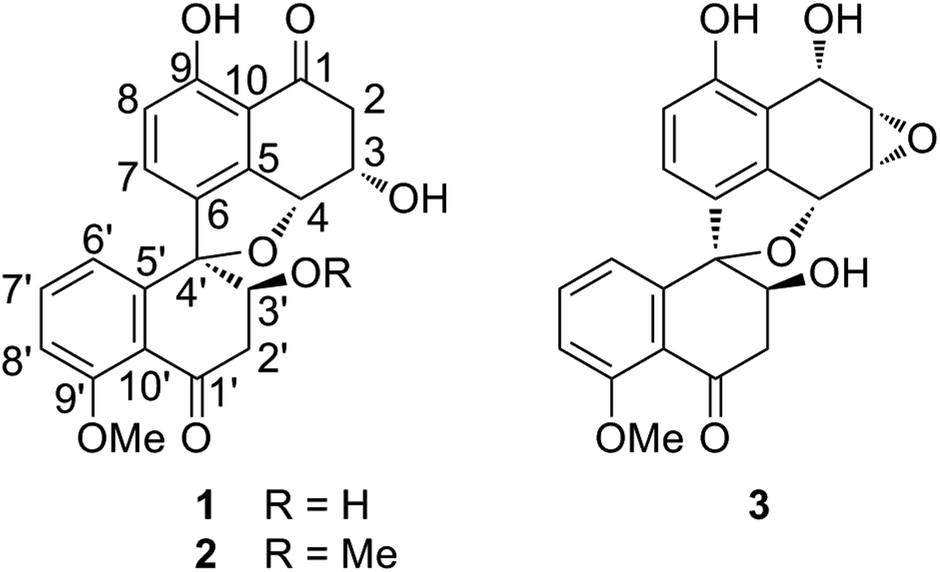 | ||
| Fig. 1 Chemical structures of compounds 1–3. | ||
Sarcosomycin A (1) was obtained as a yellow amorphous powder. The molecular formula was established as C21H18O7 by HRESIMS (m/z 383.1116 [M + H]+, calcd for C21H19O7: 383.1131), indicating 13° of unsaturation. The IR absorption implied the presence of hydroxyls, α,β-unsaturated ketone and aromatic ring at 3423, 1656 (broad single peak), 1594, 1474 cm−1. The 1H NMR spectrum showed the presence of a 1,2,3-trisubstituted aromatic protons at δH 6.80 (1H, d, 8.0 Hz), 7.16 (1H, d, 8.0 Hz), and 7.15 (1H, t, 8.0 Hz), a 1,2,3,4-tetrasubstituted aromatic protons at δH 6.94 (1H, d, 8.4 Hz) and 7.35 (1H, d, 8.0 Hz), and a methoxy proton at δH 3.89 (3H, s). The 13C NMR spectrum displayed two carbonyl groups at δC 197.7 and 201.0, twelve aromatic carbons from δC 114.2 to 161.8, four oxygenated carbons at δC 70.4, 71.0, 80.9, and 94.2, two methylene carbons at δC 44.3 and 45.8, and a methoxy carbon at δC 56.6. Comparison of the 1H and 13C NMR data of 1 with that of Plecmillin C indicated that they had similar spirobisnaphthalene skeleton (Table 1).5 The presence of one oxymethine carbon signal at δC 71.0 and one methylene carbon signal at δC 45.8 instead of a pair of olefinic carbon signals in the 13C NMR spectrum of 1 suggested that the olefinic bond of α, β-unsaturated ketone was reduced and hydroxylated in compound 1. Analyses of 1H–1H COSY, HSQC and HMBC correlations established the planar structure of 1 (Fig. 2).
| No | 1 δH (J in Hz) δC | 2 δH (J in Hz) δC | 3 δH (J in Hz) δC | |||
|---|---|---|---|---|---|---|
| 1 | 201.0 | 200.9 | 5.42 (br s) | 69.4 | ||
| 2 | 2.74 (br s) | 44.3 | 2.75 (br s) | 43.9 | 3.57 (dd, 4.7, 1.4) | 56.7 |
| 3 | 4.56 (br s) | 70.4 | 4.51 (br s) | 70.4 | 3.72 (dd, 4.7, 1.2) | 52.3 |
| 4 | 5.37 (br s) | 80.9 | 5.40 (br s) | 81.3 | 5.24 (br s) | 79.2 |
| 5 | 147.4 | 147.2 | 138.5 | |||
| 6 | 131.6 | 131.3 | 131.1 | |||
| 7 | 7.35 (d, 8.4) | 132.0 | 7.40 (d, 8.0) | 131.9 | 6.98 (d, 8.4) | 123.9 |
| 8 | 6.94 (d, 8.4) | 119.3 | 6.95 (d, 8.0) | 119.4 | 6.80 (d, 8.0) | 118.5 |
| 9 | 161.7 | 161.6 | 157.9 | |||
| 10 | 114.2 | 114.3 | 116.1 | |||
| 1′ | 197.7 | 197.0 | 197.9 | |||
| 2′ | 3.08 (dd, 16.4, 10.8); 2.91 (dd, 16.4, 5.6) | 45.8 | 3.06 (m) | 42.3 | 2.94–3.07 (m) | 45.1 |
| 3′ | 4.37 (m) | 71.0 | 4.15 (m) | 80.5 | 4.34 (dd, 9.4, 5.9) | 70.9 |
| 4′ | 94.2 | 93.6 | 93.1 | |||
| 5′ | 145.7 | 145.5 | 146.6 | |||
| 6′ | 6.80 (d, 8.0) | 121.1 | 6.82 (d, 8.0) | 121.0 | 6.69 (dd, 7.8, 0.8) | 120.6 |
| 7′ | 7.51 (t, 8.0) | 136.6 | 7.52 (t, 8.0) | 136.7 | 7.45 (t, 8.0) | 136.2 |
| 8′ | 7.16 (d, 8.0) | 114.3 | 7.18 (d, 8.0) | 114.4 | 7.12 (d, 8.0) | 113.9 |
| 9′ | 161.7 | 161.6 | 161.6 | |||
| 10′ | 122.1 | 122.0 | 121.9 | |||
| 3′-OMe | 3.15 (s) | 58.4 | ||||
| 9′-OMe | 3.89 (s) | 56.6 | 3.89 (s) | 56.6 | 3.88 (s) | 56.5 |
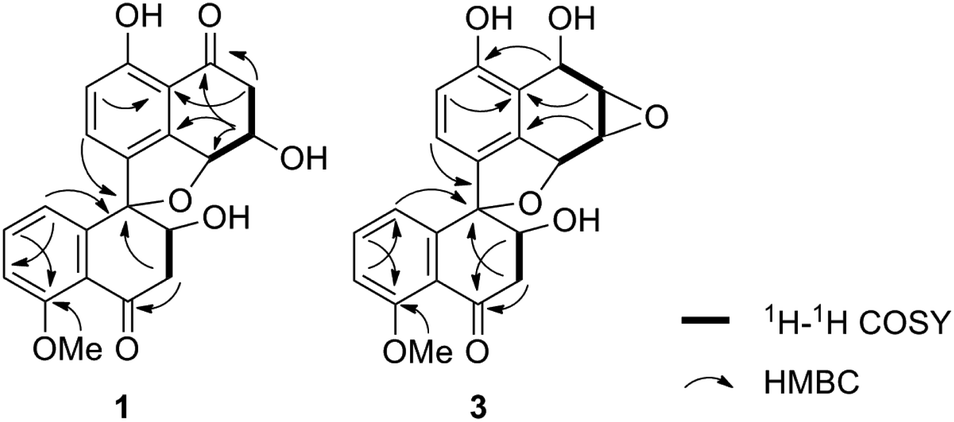 | ||
| Fig. 2 Key 1H–1H COSY and HMBC correlations of compounds 1 and 3. | ||
The relative configuration of 1 was determined by 1D selective NOE experiments, in which irradiation of H-4 (δH 5.37, 1H, br s) enhanced H-6′ (δH 6.80, 1H, d, 8.0 Hz), while irradiation of H-3′ (δH 4.37, 1H, m) enhanced H-7 (δH 7.35, 1H, d, 8.4 Hz) (Fig. 3). Thus, the relative configurations of 1 were identified to be 3S*, 4R*, 3′S*, 4′R*. The CD cotton effects of 1 were consistent with that of urnucratin A, indicating the absolute configuration of 1 as 3S, 4R, 3′S, 4′R (Fig. S9†).6
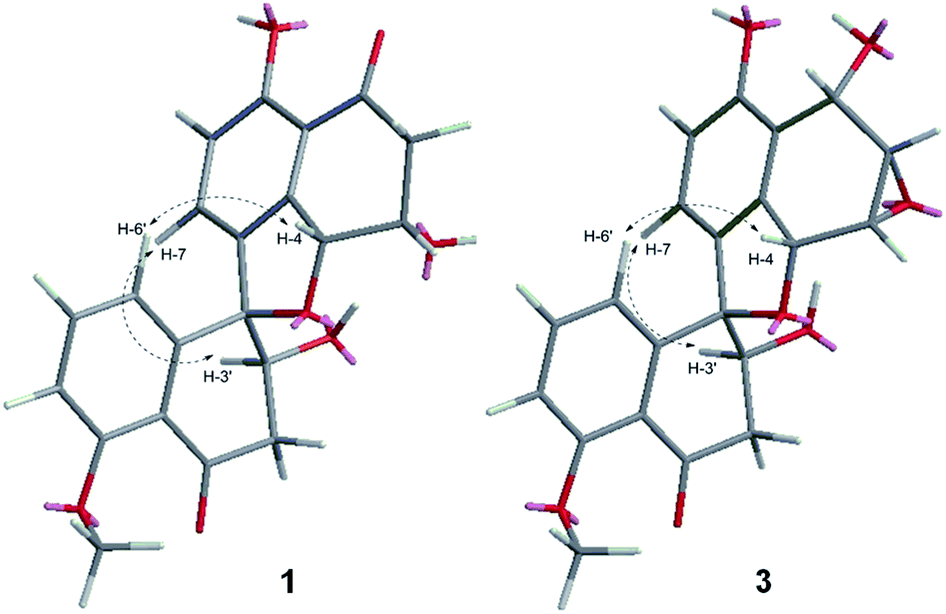 | ||
| Fig. 3 Key 1D selective NOE correlations of compounds 1 and 3. | ||
Sarcosomycin B (2) was obtained as a yellow amorphous powder. The molecular formula of C22H20O7 was determined by HRESIMS (m/z 397.1288 [M + H]+, calcd for C22H21O7: 397.1287), indicating 13° of unsaturation. The IR absorption implied the presence of hydroxyls, α, β-unsaturated ketone and aromatic ring at 3432, 1674, 1656, 1593, and 1471 cm−1. Comparison of the NMR data with that of compound 1 suggested that 2 also had a spirobisnaphthalene skeleton. The difference between them mainly lay in the 13C resonance at C-2′, C-3′, and C-4′ and an additional methoxy group at δC 58.4/δH 3.15 (3H, s) in 2. The HMBC correlation between δH 3.15 (3H, s) and δC 80.5 (C-3′) located the methoxy group at C-3′. Detailed analyses of 1H–1H COSY, HSQC and HMBC spectra accomplished the planar structure of 2. The relative configuration of 2 was determined by ROESY experiment and comparison of its NMR data with that of 1. In the ROESY spectrum, H-3′ at δH 4.15 (1H, m) correlated with H-7 at δH 7.40 (1H, d, 8.0 Hz). Similar CD cotton effects of 2 with that of 1 suggested that the absolute configurations of 2 were 3S, 4R, 3′S, 4′R (Fig. S9†).
Sarcosomycin C (3) was obtained as a yellow amorphous powder. The molecular formula was established as C21H18O7 by HRESIMS (m/z 383.1123 [M + H]+, calcd for C21H19O7: 383.1131), indicating 13° of unsaturation. The IR absorption implied the presence of hydroxyls, α, β-unsaturated ketone and aromatic ring at 3424, 1669 (broad singlet), 1592, and 1468 cm−1. Comparison of the 1H and 13C NMR data with that of Plecmillin E indicated that they showed great similarity (Table 1). The main difference between them lay in the 13C resonance of C-2′ and C-3′ and the absence of a methoxy group in 3, suggesting that compound 3 was a demethylated derivative of Plecmillin E.5 The 1H–1H COSY, HSQC and HMBC correlations confirmed the planar structure of 3 (Fig. 2). The relative configuration of 3 was determined based on 1D selective NOE correlations and by comparison of its NMR data with that of urnucratin C. In the 1D selective NOE experiment, irradiation of H-4 (δH 5.24, 1H, br s) enhanced H-6′ (δH 6.69, 1H, dd, 7.8, 0.8 Hz), while irradiation of H-3′ (δH 4.34, 1H, dd, 9.4, 5.9 Hz) enhanced H-7 (δH 6.98, 1H, d, 8.4 Hz) (Fig. 3). Thus, the relative configurations of 3 were determined to be 1S*, 2S*, 3R*, 4R*, 3′S*, 4′R*. The CD cotton effects of 3 were consistent with that of Plecmillin E,5 indicating its absolute configurations to be 1S, 2S, 3R, 4R, 3′S, 4′R (Fig. S26†). The biosynthetic origin of 1–6 also supported the deduction mentioned above.5,6
Biological evaluation of spirobisnaphthalenes
Spirobisnaphthalenes have shown anticancer activities. To this end, we evaluated the anticancer effect of these six compounds. We found that 48 hour treatment of human colorectal HCT116 cancer cells with Plecmillin A (5) demonstrated the strongest growth inhibitory effect with an IC50 of ∼2.1 μM, whereas the sacrosomycins were greater than 200 μM (Fig. 4A–C). Subsequently, we monitored cell proliferation over five days in the presence of increasing concentrations of Plecmillin A (5) or one of the new spirobisnaphthalenes, sacrosomycin C (3). We found that Plecmillin A (5) significantly inhibited cell growth at and above 5 μM (Fig. 4G). In contrast, sacrosomycin C (3) did not inhibit cell growth at least by 10 μM (Fig. 4H). These results are consistent with the IC50 data, suggesting a potential tumor suppressing role of Plecmillin A (5).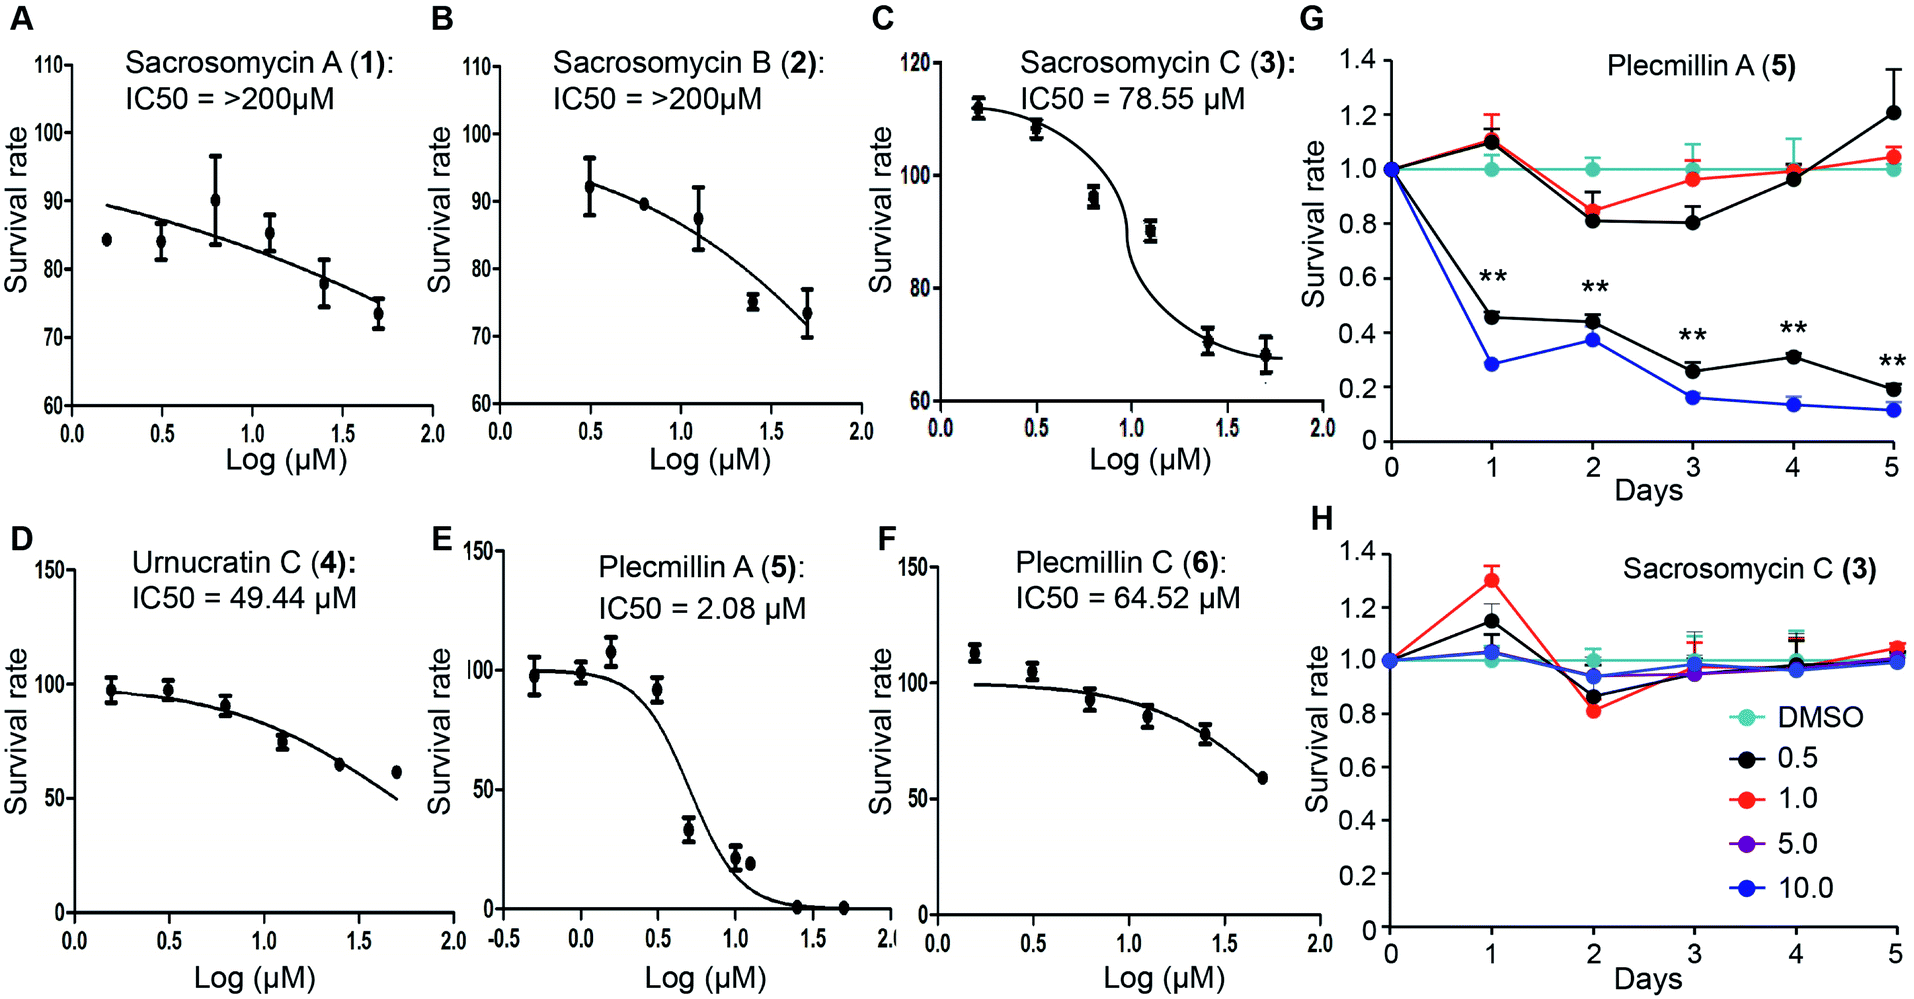 | ||
| Fig. 4 Effects of compounds 1–6 on cell proliferation. (A–F) The IC50 values of compounds 1–6 after 48 hour treatment of HCT116 cells were assessed by MTT assay. Sacrosomycin A–C (1–3) displayed greater than 200 μM of IC50. (G–H) Time- and dose-dependent growth of U2OS cells in the presence of Plecmillin A (5) or Sacrosomycin C (3). Data represent mean and standard deviation from three replicates. **P < 0.0001 compared with control groups at the corresponding time points. | ||
In our effort to determine how Plecmillin A (5) inhibited cancer cell growth, we measured the cell cycle profile by flow cytometry and found out that Plecmillin A (5) time-dependently induced accumulation of cells at the G2/M phase (Fig. 5A), suggesting that Plecmillin A (5) induces cell cycle arrest, which may contribute to the cancer cell growth inhibition. During analysis to understand the molecular mechanisms underlying the cell cycle arrest, we found that Plecmillin A (5), and to a much lesser degree, sacrosomycin C (3), increased the protein levels of P53 and P21 (Fig. 5B), indicating that this compound class upregulates the tumor suppressing P53–P21 pathway. On the other hand, these compounds did not clearly affect the expression of LC3B or P62 (Fig. 5B), two markers for autophagy, indicating that they did not affect the autophagic pathway.
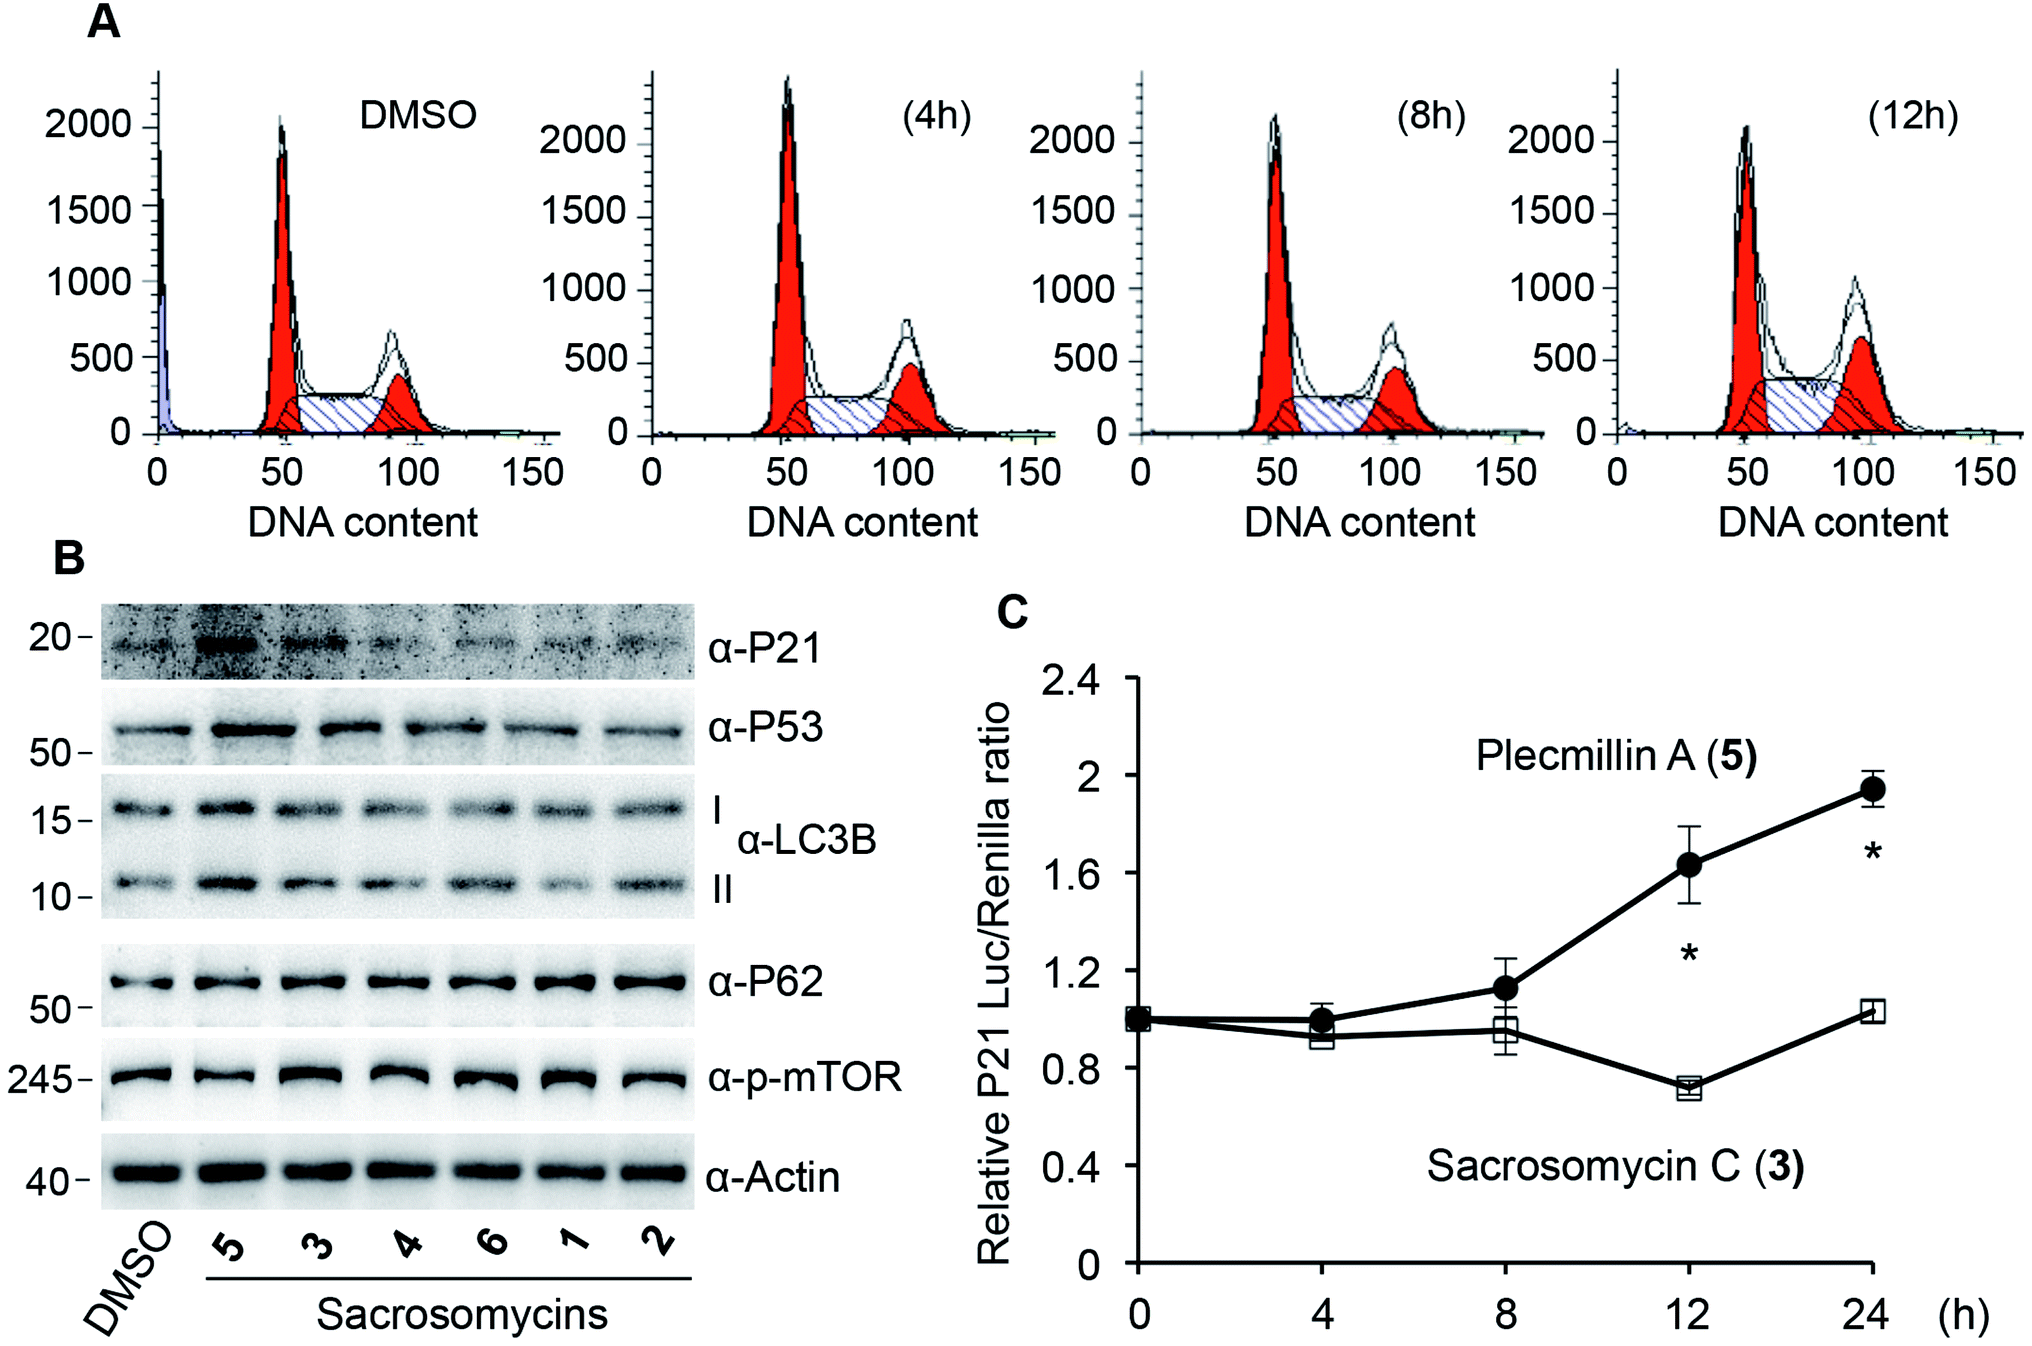 | ||
Fig. 5 Cell cycle arrest induced by Plecmillin A (5). (A) U2OS cells were treated with 5 μM Plecmillin A (5) for 0, 4, 8 and 12 hours and cell cycle profile was analyzed by flow cytometry. (B) U2OS cells were treated with 5 μM of compounds (1–6) for 6 hours, and protein expression was examined. I and II represent unlipidated and lipidated form of LC3B, respectively. (C) Luciferase reporter assay for P53-dependent transcription of CDKN1A. HEK293T cells were transfected with PGL3-P21 reporter and renilla luciferase vectors (1![[thin space (1/6-em)]](https://www.rsc.org/images/entities/char_2009.gif) :50) for 24 hours, treated with 5 μM Plecmillin A (5) or Sacrosomycin C (3) for indicated times. Data represent mean and standard of relative luciferase/renilla ratio from three independent experiments. :50) for 24 hours, treated with 5 μM Plecmillin A (5) or Sacrosomycin C (3) for indicated times. Data represent mean and standard of relative luciferase/renilla ratio from three independent experiments. | ||
To confirm that these compounds indeed activated the P53–P21 pathway, we constructed a luciferase reporter assay to measure P53-dependent transcriptional regulation of CDKN1A, the gene encoding P21. The results show that at the dose of 5 μM, Plecmillin A (5), but not sacrosomycin C (3), time-dependently increased the transcription level of CDKN1A (Fig. 5C). Since P21 inhibits the cyclin-dependent kinase to induce cell cycle arrest in G1 or G2/M phase,16,22–24 these results are consistent with the G2/M arrest by Plecmillin A (5).
To determine how spirobisnaphthalenes regulate the P53–P21 pathway and cell survival, we conducted a dose-dependent study of Plecmillin A (5) and sacrosomycin C (3). The results show that Plecmillin A (5), but not sacrosomycin C (3), greatly increased the protein level of P53 and P21 (Fig. 6A). There was a moderate increase in the MEK/ERK pathway as evidenced by a small increase in the levels of phosphorylated MEK and ERK (Fig. 6A); however, this increase in this pathway may have not effect the cell survival. Consistently, we observed a gradual increase in the level of cleaved poly (ADP-ribose) polymerase (PARP), a known cell death marker,25–27 by Plecmillin A (5), and to a much lesser degree sacrosomycin C (3) (Fig. 6A). Further, Plecmillin A (5), but not sacrosomycin C (3), dose-dependently reduced the long-term survival capability of U2OS cancer cells (Fig. 6B–C). These results suggest cell death induction by higher doses of spirobisnaphthalenes.
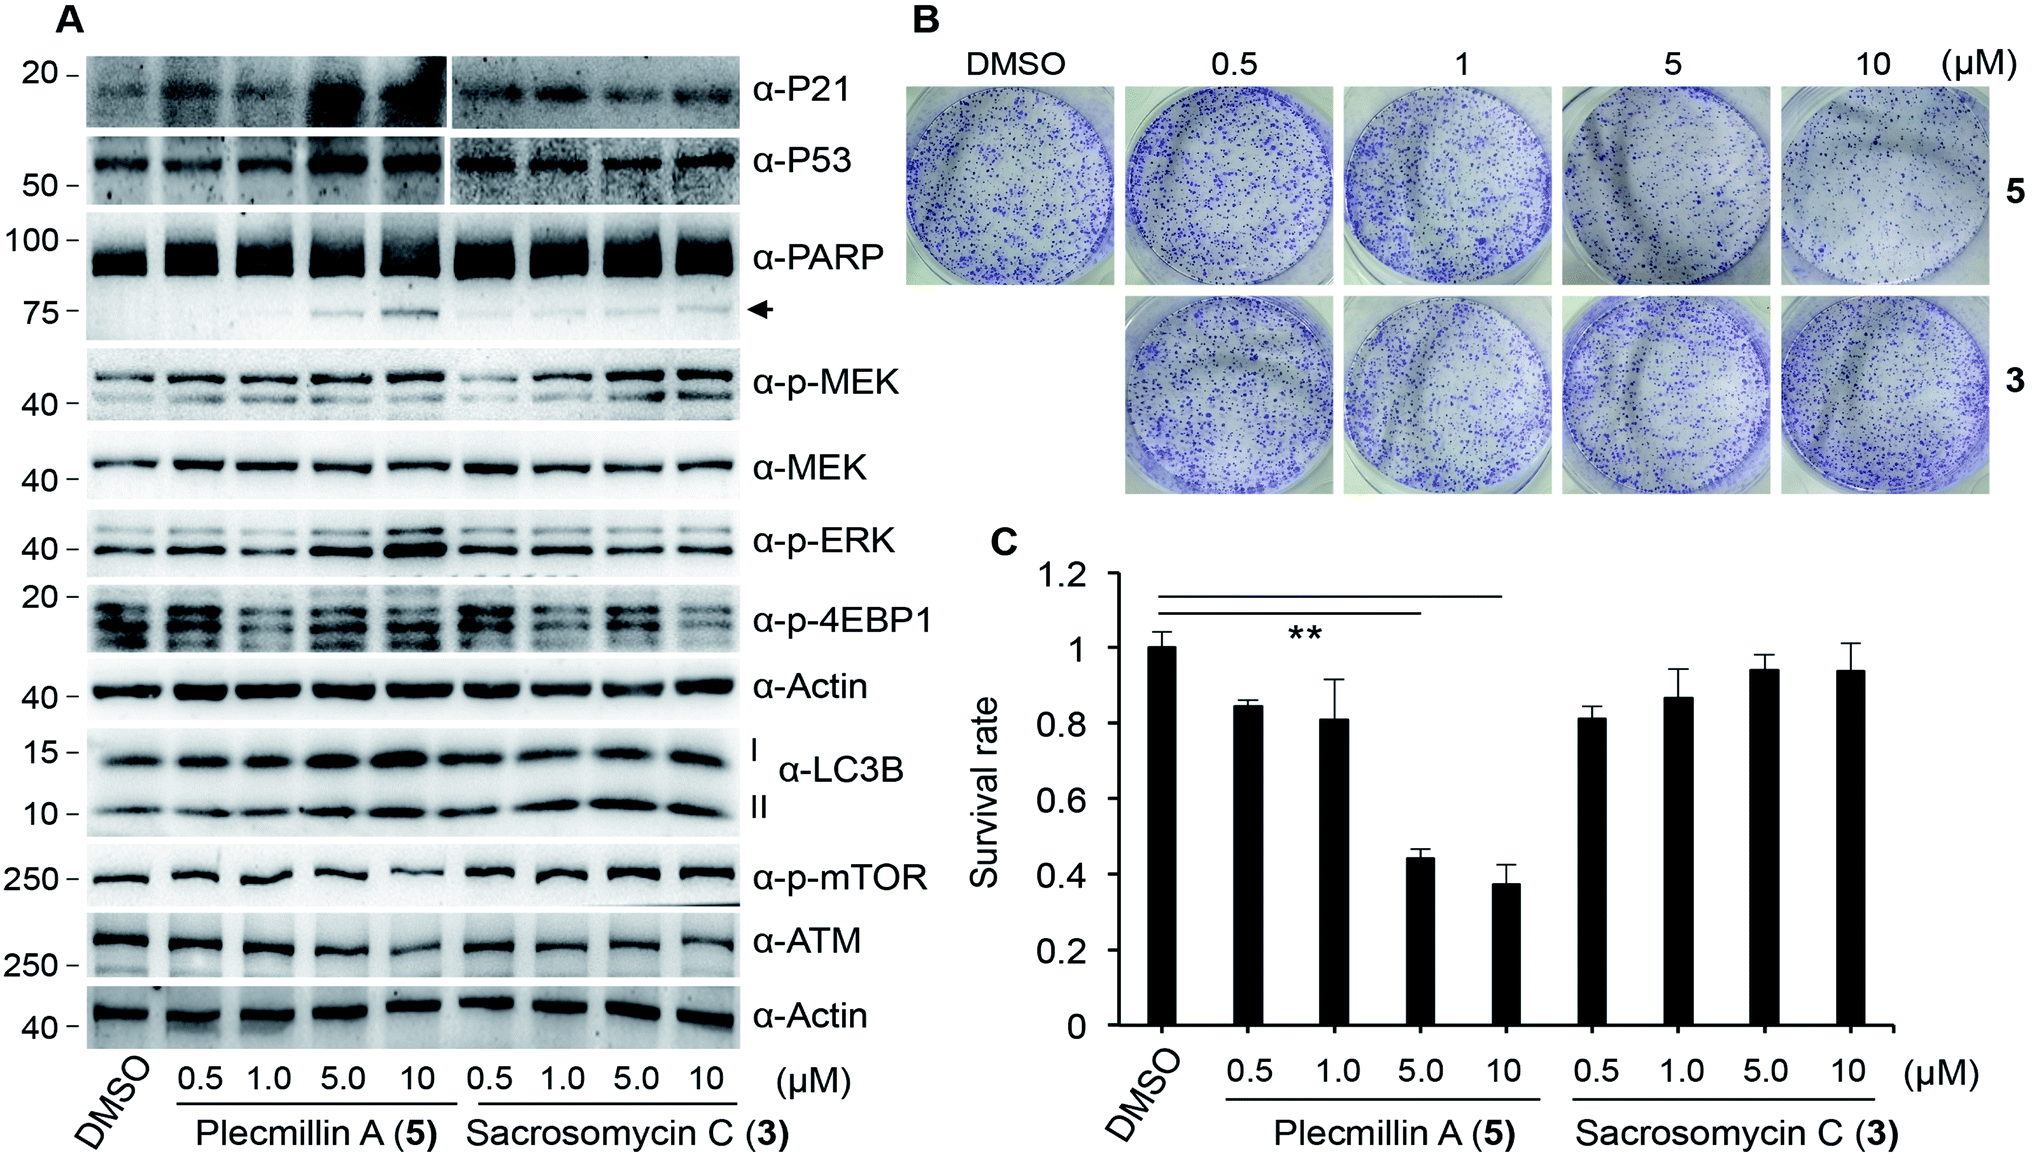 | ||
| Fig. 6 Dose-dependent P53–P21 induction and cell growth inhibition by Plecmillin A (5). (A) U2OS cells were treated with increasing doses of Plecmillin A (5) or Sacrosomycin C (3) for 12 hours and protein expression was assessed. Arrow indicates cleaved PARP. (B) Representative images of clonogenic survival of cells from A. (C) Quantitation of B. Data represent mean and standard deviation from three replicates. **P < 0.0001 compared with control group. | ||
Further, we found that Plecmillin A (5) time-dependently increased the protein levels of P53 and P21 (Fig. 7A). We noticed a weak induction of PARP cleavage (Fig. 7A), likely due to shorter incubation time than in previous experimental settings. To further confirm the induction of the P53–P21 pathway, we performed quantitative PCR (qPCR) to measure the mRNA levels of TP53 and CDKN1A. Our results show that Plecmillin A (5) induced upregulation of both genes during the first 8 h of treatment but then slightly declined at 24 h of treatment (Fig. 7B). The reduction at 24 h might be due to cell death after prolonged compound treatment. Similar to short-term growth curve results, Plecmillin A (5) time-dependently inhibited the long-term cell survival (Fig. 7C). To determine if this compound directly induces cell death, we measured dead cell population using trypan blue exclusion assay. The results show that Plecmillin A (5) time-dependently induced cell death (Fig. 7D). To understand if this compound could non-selectively kill normal cells, we measured cell death of a normal hepatocyte LO2 after treatment with Plecmillin A or Sacrosomycin C. The results show almost no cell death induction by these two compounds (Fig. 7E), indicating a relatively selective cell death induction in cancer cells by these compounds. Although the magnitude of cell death seemed to be weak, the increase was significant, supporting a chronic tumor suppressing role of this class of compound.
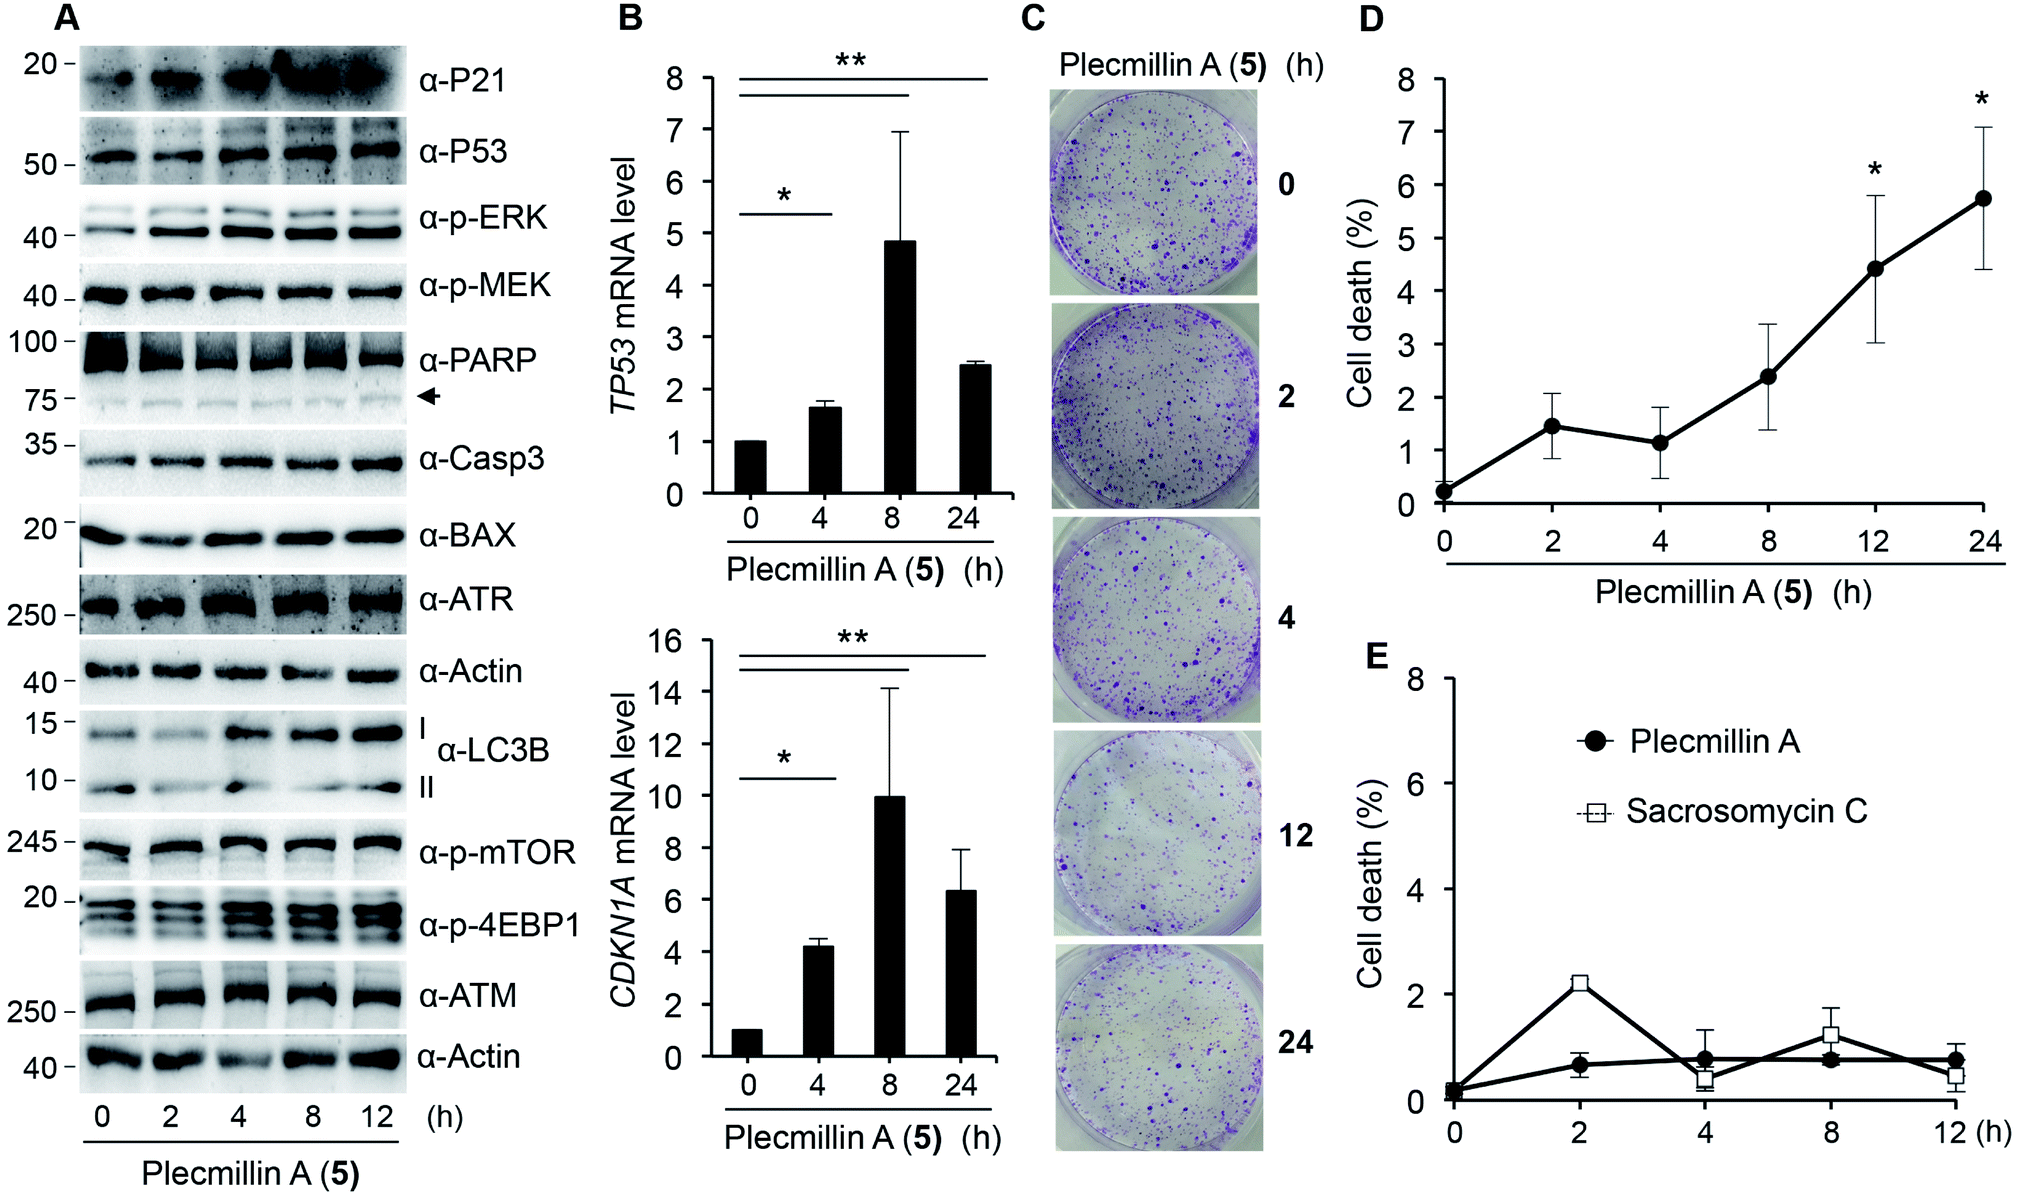 | ||
| Fig. 7 Time-dependent P53–P21 induction and cell growth inhibition by Plecmillin A (5). (A) U2OS cells were treated with 5 μM of Plecmillin A (5) for 0, 2, 4, 8 and 12 hours and protein expression was assessed. Arrow indicates cleaved PARP. (B) qPCR results of TP53 and CDKN1A in U2OS cells treated with 5 μM of Plecmillin A (5) for 0, 4, 8 and 24 hours. (C) Representative images of clonogenic survival of cells from A. (D) Quantitation of C. (E) LO2 cells were treated with 10 μM of Plecmillin A (5) or Sacrosomycin C for 0, 4, 8 and 12 hours, and cell death was assessed. Data represent mean and standard deviation from three replicates. *P < 0.01 and **P < 0.0001 compared with the control group. | ||
Conclusion
In summary, three new and three known spirobisnaphthalenes were obtained from the extract of a cultured nonsporulating endolichenic fungus. The three novel compounds were described as two partially saturated naphthalene rings joined together by one oxygen bridge (C4′–C4) and one carbon–carbon bridge (C4′–C6), which was belonged to the fourth subtype of spirobisnaphthalenes. This is also the first report of spirobisnaphthalenes obtained from endolichenic fungus and from this family Sarcosomataceae. Anticancer activity evaluation reveals that Plecmillin A (5) displayed potent growth inhibitory effect on colon HCT116 and osteosarcoma U2OS cancer cell lines, but not on normal hepatocytes. Mechanically, Plecmillin A (5) induced the upregulation of the P53–P21 pathway, correlating with the cell cycle arrest effect by this compound. Plecmillin A (5) treatment at relatively higher doses induced cancer cell death. These biological results allow us to identify more potent spirobisnaphthalenes, for instance through chemical modification of the three novel compounds, in the anticancer regimen in the near future. In conclusion, spirobisnaphthalenes isolated from an endolichenic fungus strain (CGMCC 3.15192) demonstrated potential anticancer effect.Experimental procedure
:1 to yield four subfractions (W2-a to W2-d). W2-b (1.15 g) was subjected to a silica gel column chromatography eluted with a stepwise elution of CHCl3/acetone (from 98:2 to 0:100) to obtained 14 subfractions. W2-b–h (183 mg) was purified by RPHPLC (40% MeOH in H2O, v/v) on an YMC-Pack ODS-A column (10.0 × 250 mm, 5 μm, 4.0 mL min−1) to yield compounds 4 (14.5 mg, tR = 23.3 min) and 6 (6.9 mg, tR = 24.1 min). Compound 1 (8.2 mg, tR = 25.3 min) was afforded from the subfraction W2-b–g (52.5 mg) using RPHPLC (40% MeOH in H2O, v/v). Compound 2 (18.5 mg, tR = 16.3 min) was afforded from the subfraction W2-b–i (52.5 mg) using RPHPLC (25% CH3CN in H2O, v/v). Compound 3 (2.5 mg, tR = 15.8 min) was afforded from the subfraction W2-b-72 (50.0 mg) using RPHPLC (20% CH3CN in H2O, v/v). Meanwhile, the fraction W3 (1.49 g) was chromatographed on a Sephadex LH-20 column chromatography eluted with CHCl3–MeOH 1:1 to yield five subfractions (W3-a to W3-e). W3-c (0.43 g) was subjected to a silica gel column chromatography eluted with a stepwise elution of CHCl3/acetone (from 98:2 to 0:100) to obtained five subfractions. W3-c-2 (50.4 mg) was purified by RPHPLC (40% MeOH in H2O, v/v) on an YMC-Pack ODS-A column (10.0 × 250 mm, 5 μm, 4.0 mL min−1) to yield compound 5 (7.2 mg, tR = 15.7 min).Sarcosomycin A (1): yellow powder; [α]25D 26.8 (c = 0.10, MeOH); UV (MeOH): λmax (logε) = 216 nm (4.41), 255 nm (3.98), 319 nm (3.56); CD (MeOH) 214 (Δε −10.6), 227 (Δε +5.7), 260 (Δε +10.9), 312 (Δε −1.4) nm; IR (KBr): νmax = 3423, 2925, 2854, 1657, 1594 cm−1; HR-ESI-MS: (m/z 383.1116 [M + H]+, calcd for C21H19O7: 383.1131). 1H and 13C-NMR data see Table 1.
Sarcosomycin B (2): yellow powder; [α]25D 3.7 (c = 0.95, MeOH); UV (MeOH): λmax (logε) = 218 nm (4.34), 254 nm (3.90), 323 nm (3.48); UV (CH3CN): λmax (logε) = 218 nm (4.34), 254 nm (3.90), 323 nm (3.48); CD (MeOH): 214 (Δε −11.5), 260 (Δε +9.7), 320 (Δε −1.9) nm; CD (CH3CN): 214 (Δε −6.3), 227 (Δε +6.7), 260 (Δε +11.6), 315 (Δε −1.7) nm; IR (KBr): νmax = 3433, 1674, 1656, 1593 cm−1; HR-ESI-MS: (m/z 397.1288 [M + H]+, calcd. for C22H21O7: 397.1287). 1H and 13C-NMR data see Table 1.
Sarcosomycin C (3): yellow powder; [α] 5.2 (c = 0.11, MeOH); UV (MeOH): λmax (logε) = 202 nm (−4.68), 254 nm (3.98), 317 nm (3.65); IR (KBr): νmax = 3423, 2924, 2854, 1669, 1591, 1281, 1241 cm−1; HR-ESI-MS: (m/z 383.1123 [M + H]+, calcd for C21H19O7: 383.1131). 1H and 13C-NMR data see Table 1.
Biological materials and methods
Conflicts of interest
There are no conflicts to declare.Acknowledgements
This work was supported by grants from National Key Research and Development Program of China (Grant Number: 2018YFC0311002).Notes and references
- B. Helge and Z. Axel, Phytochemistry, 2000, 55, 311–316 CrossRef.
- B. Bjorn, W. Barbara and Z. Axel, J. Antibiot., 2000, 53, 153–157 CrossRef PubMed.
- H. Ogishi, N. Chiba, T. Mikawa, T. Sasaki, S. Miyaji, and M. Sezaki, Jpn Pat., JP 01294686 A, 1989.
- L. Zhou, J. Zhao, T. Shan, X. Cai and Y. Peng, Mini-Rev. Med. Chem., 2010, 10, 977–989 CrossRef CAS PubMed.
- K. Wang, L. Bao, K. Ma, W. Qi, F. Song, Y. Yao, W. Yin, L. Zhang, Y. Huang, J. Han and H. Liu, Eur. J. Org. Chem., 2016, 25, 4338–4346 CrossRef.
- X. Liu, R. William, J. Thomas, R. Marc, M. Liu, P. Huang, Z. Liu, Y. Wang, C. Nicholas, S. Cassandra, H. Scott, M. Aaron and L. Zhang, J. Nat. Prod., 2012, 75, 1534–1538 CrossRef CAS PubMed.
- X. Liu, Y. Zhao, W. Wang, M. Wang and L. Zhou, Youji Huaxue, 2017, 37, 2883–2894 CrossRef CAS.
- C. P. Laptenko, Cell Death Differ., 2006, 13, 951–961 CrossRef PubMed.
- S. Lowe, E. Schmitt, S. Smith, B. Osborne and T. Jacks, Nature, 1993, 362, 847–849 CrossRef CAS PubMed.
- E. Yonish-Rouach, D. Resnitzky, J. Lotem, L. Sachs, A. Kimchi and M. Oren, Nature, 1991, 352, 345–347 CrossRef CAS.
- A. Clarke, C. Purdie, D. Harrison, R. Morris, C. Bird, M. Hooper and A. Wyllie, Nature, 1993, 362, 849–852 CrossRef CAS.
- T. Miyashita, S. Krajewski, M. Krajewska, H. Wang, H. Lin, D. Liebermann, B. Hoffman and J. Reed, Oncogene, 1994, 9, 1799–1805 CAS.
- W. Deiry, T. Tokino, V. Velculescu, D. Levy, R. Parsons, J. Trent, D. Lin, W. Mercer, K. Kinzler and B. Vogelstein, Cell, 1993, 75, 817–825 CrossRef PubMed.
- J. Harper, G. Adami, N. Wei, K. Keyomarsi and S. Elledge, Cell, 1993, 75, 805–816 CrossRef CAS.
- W. Hoffman, S. Biade, J. Zilfou, J. Chen and M. Murphy, J. Biol. Chem., 2002, 277, 3247–3257 CrossRef CAS.
- E. Kastenhuber and S. Lowe, Cell, 2017, 170, 1062–1078 CrossRef CAS PubMed.
- C. Deng, P. Zhang, J. Harper, S. Elledge and P. Leder, Cell, 1995, 82, 675–684 CrossRef CAS.
- J. Brugarolas, C. Chandrasekaran, J. Gordon, D. Beach, T. Jacks and G. Hannon, Nature, 1995, 377, 552–557 CrossRef CAS PubMed.
- L. Donehower, M. Harvey, B. Slagle, M. McArthur, C. Montgomery, J. Butel and A. Bradley, Nature, 1992, 356, 215–221 CrossRef CAS.
- K. Lohr, C. Moritz, A. Contente and M. Dobbelstein, J. Biol. Chem., 2003, 278, 32507–32516 CrossRef PubMed.
- I. Shats, M. Milyavsky, X. Tang, P. Stambolsky, N. Erez, R. Brosh, I. Kogan, I. Braunstein, M. Tzukerman, D. Ginsberg and V. Rotter, J. Biol. Chem., 2004, 279, 50976–50985 CrossRef CAS PubMed.
- Y. Xiong, G. Hannon, H. Zhang, D. Casso, R. Kobayashi and D. Beach, Nature, 1993, 366, 701–704 CrossRef CAS PubMed.
- T. Abbas and A. Dutta, Nat. Rev. Cancer, 2009, 9, 400–414 CrossRef CAS PubMed.
- A. Karimian, Y. Ahmadi and B. Yousefi, DNA Repair, 2016, 42, 63–71 CrossRef CAS PubMed.
- P. Duriez and G. Shah, Biochem. Cell Biol., 1997, 75, 337–349 CrossRef CAS PubMed.
- F. Alnemri, G. Litwack and E. Alnemri, J. Biol. Chem., 1994, 269, 30761–30764 Search PubMed.
- D. Nicholson, A. Ali, N. Thornberry, J. Vaillancourt, C. Ding, M. Gallant, Y. Gareau, P. Griffin, M. Labelle and Y. Lazebnik, Nature, 1995, 376, 37–43 CrossRef CAS PubMed.
Footnotes |
| † Electronic supplementary information (ESI) available: The 1D and 2D NMR, HRESIMS, IR and CD spectra of compounds 1–3. See DOI: 10.1039/c9ra07917c |
| ‡ Equally to this work. |
| This journal is © The Royal Society of Chemistry 2019 |