
 Open Access Article
 This Open Access Article is licensed under a Creative Commons Attribution-Non Commercial 3.0 Unported Licence
Low-temperature all-solid-state lithium-ion batteries based on a di-cross-linked starch solid electrolyte†
Zehua Lin and
Jin Liu*
and
Jin Liu*
School of Metallurgy and Environment, Central South University, Changsha, 410083, P. R. China. E-mail: jinliu@csu.edu.cn
First published on 28th October 2019
Abstract
The preparation of a low-temperature solid electrolyte is a challenge for the commercialization of the all-solid-state lithium-ion battery (ASSLIB). Here we report a starch-based solid electrolyte that displays phenomenal electrochemical properties below room temperature (RT). The starch host of the electrolyte is synthesized by two cross-linking reactions, which provide sufficient and orderly binding sites for the lithium salt to dissolve. At 25 °C, the solid electrolyte has exceptional ionic conductivity (σ, 3.10 × 10⁻⁴ S cm−1), lithium-ion transfer number (t+, 0.82) and decomposition potential (dP, 4.91 V). At −20 °C, it still has outstanding σ (3.10 × 10⁻⁵ S cm−1), t+ (0.72) and dP (5.50 V). The LiFePO4 ASSLIB assembled with the electrolyte exhibits unique specific capacity and long cycling life below RT, and the LiNi0.8Co0.1Mn0.1O2 ASSLIB can operate at 4.3 V and 0 °C. This work provides a solution to solve the current challenges of ASSLIBs to widen their scope of applications.
Introduction
The all-solid-state lithium ion battery (ASSLIB) is one of the most promising lithium batteries due to its superior safety and energy density properties.1 As a crucial part of the ASSLIB, a solid electrolyte, in particular a solid polymer electrolyte (SPE), has attracted extensive attention due to its extra advantages in flexibility and interfacial performance.2 Poly (ethylene oxide) (PEO) was the first discovered host of a SPE.3 It can dissolve lithium salt through the lone pair electrons of oxygen atoms in the ether oxygen bonds (–C–O–C–), and transfer lithium ions through the chain movement.4 However, hindered by the crystallinity of PEO, the ionic conductivity of PEO is merely ∼10−7 S cm−1 and the lithium ion transfer number (t+) is generally lower than 0.2 at room temperature (RT).5 This PEO-based solid electrolyte is hardly compatible with operation of ASSLIB at RT. Research has been done to improve the electrochemical properties of PEO based electrolyte at high temperature.6Methods to increase the ionic conductivity of SPE have become a decisive matter for its application in ASSLIB. Through increasing the chain movements to decrease crystallinity of PEO, lithium salt dissociation was promoted.7 This indicates that conductible lithium ions is directly dependent on effective dissociation of lithium salt.
Starch is a kind of bio-molecules composed of a six-membered ring of glucose monomer and alkyl chain in series, which has been demonstrated to be a multifunctional material for SPE.8 More importantly, it is equipped with two ether oxygen bonds and three hydroxyl (–OH) groups per monomer for dissociation of lithium salt and conduction of lithium ions. Because the pKa of starch is 13 at 40 °C,9 the –OH groups will completely ionize into H+ and –O− when pH > 13. The –O− will combine with Li+ through an ionic bond that is too stable to release the lithium ion, leading to unconductible “dead” lithium ion. When pH < 13, the –OH groups will form hydrogen-bonded nets that are strongly hydrophilic and may react with lithium metal anode, especially at pH > 13, resulting in a fast corrosion due to a black coat of the irreversible Li compound.10
In order to prevent corrosion and “dead” Li+, the –OH can be modified to form a weaker bond to lithium ion. For example, –OH bonds in starch reacted with a crossing linker (KH560) to produce –O–Si–O– bonds.11 Such a structure is able to provide both more and shorter pathways for lithium ion transfer than PEO can.12 However, the drawback is the incomplete cross-linking from the residual of –OH groups, probably due to the influence of steric hindrance to the cross-linking reaction, which may be reflected in the inferior film-forming property.13
On another note, boron (B) is preferable receptors for anions.14 On account of this, a solid electrolyte host was synthesized by cross-linking poly(ethylene glycol) (PEG) with borane (BH3).15 When the electrolyte was assembled into an all-solid-state LiFePO4 (LFP) battery, it can work from RT to 140 °C.
In this work, we develop a low temperature solid electrolyte host through two cross-linking reactions, in which KH560 as a larger cross-linker reacts with starch first to form a starch-Si (StSi) precursor, and BH3 as a smaller cross-linker continues to cross-link with the residual of –OH groups. With constructing an orderly ether-bonded net for lithium salt dissolution and hybridizing organic compounds with inorganic elements of B and Si at a molecular level, a solid electrolyte host of B-Starch-Si (BStSi) is synthesized, of which a schematic diagram for the reactions is shown as Fig. 1a.
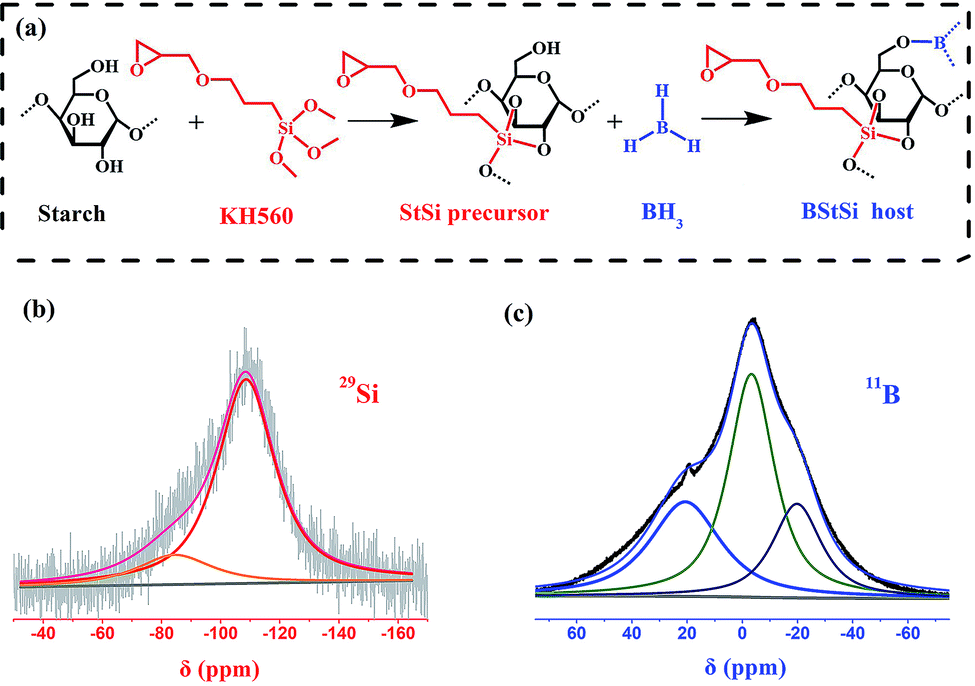 | ||
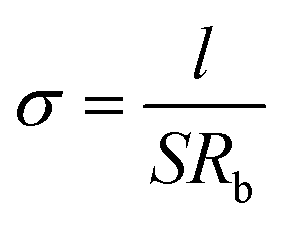
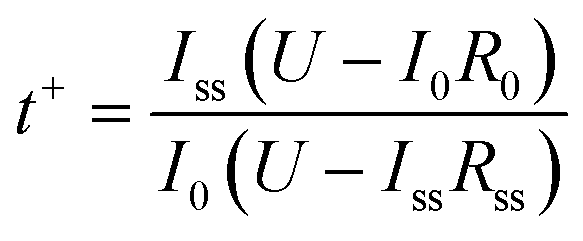
| Fig. 1 (a) A possible chemical structure of the BStSi host. (b) 29Si and (c) 11B liquid NMR of the BStSi host. Both of them are tested with a Teflon NMR tube. | ||
Based on above design, the BStSi SPE possesses excellent flexibility and high lithium ion transferring ability at low temperature. Moreover, an outstanding electrochemical performance is achieved below RT for ASSLIBs assembled by the BStSi SPE, LFP/NCM811 cathode and lithium metal anode. Photos of the freestanding and flexible BStSi SPE (flat and fold) are shown as Fig. S1.† Moreover, the safety performance of BStSi based ASSLIB is confirmed with puncturing experiment, shown as Fig. S2.†
Experiment
Materials
The reagent grade corn starch and γ-(2,3-epoxypropoxy)-propyltrimethoxy-silane (KH560) were purchased from Aladdin. Borane-tetrahy-drofuran (BH3/THF, 1 mol L−1 in THF) and lithium bis(tri-fluoromethylsulfonyl)imide (LiTFSI > 99%) were obtained from J&K company. All solvents and other reagents were of analytical grade and used without further purification.Synthesis and characterization of BStSi solid electrolyte host
30.000 g dimethyl sulfoxide (DMSO) was added in a flask to dissolve 1.000 g starch and stirred at 90 °C. KH560 was added in the flask at certain molar ratios of starch monomer![[thin space (1/6-em)]](https://www.rsc.org/images/entities/char_2009.gif) :KH560 = 10:9, 7:6, 5:4, 3:2 and 2:1. This cross-linking reaction was carried out at 90 °C in argon atmosphere for 12 h to produce the St-Si precursor. After that, the temperature was decreased to 25 °C by a Cryogenic bath, and added BH3/THF in the precursor at the molar ratio of (BH3 + KH560):starch monomer = 1:1. This reaction lasted for 12 h, and a transparent solution was obtained. The solution was dried at 60 °C for 16 h in a glove box to form the BStSi solid electrolyte host.
:KH560 = 10:9, 7:6, 5:4, 3:2 and 2:1. This cross-linking reaction was carried out at 90 °C in argon atmosphere for 12 h to produce the St-Si precursor. After that, the temperature was decreased to 25 °C by a Cryogenic bath, and added BH3/THF in the precursor at the molar ratio of (BH3 + KH560):starch monomer = 1:1. This reaction lasted for 12 h, and a transparent solution was obtained. The solution was dried at 60 °C for 16 h in a glove box to form the BStSi solid electrolyte host.
Liquid 29Si and 11B NMR (BRUCKER, AVANCE III 400 MHz, Switzerland) of the BStSi solid electrolyte host that was re-dissolved in d-DMSO solvent were performed to examine the extent of the cross-linking reactions. Fourier transform infrared spectroscopy (FTIR) (BRUCKER, TENSOR II, Germany) was used in characterization of the chemical structure. Thermal stability was examined by thermogravimetry analysis (TGA, SDTQ-600, TA, USA) with about 10 mg samples heated from room temperature to 800 °C under argon atmosphere at a heating rate of 10 °C min−1.
Electrochemical properties tests of the BStSi solid electrolyte
LiTFSI was added directly to the BStSi host. The solution was mixed and dried in an argon glove box at 60 °C for 16 h to form the BStSi solid electrolyte film (BStSi). The weight contents of LiTFSI varied from 20 wt% to 60 wt%. The ionic conductivity (σ) was determined by alternative current (AC) impedance spectroscopy. The BStSi film was sandwiched by two stainless steel plates (d = 16 mm) to structure a SS/BStSi/SS cell. The sweep frequency ranged from 1 MHz to 1 Hz with AC amplitude of 10 mV. The σ was calculated by the following equation:where l refers to the thickness of electrolyte, S refers to the contact area between electrode and electrolyte and Rb refers to the bulk resistance of the electrolyte, which was obtained from the AC impedance spectrum intersection with the real axis. The tests were conducted with an electrochemical workstation (PARSTAT 4000, Princeton Applied Research, USA) and the temperature was controlled by a high-low temperature chamber (SDH4005P, HAOYUAN CO., China).
The Li+ transference number (t+) of the solid electrolyte was evaluated by a direct current (DC) polarization/AC impedance method using a Li/BStSi/Li cell and calculated by the following equation:16
The decomposition potential of the solid electrolyte film was tested by cyclic voltammetry using a SS/BStSi/Li cell. The scan route is 3 V → −1 V → 6 V at a scan rate of 10 mV s−1.
The compatibility of the BStSi solid electrolyte with lithium was tested by a constant current polarization using a Li/BStSi/Li cell. The current was maintained 0.02 mA for 70 cycles, then increased to 0.05 mA and 0.1 mA each for 50 cycles, finally returned to 0.02 mA for 100 cycles, and each cycle was consisted of 0.5 h charge and 0.5 h discharge period with 5 min repose in between.
Performance tests of the BStSi all solid-state lithium ion batteries
The LiFePO4(LFP)/BStSi/Li batteries (sealed in 2025 coin cell) were assembled with LFP as cathode (d = 10 mm), BStSi as solid electrolyte and lithium metal wafer as anode (d = 16 mm). The cathode was fabricated using LFP mixed directly with conductive carbon (Super P, SP) and polyacrylic acid (PAA) at a mass ratio of LFP:SP:PAA = 7:2:1. Galvanostatic charge/discharge cycling at 0 °C and −20 °C was performed in a battery test system (LAND CT2001A, BTRBTS, China) and the batteries were held in a fridge (Haier, BCD-220WDVL, China). The cut-off voltages of the charge and discharge process were set at 2.5 V and 4.0 V respectively.
The lithium diffusion coefficient (D) in the LFP electrode was calculated using the following equation.17
| Zre = Rb + Rct + σω−1/2 |
| ω = 2πf |
The graph of Zre against ω−1/2 in the low frequency region is a straight line with the slope of σ, and the Zre − ω−1/2 plots were presented in Fig. S10† and the values were depicted in Table S2.†
The LiNi0.8Co0.1Mn0.1(NCM811)/BStSi/Li batteries were assembled with NCM811 cathode, BStSi solid electrolyte and lithium anode. The NCM811 cathode was prepared at a mass ratio of NCM811:SP:PVDF = 8:1:1. The cycle performance at 45 °C was tested with a battery warming in an oven with temperature accuracy of ±1 °C. The discharge cut-off voltage was set at 2.5 V. The charge cut-off voltage was started at 4.0 V and was increased by 0.1 V for each 5 cycles.
Discussion
Structure characterization
In order to confirm the structure of BStSi, the liquid 29Si and 11B NMR were conducted with a Teflon tube (silicon and boron free) to eliminate the background signal. As shown in Fig. 1b, the curve of 29Si NMR is constructed with two peaks. At −109 ppm, it is a Q4 peak of silicon, which is ascribed to a three-dimensional cross-linked framework19 derived from the –Si–O– bonds of KH560 grafting with –OH groups of starch molecules. At −83 ppm, it is the Q1 peak that is assigned to a silicon-containing group seated at the end of a chain,20 which may belong to uncross-linked silicon in KH560.In Fig. 1c, the 11B NMR curve can be divided into three peaks. The peak at 19.3 ppm is ascribed to B(–O–C–)3-like structure, confirming that BH3 has cross-linked with –OH groups in starch.15,21 The peaks at −3.2 ppm and −20 ppm arise from four-coordinated BX3L (L = ligand),22 which is considered to be from the B(–O–C–)3 and BH3 with THF complex.
FTIR was applied for further confirmation of the reactions among starch and KH560 and BH3 (see Fig. S3†). New –Si–O–C– and –B–O–C– bonds are observed and the –OH groups are obviously consumed. These results indicate that the synthesis was carried out as designed.
To identify the thermal stability, thermal gravimetric analysis (TGA) is conducted with StSi and BStSi and the results are shown in Fig. S4.† The decomposition temperature is higher than 150 °C, which is stable enough for the use of ASSLIB below 150 °C.
Electrochemical proprieties
The dissolving capability of the electrolyte host to lithium salt can be expressed by the ionic conductivity.5e,23 Fig. 2a is the ionic conductivity in the range of −20 °C to 100 °C. After optimizing the proportion of components and the concentration of lithium salt (shown in Fig. S5 and S6†), the highest ionic conductivity is obtained with a molar ratio of BH3:starch monomer:KH560 = 1:5:4 and 50 wt% LiTFSI. It shows an exceptional average ionic conductivity of 3.10 × 10⁻⁴ S cm−1 at RT. It is also noteworthy that high ionic conductivities of 1.23 × 10⁻⁴ S cm−1 at 0 °C and 3.10 × 10⁻⁵ S cm−1 at −20 °C are obtained.
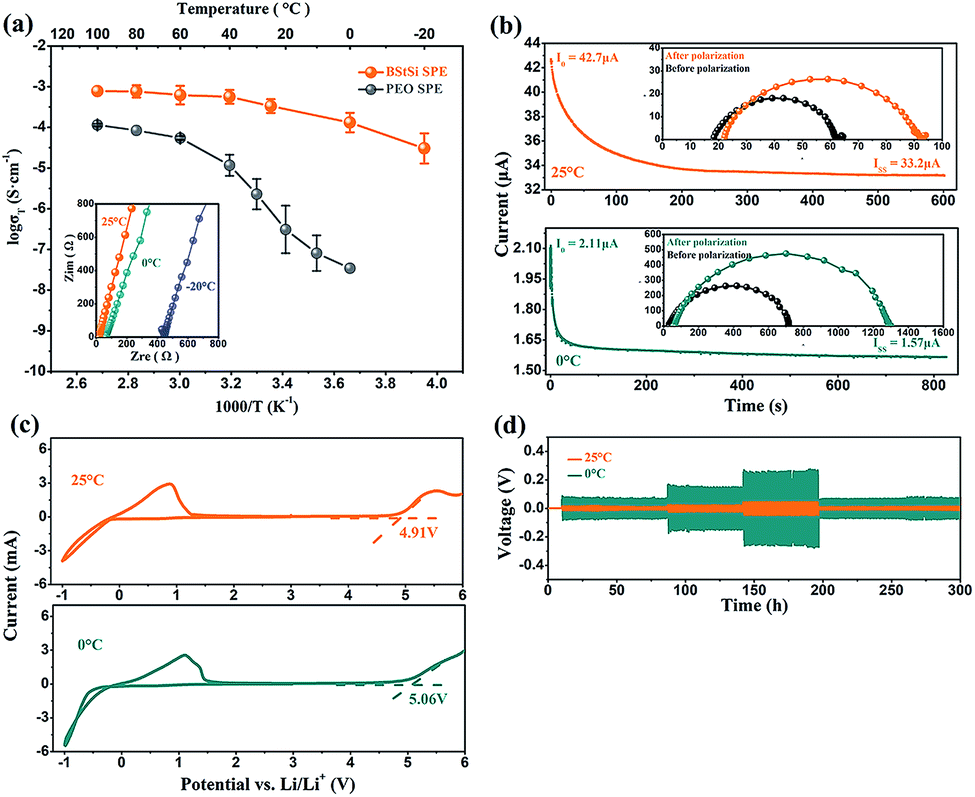 | ||
| Fig. 2 (a) Ionic conductivity of BStSi and PEO SPE. The inset is AC impedance spectra of BStSi. (b) Chronoamperometry of Li/BStSi/Li cells. The inset shows the AC impedance spectra before and after polarization. (c) Cyclic voltammetry of the SS/BStSi/Li cells at a rate of 10 mV s−1. (d) Polarization tests of Li/BStSi/Li cells and the data in Table 1. | ||
The inset in Fig. 2a reveals the AC impedance spectra of the SS/BStSi/SS cells. The values read only 18.2 Ω for 25 °C, 63.8 Ω for 0 °C and 447.9 Ω for −20 °C, indicating that ions can transfer smoothly in the electrolyte below RT. As a comparison, the temperature dependence of the ionic conductivity was also tested at 30.2 wt% LiTFSI and 69.8 wt% PEO of the solid electrolyte. There is an inflection point on the curve around 60 °C, corresponding to the crystalline phase transition temperature (Tc). Below the Tc, the ionic conductivity drops with a decrease of temperature to 4.32 × 10⁻⁷ S cm−1 at 20 °C and 3.42 × 10⁻⁸ S cm−1 at 0 °C, only one thousandth of the BStSi solid electrolyte's at 0 °C. From this contrast, it can be deduced that BStSi is exceedingly superior compared to the PEO-based SPE in transferring ions, especially when the temperature goes below RT.
The DC polarization curves of the Li/BStSi/Li cells at 25 °C, 0 °C and −20 °C are shown in Fig. 2b and S7.† The values of current and impedance are also listed in Table S1.† According to the Bruce–Vincent–Evans equation, the values of t+ are calculated to be 0.72, 0.79 and 0.82 at −20 °C, 0 °C and 25 °C separately. This high t+ can be ascribed to the starch structure and cross-linking reactions. Each monomer in starch is equipped with two ether oxygen bonds of –C–O–C–, which present Lewis base property due to two pairs of lone electrons on the oxygen atom. These lone electrons have a weak attraction for lithium ions, making it dissociated from lithium salt effectively. The cross-linking reaction also strengthens the ability of dissociation. The –B–O–C– and –Si–O–C– bonds hold equal effects to the –C–O–C– bonds. This is to say, each monomer in the BStSi host theoretically has five ordered lithium-ion binding sites to provide for the efficient dissociation of lithium salt. Meanwhile, PEO has only one –C–O–C– bond in each monomer so it may require cooperation of 5–6 monomers to dissociate a lithium ion, leading to gridlocks of lithium salt dissociation.12,24 On account of this, the BStSi solid electrolyte has a higher t+ than PEO.
The BStSi solid electrolyte was packed into a SS/BStSi/Li cell to obtain the decomposition potential by linear sweep voltammetry (LSV), as depicted in Fig. 2c and S8.† The planting potential at 25 °C, 0 °C and −20 °C is −0.15 V, −0.35 V and −0.62 V respectively, corresponding to the Li deposition on SS. No other peaks are found, which implies the electrochemical stability at the anode/electrolyte interface during reduction process. The Li+ stripping peak appears at 0.86 V (25 °C), 1.10 V (0 °C) and 0.90 V (−20 °C). This indicates that the redox reactions are reversible. In addition, the BStSi solid electrolyte is stable up to 4.91 V at 25 °C, 5.06 V at 0 °C and 5.50 V at −20 °C, which are higher than that of commercial liquid electrolyte (∼4.5 V). With the wide electrochemical window, the BStSi solid electrolyte will satisfy a cathode with a high potential as well as high capacity.
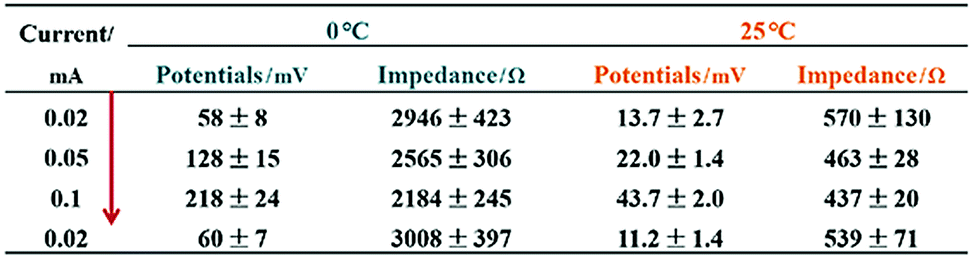
Besides, a constant current polarization test was conducted with a Li/BStSi/Li symmetric cell to simulate the lithium ion transfer and planting/stripping process, aimed at evaluating the interfacial stability of the electrolyte to lithium anode during cycling. Fig. 2d shows a variation of voltage with time at different current stages. Table 1 lists the average values of polarization potentials and impedances at each current stage, which are 13.7 mV, 22.0 mV, 43.7 mV at 25 °C and 58 mV, 128 mV, 218 mV at 0 °C for 0.02 mA, 0.05 mA and 0.1 mA separately. When the current returns to 0.02 mA after 300 hours cycling, the potentials maintain 11.2 mV at 25 °C and 60 mV at 0 °C, which displays little disparity with the first 0.02 mA current stage. This stable polarization impedance indicates that a compatible interface between electrolyte and lithium anode is formed.
Low temperature performance of LFP/BStSi/Li and NCM811/BStSi/Li batteries
Fig. 3a demonstrates the superior performance of ASSLIB in capacity and retention at RT as well as in low temperature. At 25 °C and 0.1C, the initial discharge capacity is 155.7 mA h g−1 and reaches the maximum discharge capacity of 163.5 mA h g−1 at the 6th cycle, which is close to the theoretical discharge capacity of LFP (172 mA h g−1). The discharge capacity maintains 150.4 mA h g−1 after 85 cycles. When the C-rate increases to 1C, the batteries presents an average discharge capacity of 120.2 ± 3.4 mA h g−1 during 250 cycles (see Fig. S9†).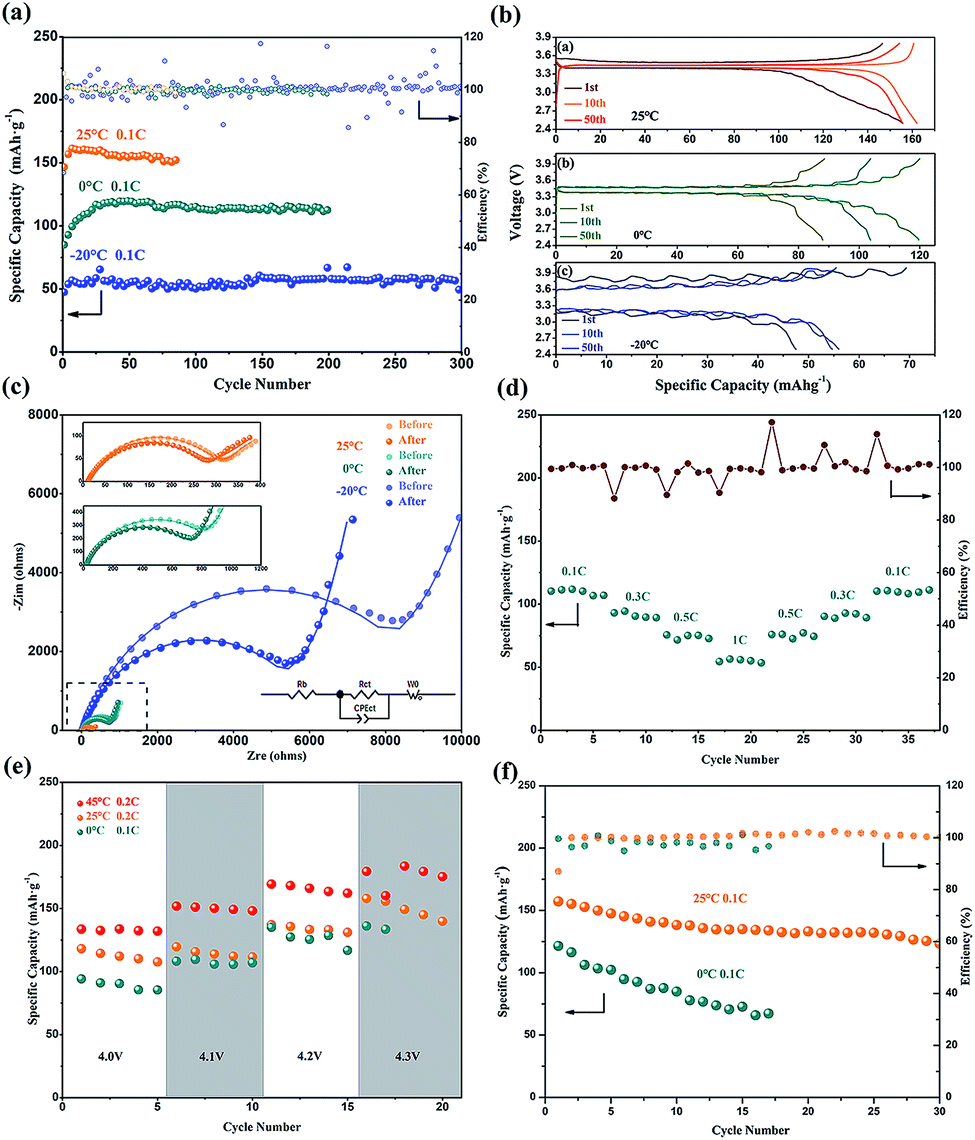 | ||
| Fig. 3 (a) Cycle performance of the LFP/BStSi/Li batteries. (b) The charge and discharge curves of the LFP/BStSi/Li batteries. (c) Comparative AC impedance spectra of the LFP/BStSi/Li batteries before cycling and after 10th cycle. The inset: zoom in the 25 °C and 0 °C spectra and the equivalent circuit. (d) Rate performance of the LFP/BStSi/Li batteries at 0 °C. (e) Cycle performances of the NCM811/BStSi/Li batteries at an increasing charge cut-off voltage of 4–4.3 V and (f) at a constant charge cut-off voltage of 4.2 V. | ||
Furthermore, the battery exhibits appreciable capacity and outstanding cycle life at a lower temperature. The initial discharge capacity is 85 mA h g−1 at 0 °C and 0.1C. It increases gradually in the following cycles and achieves 119.7 mA h g−1 at the 30th cycle. An average discharge capacity of 113.8 ± 5.2 mA h g−1 is obtained during 200 cycles, which last for about 2500 hours. The long cycle life of the battery can be ascribed to the high lithium-ion transfer ability of the electrolyte and compatible interfaces between electrodes and electrolyte. In addition, the cycling test was also conducted in an extremely cold condition of −20 °C. An initial discharge capacity of 47.5 mA h g−1 and an average capacity of 55.9 ± 3.1 mA h g−1 (about 31% of the LFP theoretical specific capacity) are obtained at 0.1C. The charging and discharging curves of 1st, 10th and 50th cycle at 25 °C, 0 °C and −20 °C are found in Fig. 3b. The polarization voltages decrease during cycling, especially, it obviously decreases from 0.69 V (in 1st cycle) to 0.42 V (in 50th cycle) at −20 °C that increases the discharge capacity.
It is worth noting that the initial discharge capacity of the LFP/BStSi/Li battery is relatively lower, but there is a capacity increase in the next 5–30 cycles. To better understand this increase, two AC impedance spectra were measured. The spectra of 25 °C, 0 °C and −20 °C are shown in Fig. 3c, and the data are listed in Table S2.† Both the bulk resistance (Rb) and the charge transfer resistance (Rct) decrease after cycling. Especially at −20 °C, it decreases from 9638 Ω (before) to 6241 Ω (after). This decrease may be attributed to the amelioration of compatibility between electrodes and SPE in the first few cycles, which diminishes the charge transfer resistance at the interface.
For further analysis, the diffusion coefficient of lithium ions in LFP was obtained (see Fig. S10 and Table S2†).17,25 It can be seen that the diffusion coefficient of lithium ions decreases as the temperature declines. The coefficient measured at −20 °C after cycling is even twice as high as that before cycling. Therefore, it can be concluded that the capacity increase can be attributed to both the ameliorative compatibility and the faster conduction of lithium ions at the interface of the electrodes and electrolyte.
Fig. 3d is the rate performance of the LFP/BStSi/Li battery at 0 °C. The average discharge capacities are 109.5 ± 2.1 mA h g−1, 91.3 ± 2.2 mA h g−1, 74.0 ± 1.7 mA h g−1, 55.0 ± 1.1 mA h g−1, 75.1 ± 1.7 mA h g−1, 99.6 ± 1.7 mA h g−1, 109.7 ± 1.0 mA h g−1 for 0.1C, 0.3C, 0.5C, 1C, 0.5C, 0.3C and 0.1C. The discharge capacities are completely restored, showing an excellent rate recovery performance of the battery.
With the advantage of higher voltage, the LiNi0.8Co0.1Mn0.1O2 (NCM811)/BStSi/Li batteries were assembled, and the discharge performance was investigated at 0 °C, 25 °C and 45 °C with an increasing charge cut-off voltage from 4.0–4.3 V. As shown in Fig. 3e, the discharge capacity increases when the voltage increases and reaches 165 ± 3.0 mA h g−1 (45 °C, 0.2C), 134 ± 2.3 mA h g−1 (25 °C, 0.2C) and 126 ± 6.5 mA h g−1 (0 °C, 0.1C) at 4.2 V. But it has overcharging when the voltage rises to 4.3 V. Also, the cycle performance of NCM811/BStSi/Li batteries with a constant voltage range from 2.8–4.2 V at 25 °C and 0 °C are shown in Fig. 3f. The initial discharge capacity at 25 °C is 157.3 mA h g−1 and obtains 123.3 mA h g−1 at the 30 cycle. The initial discharge capacity at 0 °C is 121.3 mA h g−1 but it attenuates in the following cycles. As a contrast, the PEO solid electrolyte was used to assemble the NCM811/PEO SPE/Li battery at 60 °C and 0.1C in Fig. S11† (the PEO-LiTFSI electrolyte can work only above 60 °C). After 4 cycles, the coulombic efficiency drops and the capacity fades. This comparison reveals the BStSi solid electrolyte is more applicable to NCM811 than the PEO-based solid electrolyte.
Conclusions
In summary, we have prepared a starch-based solid electrolyte that can satisfy the requirements of ASSLIB operating in low temperature and higher voltage. Our principle is to create sufficient and orderly –O–C–O-like structure to effectively dissociate the lithium salt and improve the lithium ion transfer capability. We choose starch as a basic material because its monomer is originally equipped with two –O–C–O– bonds as well as three –OH groups that possess an equivalent function for lithium salt dissociation after modification. Through two cross-linking reactions of KH560 and BH3 with starch, the ionic conductivity and the film-forming properties of the solid electrolyte are obviously enhanced. The ASSLIBs demonstrate extraordinary discharge capabilities at RT and 0 °C, even at −20 °C. This work provides a method to solve the current challenges of ASSLIB's and widens their applicable scope.Conflicts of interest
There are no conflicts to declare.Acknowledgements
This work was supported by the Chinese Academy of Engineering (2016-XY-18), the National Natural Science Foundation of China (Grant no. 51274239) and the Foundation of Central South University (CSU) Graduate Student Studying Abroad.Notes and references
- (a) K. Takada, Acta Mater., 2013, 61(3), 759–770 CrossRef CAS; (b) J. Li, C. Ma, M. Chi, C. Liang and N. J. Dudney, Adv. Energy Mater., 2015, 5(4), 1401408 CrossRef; (c) P. G. Balakrishnan, R. Ramesh and T. Prem Kumar, J. Power Sources, 2006, 155(2), 401–414 CrossRef CAS; (d) S. Xin, Y. You, S. Wang, H.-C. Gao, Y.-X. Yin and Y.-G. Guo, ACS Energy Lett., 2017, 2(6), 1385–1394 CrossRef CAS; (e) Y. J. Li, C. Y. Fan, J. P. Zhang and X. L. Wu, Dalton Trans., 2018, 47(42), 14932–14937 RSC; (f) Y. Y. Wang, W. Y. Diao, C. Y. Fan, X. L. Wu and J. P. Zhang, Chem.–Eur. J., 2019, 25(38), 8975–8981 CrossRef CAS.
- (a) X. Chen, W. He, L.-X. Ding, S. Wang and H. Wang, Energy Environ. Sci., 2019, 12(3), 938–944 RSC; (b) W. Zhou, Z. Wang, Y. Pu, Y. Li, S. Xin, X. Li, J. Chen and J. B. Goodenough, Adv. Mater., 2019, 31(4), e1805574 CrossRef; (c) T. Dong, J. Zhang, G. Xu, J. Chai, H. Du, L. Wang, H. Wen, X. Zang, A. Du, Q. Jia, X. Zhou and G. Cui, Energy Environ. Sci., 2018, 11(5), 1197–1203 RSC; (d) J. Lopez, Y. Sun, D. G. Mackanic, M. Lee, A. M. Foudeh, M. S. Song, Y. Cui and Z. Bao, Adv. Mater., 2018, 30(43), e1804142 CrossRef.
- D. E. Fenton, J. M. Parker and P. V. Wright, Polymer, 1973, 14(11), 589 CrossRef CAS.
- (a) Y. Gao, B. Hu, Y. Yao and Q. Chen, Chemistry, 2011, 17(32), 8941–8946 CrossRef CAS; (b) P. V. Wright, Electrochim. Acta, 1998, 43(10–11), 1137–1143 CrossRef CAS; (c) S. Seki, M. A. B. H. Susan, T. Kaneko, H. Tokuda, A. Noda and M. Watanabe, J. Phys. Chem. B, 2005, 109(9), 3886–3892 CrossRef CAS PubMed.
- (a) L. Edman, M. M. Doeff, A. Ferry, J. Kerr and L. C. De Jonghe, J. Phys. Chem. B, 2000, 104(15), 3476–3480 CrossRef CAS; (b) I. Rey, J. L. Bruneel, J. Grondin, L. Servant and J. C. Lassègues, J. Electrochem. Soc., 1998, 145(9), 3034–3042 CrossRef CAS; (c) D. T. Hallinan and N. P. Balsara, Annu. Rev. Mater. Res., 2013, 43(1), 503–525 CrossRef CAS; (d) F. Croce, G. B. Appetecchi and L. Persi, Nature, 1998, 394(6692), 456 CrossRef CAS; (e) O. Buriez, Y. B. Han and J. Hou, et al., J. Power Sources, 2000, 89(2), 149–155 CrossRef CAS.
- (a) Y.-H. Li, X.-L. Wu, J.-H. Kim, S. Xin, J. Su, Y. Yan, J.-S. Lee and Y.-G. Guo, J. Power Sources, 2013, 244, 234–239 CrossRef CAS; (b) X.-L. Wu, Y.-H. Li, N. Wu, S. Xin, J.-H. Kim, Y. Yan, J.-S. Lee and Y.-G. Guo, Solid State Ionics, 2013, 245–246, 1–7 CrossRef CAS.
- (a) C. Yuan, J. Li, P. Han, Y. Lai, Z. Zhang and J. Liu, J. Power Sources, 2013, 240, 653–658 CrossRef CAS; (b) K. Zhu, Y. Liu and J. Liu, RSC Adv., 2014, 4(80), 42278–42284 RSC; (c) Y. Lin, X. Wang, J. Liu and J. D. Miller, Nano Energy, 2017, 31, 478–485 CrossRef CAS.
- (a) A. Imberty, A. Buléon, V. Tran and S. Péerez, Starch-Stärke, 1991, 43(10), 375–384 CrossRef CAS; (b) Y. Takeda, T. Shitaozono and S. Hizukuri, Starch-Stärke, 1988, 40(2), 51–54 CrossRef CAS.
- G. Lammers, E. J. Stamhuis and A. A. Beenackers, Ind. Eng. Chem. Res., 1993, 32(5), 835–842 CrossRef CAS.
- K. Liao, S. Wu and X. Mu, et al., Adv. Mater., 2018, 30(36), 1705711 CrossRef.
- (a) P. Han, Y. Zhu and J. Liu, J. Power Sources, 2015, 284, 459–465 CrossRef CAS; (b) Y. Lin, J. Li, K. Liu, Y. Liu, J. Liu and X. Wang, Green Chem., 2016, 18(13), 3796–3803 RSC.
- O. Borodin and G. D. Smith, Macromolecules, 2006, 39(4), 1620–1629 CrossRef CAS.
- H. Tobita and A. E. Hamielec, Polymer, 1990, 31(8), 1546–1552 CrossRef CAS.
- H. S. Lee, X. Q. Yang and C. L. Xiang, et al., J. Electrochem. Soc., 1998, 145(8), 2813–2818 CrossRef CAS.
- J. Xu, J. Li, Y. Zhu, K. Zhu, Y. Liu and J. Liu, RSC Adv., 2016, 6(24), 20343–20348 RSC.
- J. Evans, C. A. Vincent and P. G. Bruce, Polymer, 1987, 28(13), 2324–2328 CrossRef CAS.
- H. Liu, C. Li, H. P. Zhang, L. J. Fu, Y. P. Wu and H. Q. Wu, J. Power Sources, 2006, 159(1), 717–720 CrossRef CAS.
- X. Wang, H. Hao, J. Liu, T. Huang and A. Yu, Electrochim. Acta, 2011, 56(11), 4065–4069 CrossRef CAS.
- (a) E. Lippmaa, M. Maegi, A. Samoson, G. Engelhardt and A. R. Grimmer, J. Am. Chem. Soc., 1980, 102(15), 4889–4893 CrossRef CAS; (b) V. F. F. Barbosa, K. J. D. MacKenzie and C. Thaumaturgo, Int. J. Inorg. Mater., 2000, 2(4), 309–317 CrossRef CAS.
- R. Dupree, D. Holland, P. W. McMillan and R. F. Pettifer, J. Non-Cryst. Solids, 1984, 68(2–3), 399–410 CrossRef CAS.
- P. J. Bray, Inorg. Chim. Acta, 1999, 289(1–2), 158–173 CrossRef CAS.
- S. Hermanek, Chem. Rev., 1992, 11(2), 325–362 CrossRef.
- A. Munar, A. Andrio, R. Iserte and V. Compañ, J. Non-Cryst. Solids, 2011, 357(16–17), 3064–3069 CrossRef CAS.
- Z. Stoeva, I. Martin-Litas, E. Staunton, Y. G. Andreev and P. G. Bruce, J. Am. Chem. Soc., 2003, 125(15), 4619–4626 CrossRef CAS.
- A. J. Bard, L. R. Faulkner, J. Leddy and C. G. Zoski, Electrochemical methods: fundamentals and applications, Wiley, New York, 1980, vol. 2 Search PubMed.
Footnote |
| † Electronic supplementary information (ESI) available: Detailed description of materials, preparation, experimental methods and additional data including figures and tables. See DOI: 10.1039/c9ra07781b |
| This journal is © The Royal Society of Chemistry 2019 |