DOI:
10.1039/C9RA07042G
(Paper)
RSC Adv., 2019,
9, 34102-34113
Tinospora cordifolia derived biomass functionalized ZnO particles for effective removal of lead(II), iron(III), phosphate and arsenic(III) from water†
Received
3rd September 2019
, Accepted 15th October 2019
First published on 24th October 2019
Abstract
Owing to the vast diversity in functional groups and cost effectiveness, biomass can be used for various applications. In the present study, biomass from Tinospora cordifolia (TnC) was prepared and grafted onto the surface of ZnO particles following a simple method. The TnC functionalized ZnO particles (ZnO@TnC) were characterized and exhibited excellent adsorption properties towards Pb2+ (506 mg g−1), Fe3+ (358 mg g−1) and PO43− (1606 mg g−1) and the Fe3+ adsorbed ZnO@TnC adsorbs AsO21− (189 mg g−1); the metal ions and anions were analyzed by ICP and IC. For reuse of ZnO@TnC, a desorption study was successfully carried out using NaOH and EDTA for PO43− and Pb2+, respectively; Fe3+ was further used for adsorption of As(III). The adsorption fits well with the Langmuir adsorption isotherm model and the adsorption kinetic data are best fitted with a pseudo-second-order equation. The system developed may be useful for treatment of waste water and industrial effluents.
1. Introduction
The unavailability of safe drinking water is one of the major threats to all living species due to the globally polluted environment.1,2 Toxic heavy metal ion and anion disposal through industrial, mining and agriculture processes is the major reason for the increasing pollution in air, soil and water.3,4 Heavy metal ions such as Pb2+, Hg2+ and AsO21− are highly toxic to humans and many other living species even at a very low concentration.5–7 Lead-acid batteries are highly used for various purposes including in motor vehicles and a recent study suggested that 82% of the global lead consumption is due to lead batteries, which is a major source of lead pollution in the environment.8,9 Consumption of Pb2+ can damage kidneys and severely affect the neurological system.10,11 Arsenic is another highly toxic ion, the anthropogenic source of its pollution is the metal smelting and coal combustion.12 Other reasons for arsenic pollution are wood preservation, waste incineration and volcanic emission.13 Its consumption by human being causes heart disease and cancer of lung, liver, skin and kidney.14 Iron is an essential metal ion for human body, however above a certain concentration it becomes harmful. It catalyzes formation of reactive oxygen species (ROS), which used to damage nucleic acid and lipid causing Huntington's and Parkinson's diseases.15 Iron contamination in water is mainly due to its presence in earth crust and other than this natural source, industries of mining and steel are significantly contributing to iron contamination in environment.4,16 In human body, many intracellular pathways use phosphate ion for important cellular reactions, therefore, control of phosphate is one of the most critical biological regulations. Improper phosphate balance can affect the functionality of almost every human system and can cause kidney disorder, bone problems, weakness and fatigue.17 Phosphate is key ingredient in fertilizers and above significant concentration can cause algal growth which have significant health and economic hazards. One main example is Microcystis algae, which produces microcystin that is lethal to both human as well as aquatic life.18
For removal of the above mentioned metal ions and anions, different techniques used are reverse osmosis, ion exchange, solvent extraction, electrochemical methods etc.19–22 ZnO is a biocompatible material and because of its unique physical and chemical properties, it has been used for multifunctional purposes. In the area of separation science, it has been used as an adsorbent for removal of hazardous compound such as H2S,23 heavy metal ions etc.24 ZnO particles are available with various size and shape, its surface can also be modified with different coating agent to make it functional material and it has been used for removal of metal ions such as Cu2+, Pb2+ etc.25,26 By proper choice of surface modifying agents, the performance of ZnO can be enhanced in terms of adsorption capacity and selectivity towards specific ions/molecules.
With the aim to develop cost effective materials for removal of toxic metal ions and anions from waste/polluted water for its possible recycle, ZnO particles were prepared and the surface of the particles were decorated with the biomass of Tinospora cordifolia (ZnO@TnC). Tinospora cordifolia (TnC) is a shrub from the Menispermaceae family, mainly available in the tropical areas, it contains various alkaloids, terpenoids and phenolic compounds having functional groups such as hydroxyl (–OH), carbonyl (–C![[double bond, length as m-dash]](https://www.rsc.org/images/entities/char_e001.gif) O) etc., which can effectively interact with metal ions.27 This functional material (ZnO@TnC) exhibited high adsorption capacity towards the metal ions such as Pb2+, Fe3+, AsO21− and anion like PO43− in aqueous media. This material can be reused for several time in the case of lead and phosphate, while in the case of iron, it was reused for adsorption of arsenic from waste water. Herein we report preparation of ZnO based biomass decorated functional material, its characterization, metal ion adsorption property and its reusability.
O) etc., which can effectively interact with metal ions.27 This functional material (ZnO@TnC) exhibited high adsorption capacity towards the metal ions such as Pb2+, Fe3+, AsO21− and anion like PO43− in aqueous media. This material can be reused for several time in the case of lead and phosphate, while in the case of iron, it was reused for adsorption of arsenic from waste water. Herein we report preparation of ZnO based biomass decorated functional material, its characterization, metal ion adsorption property and its reusability.
2. Material and methods
2.1. Materials
Zn(NO3)2·6H2O was purchased from Alfa Aesar Chemical Company. NH2–NH2·H2O was purchased from TCI chemical company. Lead chloride (PbCl2), potassium phosphate monobasic (KH2PO4), sodium(meta)arsenite (AsNaO2), iron chloride (FeCl3) were purchased from Sigma Aldrich. Tinospora cordifolia (TnC) was collected from Bhavnagar (GPS location: lat. – 21.746746 and long. – 72.14018), Gujarat, India. Synthesis and other study was carried out in double distilled water. All chemicals were used without any further purification.
2.2. Instrumentation
Powder XRD was recorded on a PANalytical Empyrean (PIXcel 3D detector) instrument using Cu Kα (λ = 0.15406 nm) radiation, operated at 40 kV in the 2θ range of 5° to 80°. FT-IR spectra were recorded on a PerkinElmer instrument, model Spectrum GX, as KBr pellet. Scanning Electron Microscopy (SEM) images were recorded on a JEOL, model JSM 7100F FE-SEM instrument. EDX data was recorded on the Oxford Instrument X-Maxn model. Metal ion analysis was carried out on an ICP-OES instrument from PerkinElmer, model Optima 2000. Ion chromatographic analysis was carried out on a Dionex ICS-5000 + DC model of Thermo Fischer for anions.
2.3. Synthesis of Zn(OH)2 particles
Zn(NO3)2·6H2O (2.3 g, 20 mM) was dissolved in 400 mL of double distilled water. In another 400 mL of water, hydrazine hydrate (1.5 mL, 80 mM) was dissolved. Solution of hydrazine hydrate was then added into the solution of Zn(NO3)2·6H2O and the reaction mixture was stirred for 4 h at room temperature. The solution was clear at the beginning; however, formation of white precipitates was observed after 10–15 minutes. Solution was allowed to settle for 1 h after completion of stirring for 4 h and then the clear water from the top was decanted. The remaining solution with solid was then centrifuged at 8000 rpm for 15 minutes. The white precipitate thus separated was isolated, washed with double distilled water (100 mL) for 3 times to remove any excess or unreacted reactants. It was then allowed to dry under vacuum for overnight. The white compound (Zn(OH)2) was characterized by Powder-XRD analysis.
2.4. Preparation of Tinospora cordifolia (TnC) powder
Leaves and skin of TnC were removed manually. Then it was chopped into small pieces and dried at 65 °C for 6 hours. The dried material was crushed by mortar and pestle. The resultant powder was then washed with 0.1 N HCL (100 mL) to remove any existing metal ion and impurities. After acid wash, powder was washed with plenty of water. The powder was characterized by IR and Powder-XRD analysis and was further used for surface modification of ZnO particles.
2.5. Preparation of ZnO@TnC particles
TnC powder (4 g) and Zn(OH)2 (1 g), prepared as described above, are mixed well in a crucible and the reaction mixture was heated at 400 °C for 4 h in a muffle furnace. Zn(OH)2 particles at high temperature was converted to ZnO particles due to calcination. After completion of heating, the dark gray colored crystalline mass was obtained, which was then allowed to cool to room temperature, which yielded microcrystals of ZnO@TnC. The compound was then characterized on the basis of IR, Powder-XRD and SEM analysis and was used for removal of metal ions.
2.6. Adsorption study with metal ions and anions
Adsorption of various metal ions such as Li+, Na+, K+, Ca2+, Mg2+, Mn2+, Fe3+, Co2+, Ni2+, Cu2+, Hg2+, Pb2+, Cd2+ and anions such as AsO21−, Cr2O72−, CN−, F−, PO43− were investigated using ZnO@TnC material. For this purpose, stock solutions of 10 ppm concentration of each metal ion from its respective chloride salt and of each anion from its respective sodium salt were prepared in 100 mL volumetric flask. In a typical experimental procedure, 10 mg of ZnO@TnC was stirred with 100 mL of stock solution of each metal ion and anion at 750 rpm for 6 h. Concentration of metal ions and anions were investigated in samples collected before and after adsorption by inductively coupled plasma (ICP) and ion chromatography (IC).
2.7. Metal ion removal study
The metal ion removal study was carried out at room temperature and at normal pH of Mili-Q water (6.8 ± 0.2) unless otherwise stated. Stock solution of 10, 50 and 100 ppm concentration of Pb2+, PO43− and Fe3+ was prepared by dissolving required amount of PbCl2, KH2PO4 and FeCl3 in double distilled water, respectively. In a typical experiment, 10 mg of ZnO@TnC was dispersed into 50 mL of individual stock solution of metal ions and anions of 10, 50 and 100 ppm concentration with stirring at 750 rpm for 6 h. Aqueous samples of 500 μL were collected at regular time interval of 60 minutes by micro pipette and metal ion and anion concentration in the samples were analyzed by ICP and IC, respectively. The ion adsorption capacity of ZnO@TnC was then calculated using the following eqn (1).28| |
 | (1) |
where qe = quantity of metal ion/anion adsorbed on the adsorbent at the time of equilibrium (mg g−1), C0 = initial concentration of metal ion/anions in aqueous solution (mg L−1), Ce = final concentration of metal ion/anion in aqueous solution at the time t, (mg L−1), V = volume of the solution (L) and m = mass of adsorbents (g).
2.8. pH effect study
Adsorption of metal ions and anions by ZnO@TnC was studied at different pH in the range of 2 to 12. The solutions of that pH range were prepared by adjusting the pH using HCl and NaOH in double distilled water. Stock solution of Pb2+, PO43− and Fe3+ were prepared of 100 ppm concentration at different pH. In a typical procedure, ZnO@TnC (10 mg) was treated with 50 mL of the stock solution of metal ions and anion with stirring at 750 rpm for 6 h. Aqueous samples (10 mL) were collected from the solutions after 6 h of stirring and analyzed by ICP and IC, as described above.
2.9. Competitive adsorption study
Adsorption capacity of ZnO@TnC towards Pb2+, PO43− and Fe3+ in the same solution was also studied. A single stock solution containing all of these metal ions and anion was prepared with 100 ppm concentration of each ion in double distilled water. This stock solution (50 mL) containing mixture of ions was treated with 50 mg of ZnO@TnC following the procedure described in the Section 2.8. From the reaction mixture, 10 mL of sample was collected after 6 h of stirring and analyzed by ICP and IC, following the method described above.
2.10. Reusability of ZnO@TnC
Possible recycling of ZnO@TnC was examined by desorption experiment for ions adsorbed into ZnO@TnC. Stock solutions of Pb2+, PO43− and Fe3+ were prepared of 500 ppm concentration in double distilled water. Then 20 mg of ZnO@TnC for each metal ion and was added into the stock solution (20 mL) of Pb2+, PO43− and Fe3+ separately, stirred for 6 h (750 rpm) in a conical flask, and then centrifuged at 8000 rpm for 15 minutes. Supernatant liquid was analyzed by ICP and IC to determine the amount of metal ions and anion not adsorbed and ZnO@TnC particles with adsorbed ions were collected and dried in vacuum for overnight. Desorption of PO43− from ZnO@TnC material was carried out with the aid of NaOH. The dried ZnO@TnC containing PO43− was stirred with 50 mL of 1.0 mol L−1 NaOH solution for 1 h at 750 rpm. The resulting solution after stirring was centrifuged for 15 minutes at 8000 rpm and supernatant was collected and analyzed with ion chromatography (IC). The solid ZnO@TnC mass settled after centrifuge was then treated with 0.1 N HCl, washed with water (50 mL) and then reused for the adsorption of phosphate (PO43−). In case of Pb2+, desorption experiment was carried out with the aid of EDTA. Pb2+ adsorbed ZnO@TnC particles were dispersed in 50 mL of 1.0 mol L−1 EDTA solution and stirred for 1 h at 750 rpm. The resultant solution was then centrifuged for 10 minutes at 8000 rpm and supernatant was analyzed by ICP for Pb2+. The settled ZnO@TnC particles were then washed with water (50 mL) and reused for the adsorption of Pb2+ in aqueous media. Desorption of iron (Fe3+) from the iron adsorbed ZnO@TnC particles was not successful, however the same was further used for the adsorption of AsO21− in aqueous media.
2.11. Synthesis of Fe–ZnO@TnC and its use for removal of AsO21-
Fe3+ adsorbed ZnO@TnC particles were synthesized by stirring 100 mg of ZnO@TnC with 1000 ppm solution of Fe3+ at 750 rpm for 6 h followed by centrifugation at 7000 rpm for 10 minutes, the separated particles were then dried for overnight in vacuum. The Fe3+ adsorbed ZnO@TnC (Fe–ZnO@TnC) particles (10 mg) were then dispersed into solutions (50 mL) containing AsO21− of 10, 50 and 100 ppm and stirred at 750 rpm for 6 h. An aliquot of 500 μL from the solution was collected by micro pipette at a regular interval of 1 h and was analyzed by ion chromatography (IC) to determine the concentration of AsO21− in the solution and thereby amount of AsO21− adsorbed till the maximum adsorption was achieved. The eqn (1), as written above, was then used to calculate AsO21− adsorption capacity of Fe–ZnO@TnC material.
2.12. AsO21− adsorption at different pH
Adsorption of AsO21− by Fe–ZnO@TnC was studied at different pH in the range 2 to 12. Solutions of AsO21− of 100 ppm was prepared with different pH in the range 2 to 12. The solution of AsO21− (50 mL) of a particular pH was stirred with Fe–ZnO@TnC (10 mg) at 750 rpm for 6 h, then 10 mL of the solution was taken and analyzed for AsO21− by ion chromatography (IC).
2.13. Adsorption isotherm study
Langmuir and Freundlich adsorption isotherm of ZnO@TnC and Fe–ZnO@TnC were studied. For this purpose, solutions of Pb2+, Fe3+, AsO21− and PO43− of concentration ranging from 10 to 100 ppm were prepared from the respective salts in double distilled water. ZnO@TnC and Fe–ZnO@TnC of 10 mg each were added into the solution of metal ion (50 mL) separately and was stirred for 6 h at 750 rpm. A sample of 10 mL was then collected from the mixture and analyzed for the metal ion/anion by ICP/IC to calculate adsorbed amount of metal ion/anion. The results obtained were then fitted in the equation of Langmuir and Freundlich adsorption isotherm.
3. Results and discussion
3.1. Preparation and characterization of ZnO@TnC particles
The preparation of ZnO@TnC is described in the Experimental section and a schematic presentation is shown in Scheme 1.
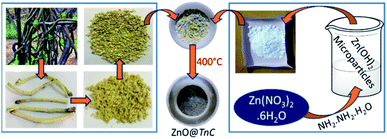 |
| | Scheme 1 Schematic presentation of the stepwise synthesis of ZnO@TnC particles. | |
In the calcination process at 400 °C, Zn(OH)2 was converted to ZnO particle, surface of which was modified by TnC forming ZnO@TnC as crystalline material. This new material was characterized on the basis of powder-XRD, IR, SEM and EDX analysis. The Powder-X-ray diffractogram of the ZnO@TnC along with TnC and Zn(OH)2 are shown in Fig. 1, which clearly shows that the diffractogram of ZnO@TnC is distinctly different from that of Zn(OH)2 and TnC and there is no unreacted Zn(OH)2 in the TnC containing new material.
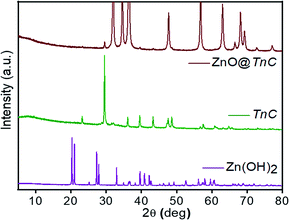 |
| | Fig. 1 Powder X-ray diffractograms of Zn(OH)2 (purple color), biomass of Tinospora cordifolia (green color) and ZnO@TnC particles (brown color). | |
The characteristic 2θ peaks for Zn(OH)2 observed at 20.26°, 20.99, 25.13°, 27.29°, 27.87°, 32.94°, 39.60°, 40.86° and 42.20°, which are correspond to the orthorhombic zinc hydroxide (Fig. 1, JCPDS No: 01-089-0138)29 are disappeared in the diffractogram of ZnO@TnC. The new 2θ peaks noted at 31.83°, 34.70°, 36.46°, 47.73°, 56.75°, 63.01°, 66.54°, 68.12° and 69.27° are correspond to ZnO (Fig. 1, JCPDS file no: 01-089-1397),29 that confirmed the conversion of Zn(OH)2 to ZnO. The 2θ peaks observed for TnC at 23.18°, 29.50, 36.10°, 39.53°, 43.28°, 47.58°, 48.61°, 57.51° and 60.79° (Fig. 1) are almost disappeared or shifted in the diffractogram observed for ZnO@TnC, indicating that the added TnC is consumed for functionalization of the surface of the ZnO particles and almost nothing is left free contaminating the functionalized composite material (ZnO@TnC). The IR spectra of TnC and that of ZnO@TnC are displayed in Fig. S1 (ESI),† the TnC exhibits IR bands at 3450, 1633, 1435 and 1076 cm−1, which are due to –OH, carbonyl group, carboxyl stretching and asymmetric stretching of carboxyl group.30 The IR spectrum of ZnO@TnC exhibits similar bands with slight shift in position at 3425, 1627, 1457 and 1093 cm−1; with decrease in the intensity of bands at 1457 and 1093 cm−1 confirming functionalization of TnC over ZnO particles. The bands were shifted due to interaction of the functional groups with the ZnO particles. The IR data therefore, suggest the presence of TnC in the crystals of ZnO@TnC and probably anchoring through the surface of the particles took place through the carboxylic groups, as its band intensity and position affected significantly due to surface modification by TnC. The crystallite size of ZnO and ZnO@TnC was calculated following the literature procedure31 and the results showed that the crystallite size of ZnO before and after functionalization are 236.022 and 295.021 nm, respectively, it is increased significantly confirming the functionalization. The modification of the surface of ZnO is also evident from SEM images and EDX analysis. The FE-SEM images of ZnO, before and after coating with TnC, and EDX analysis of the ZnO@TnC are shown in Fig. 2. ZnO for SEM image was prepared from Zn(OH)2 by calcination in a muffle furnace by heating at 400 °C for 4 h, the XRD data of which was matched with literature values (JCPDS No: 01-089-1397).
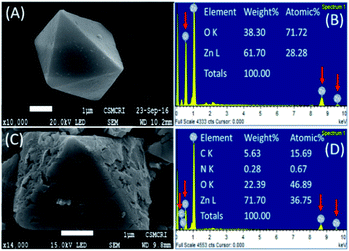 |
| | Fig. 2 SEM images of ZnO particles (A), ZnO@TnC particles (C) and their EDX spectra respectively (B and D). Enlarged SEM images with recording parameters is submitted as ESI (S9).† | |
The changes on the surface of the particles after anchoring of TnC is clearly seen in Fig. 2C comparing it with the surface without modification (Fig. 2A). The EDX analysis of ZnO and that of ZnO@TnC, shown in Fig. 2B and D, show the presence of carbon, nitrogen and high percentage of oxygen in ZnO@TnC compared to ZnO, confirming the presence of TnC in ZnO@TnC.
3.2. Adsorption property of ZnO@TnC towards metal ions and anions
Adsorption property of ZnO@TnC was investigated towards the metal ions Li+, Na+, K+, Mg2+, Mn2+, Fe3+, Co2+, Ni2+, Cu2+, Hg2+, Pb2+, Cd2+ and anions AsO21−, Cr2O72−, CN−, F−, PO43− following the methods described in the Experimental section.
Bar diagram plotting the concentration of various metal ions and anions before and after adsorption is depicted in Fig. 3, which exhibited that the metal ions Fe3+ and Pb2+ and the anions PO43− are absorbed almost the entire amount used in the experiment. Further, the Fe3+ adsorbed ZnO@TnC material (Fe–ZnO@TnC) was used for adsorption of AsO21− from aqueous solution following the method described in the experimental section, and the concentration of AsO21− measured before and after adsorption by IC is shown in Fig. S2 (ESI),† which clearly suggested substantial adsorption of AsO21−. The presence of Fe3+, Pb2+ and PO43− in ZnO@TnC and AsO21− in Fe–ZnO@TnC were confirmed with the aid of PXRD, IR spectroscopy and SEM microscopy, as described below.
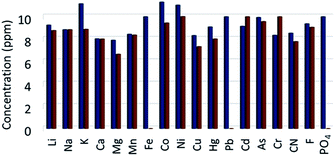 |
| | Fig. 3 Bar diagram showing concentration of different metal ions and anions before adsorption (blue bars) and after adsorption by ZnO@TnC particles (brown bars). (Oxidation state of metal ions are omitted for clarity; all metal ions are in “2+” oxidation state except iron (Fe) and Arsenic (As), which are in “3+” and chromium is in “6+” oxidation state). | |
3.3. Characterization of adsorbed ions
The adsorption of metal ions and anions on to the surface of the ZnO@TnC was confirmed on the basis of PXRD, IR and SEM analysis of the isolated ion adsorbed species of ZnO@TnC. Each of these ion adsorbed species were obtained following the procedure described in the Experimental section. The powder X-ray diffractograms of the ion adsorbed ZnO@TnC materials are shown in Fig. 4.
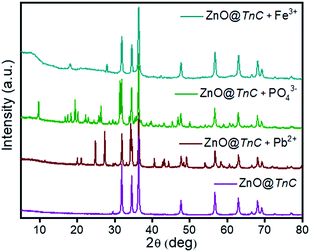 |
| | Fig. 4 XRD spectral analysis of ZnO@TnC (purple color) and that after adsorption of Pb2+ (brown color), PO43− (green color) and Fe3+ (dark cyan color). | |
It may be noted that there are substantial changes in the diffractograms compared to that of ZnO@TnC after adsorption of metal ions/anions. However, the peaks observed in pure ZnO@TnC are noted as it is in all the diffractograms, the additional peaks are due to Pb2+/Fe3+/PO43− adsorbed species of ZnO@TnC. In the case of AsO21−, probably after its interaction with Fe–ZnO@TnC, its crystallinity is lost and amorphous product is formed, as evident from the X-ray diffractogram, Fig. S3 (ESI).† The interaction of metal ion/anion with ZnO@TnC is also investigated by IR spectroscopy, shown in Fig. 5.
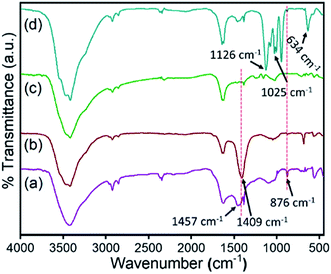 |
| | Fig. 5 IR spectra of the ZnO@TnC (a) and that after adsorption of Pb2+ (b), Fe3+ (c) and PO43− (d). | |
In Fig. 5, it may be noted that there is significant change in band position and band intensity in the region 1700–500 cm−1 and around 3500 cm−1 for all of the ion bound ZnO@TnC compared to the mother compound. Prominent changes are noted in the regions 1700–1400 cm−1 and 3400–3500 cm−1, which are due to carbonyl/carboxylic acid groups and OH/NH groups, respectively, which suggest that the ions interacted with ZnO@TnC through the C![[double bond, length as m-dash]](https://www.rsc.org/images/entities/char_e001.gif) O/COOH and OH/NH functional groups of TnC embedded onto the surface of the ZnO particles. The IR spectrum of the AsO21− bound Fe–ZnO@TnC, shown in Fig. S4 (ESI),† also showed significant change compared to its mother compound in the finger print region confirming the interaction of AsO21− with Fe–ZnO@TnC. The morphology of the ion adsorbed ZnO@TnC is investigated by FE-SEM and the presence of ions (Pb2+/Fe3+/PO43−) in it is confirmed by EDX analysis. The FE-SEM images and the EDX analysis of all the ion adsorbed ZnO@TnC are shown in Fig. 6. It may be noted that on adsorption of ion, the morphology of ZnO@TnC has changed substantially and the EDX data show the presence of respective metal ion/element (P of phosphate ion). Therefore, PXRD, IR, FE-SEM and EDX analysis have confirmed the adsorption of ions by ZnO@TnC.
O/COOH and OH/NH functional groups of TnC embedded onto the surface of the ZnO particles. The IR spectrum of the AsO21− bound Fe–ZnO@TnC, shown in Fig. S4 (ESI),† also showed significant change compared to its mother compound in the finger print region confirming the interaction of AsO21− with Fe–ZnO@TnC. The morphology of the ion adsorbed ZnO@TnC is investigated by FE-SEM and the presence of ions (Pb2+/Fe3+/PO43−) in it is confirmed by EDX analysis. The FE-SEM images and the EDX analysis of all the ion adsorbed ZnO@TnC are shown in Fig. 6. It may be noted that on adsorption of ion, the morphology of ZnO@TnC has changed substantially and the EDX data show the presence of respective metal ion/element (P of phosphate ion). Therefore, PXRD, IR, FE-SEM and EDX analysis have confirmed the adsorption of ions by ZnO@TnC.
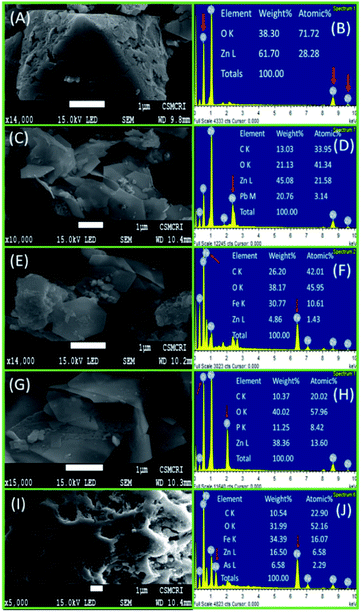 |
| | Fig. 6 SEM images along with EDX spectra of (A and B) ZnO@TnC particles after adsorption of (C and D) Pb2+, (E and F) Fe3+, (G and H) PO43− and (I and J) AsO21− adsorbed Fe–ZnO@TnC. Enlarged SEM images with recording parameters is submitted as ESI (S9).† | |
3.4. Removal of metal ions and anion and their quantification
The ZnO@TnC particles were used for adsorption of Pb2+, Fe3+ and PO43− and Fe–ZnO@TnC was used for adsorption of AsO21− in aqueous media at different concentration of metal ions/anions.
Details of the procedure is given in the Experimental section and the plot of amount of metal ion/anion adsorbed as a function of time at different concentrations are shown in Fig. 7. It is observed that in the case of Pb2+ and Fe3+, saturation of adsorption is reached by 180 minutes, while in the case of PO43− and AsO21−, saturation was observed after 240 and 360 minutes, respectively. The adsorption capacity of Pb2+, Fe3+, PO43−, calculated by using eqn (1), was found to be 506.1 mg g−1, 358 mg g−1 and 1606 mg g−1, respectively and the same for AsO21− was to be 189 mg g−1. The adsorption capacities thus obtained were compared with that of a number of recently published systems, functionalized with various materials (Table 1) and it is noted that the data obtained by the present study are comparable and in many cases better than the reported values. Apparently, the removal capacity obtained for PO43− by present study is one of the highest among the reported values. The experimental data thus obtained was further used to determine kinetics and adsorption isotherm model.
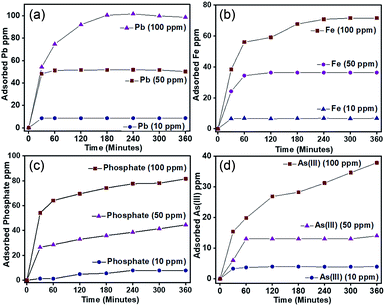 |
| | Fig. 7 Kinetic study of ions (a) Pb2+, (b) Fe3+, (c) PO43− and (d) AsO21− at their initial concentration of 10, 50 and 100 ppm with time. | |
Table 1 Comparison of different previously reported tool and their adsorption capacity towards Pb2+, Fe3+, PO43− and AsO21− in aqueous media
| Material used |
Adsorption capacity (mg g−1) |
Ref. |
| Pb2+ |
Fe3+ |
AsO21− |
PO43− |
| Saraca indica leaf powder |
1.19 |
— |
— |
— |
32 |
| Titanate/Fe3O4 nano |
382.3 |
— |
— |
— |
33 |
| Poly(ethyleneimine) nano rod |
240 |
— |
— |
— |
34 |
| Nano vaterite poly(ethyleneimine) |
2762 |
— |
— |
— |
35 |
| MFe2O4 (M = Mn, Co)–MoS2–carbon dot |
588.2 |
— |
— |
— |
36 |
| ZnO/MMT nanocomposite |
88.50 |
— |
— |
— |
37 |
| Fly ash |
— |
— |
— |
42.5 |
38 |
| Magnetic cellulose |
— |
— |
— |
22.2 |
39 |
| Biomass based Zr(OH)4 |
— |
— |
— |
31.9 |
40 |
| Biochar (Mg-enriched tomato tissues) |
— |
— |
— |
>100 |
41 |
| Mesoporous silica |
— |
— |
— |
43.3 |
42 |
| Ferric sludge |
— |
— |
— |
30 |
43 |
| Natural zeolite |
— |
1.15 |
— |
— |
44 |
| Natural smectite clay |
— |
12.8 |
— |
— |
45 |
| Vegetable biomass |
— |
3.5 |
— |
— |
46 |
| Activated carbon |
— |
3.60 |
— |
— |
47 |
| Nano zero-valent iron |
— |
— |
3.5 |
— |
48 |
| Fe/Cu nanoparticles |
— |
— |
19.6 |
— |
49 |
| Magnetic Fe3O4 nano |
— |
— |
19.6 |
— |
50 |
| (Sn0.95Fe0.05O2−δ)@GO |
— |
— |
105 |
— |
51 |
| Nano cellulose |
— |
— |
51 |
— |
52 |
| ZnO@TnC particles |
506.1 |
358 |
189 |
1606 |
This study |
3.5. Adsorption isotherm of ZnO@TnC
To evaluate the adsorption efficiency of ZnO@TnC towards Pb2+, Fe3+, PO43− and of Fe–ZnO@TnC towards AsO21−, the experimental data was fitted with classical Langmuir isotherm and Freundlich isotherm models. According to the Langmuir model, most of the adsorption occurs on the surface of the adsorbent and migration of adsorbate molecules do not occur. Mathematically, Langmuir isotherm can be expressed by the following equation.53
Langmuir isotherm
| |
 | (2) |
where “
qe” is the quantity of the adsorbed adsorbate at the time of equilibrium, “
Ce” is the concentration of adsorbate remained at the time of equilibrium, “
Qm” is the quantity of adsorbate adsorbed on the adsorbent at saturation point and “
KL” is Langmuir constant. The above Langmuir isotherm can be rewritten in the following way and the plot 1/
qe Vs 1/
Ce is expected to be linear.
| |
 | (3) |
An essential characteristic of the Langmuir adsorption isotherm can be expressed by dimensionless factor, also called equilibrium parameter (RL), which can be calculated using the following eqn (4).54
| |
 | (4) |
where
KL is the Langmuir constant and
C0 is the initial concentration of the analyte. If the
RL values is 0 < 1 then the Langmuir adsorption is favorable and if
RL > 1, then the adsorption is unfavorable.
Freundlich adsorption isotherm is mainly describe multilayer adsorption in liquid to solid phase. Freundlich isotherm can be expressed in the following way.53
Freundlich isotherm
| |
 | (5) |
where “
qe” and “
Ce” terms are same as described in Langmuir equation, “
Kf” is the Freundlich constant and “
n” is the Freundlich exponent which is related to the heterogeneity of the surface of adsorbent. The simplified form of the above equation can be rewritten as below.
| |
 | (6) |
The experimental adsorption data were fitted in the eqn (3) and (5) and the plot of Langmuir and Freundlich adsorption isotherms for metal ions and anion are shown in Fig. 8 and S5 (ESI),† respectively. The dimensionless factor (RL) is calculated using the eqn (4) and all the calculated parameters and the correlation coefficient (R2) values obtained from the plot are summarized in Table 2. The RL values obtained is 0 < 1, which suggests that the Langmuir adsorption is favorable. Schematic presentation of monolayer adsorption of Pb2+ and Fe3+ is shown in the Scheme 2a. Higher value of Freundlich adsorption exponent “n”, which is equal to or greater than 1, suggests that adsorption is favorable on surface of the particles.55 It may be noted that the adsorption isotherm study with different ions were carried out with the solutions of concentrations 10, 50 and 100 ppm and the adsorption capacity thus obtained has given in Table 1. However, it was noted that in case of Pb2+ and PO43−, the saturation point was not achieved with 100 ppm solution, therefore to examine the maximum adsorption capacity, experiment was repeated with 1000 ppm solution for these two ions and the data obtained is presented in Table 2. To maintain uniformity, the adsorption capacity data for all the ions with 100 ppm solution has given in Table 1.
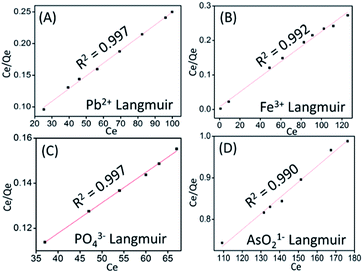 |
| | Fig. 8 Plot of Ce/Qe Vs Ce representing linearized form of Langmuir adsorption isotherm of (A) Pb2+ (B), Fe3+ (C) PO43− and (D) AsO21−. | |
Table 2 Langmuir and Freundlich adsorption isotherm model parameters for Pb2+, Fe3+, PO43− and AsO21− adsorption by ZnO@TnC particles
| Metal ions |
Langmuir adsorption isotherm |
Freundlich adsorption isotherm |
| KL |
Qm |
RL |
R2 |
KF |
n |
R2 |
| Pb2+ |
0.042 |
497.51 |
0.15 |
0.997 |
3.68 |
2.72 |
0.924 |
| Fe3+ |
0.302 |
456.62 |
0.02 |
0.992 |
4.99 |
6.10 |
0.906 |
| PO43− |
0.021 |
740.74 |
0.29 |
0.997 |
1.60 |
0.90 |
0.988 |
| AsO21− |
0.011 |
262.46 |
0.31 |
0.990 |
0.06 |
0.33 |
0.977 |
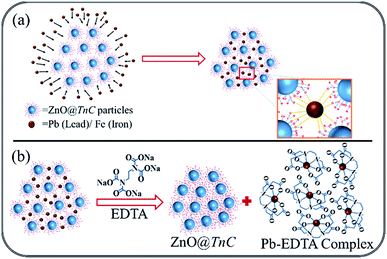 |
| | Scheme 2 Schematic presentation of (a) monolayer adsorption of Pb2+ and Fe3+ by ZnO@TnC particles and (b) regeneration of ZnO@TnC particles by desorption of Pb2+ after treatment with EDTA. | |
3.6. Adsorption kinetics
For insight of mechanistic aspects, kinetics of the adsorption process was also carried out, experimental procedure for which is described in the Experimental section. For this purpose, two semi empirical kinetic models (i) pseudo-first-order and (ii) pseudo-second-order, which are based on adsorption equilibrium capacity, is used.56 The equation for pseudo first order reaction is shown below. | |
 | (7) |
where Qe and Qt are the adsorbed amounts of metal ions/anions at equilibrium and time ‘t’, respectively; k1 is the pseudo-first-order kinetic constant, expressed in inverse minutes. Equation integration and rearrangement yields the linear form as shown below.| |
ln(Qs − Qt) = ln![[thin space (1/6-em)]](https://www.rsc.org/images/entities/char_2009.gif) Qe − k1t Qe − k1t
| (8) |
The equation for pseudo second order reaction can be expressed mathematically as shown below.
| |
 | (9) |
where
Qe and
Qt are same as in
eqn (6);
k2 (g (mol min)
−1) is the pseudo-second-order rate constant. The differential equation is usually integrated and transformed in its linear form as shown below.
| |
 | (10) |
Experimental data obtained from the kinetic study following the procedure described in the Experimental section is fitted in eqn (7) and (9) and the plot obtained for pseudo-second-order and pseudo-first-order are shown in Fig. 9 and S6 (ESI),† respectively.
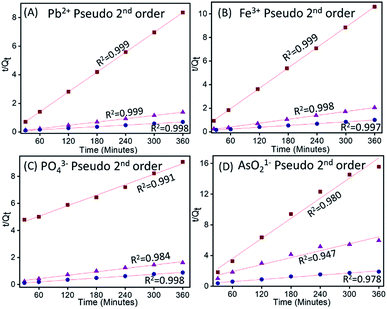 |
| | Fig. 9 Plot of pseudo-second-order kinetic study of (A) Pb2+ (B), Fe3+ (C) PO43− and (D) AsO21− adsorption by ZnO@TnC. | |
The values of correlation co-efficient (R2) obtained for all metal ions and anions at different concentrations using both the equations are summarized in Table S1.† The R2 values suggests that the experimental data are better fitted with the pseudo-second-order equation. The rate constant and other parameters are therefore, calculated using the pseudo-second-order equation and the data are summarized in Table 3. It can be observed from Table 3 that, in case of Pb2+ and Fe3+, initial adsorption (h) increases with increase in metal ion concentration from 10 to 50 ppm and then decreases it at 100 ppm, which indicated the saturation of ZnO@TnC with metal ions. However, in case of PO43− and AsO21−, “h” increases with increase in the concentration of ions from 10 to 100 ppm, which indicated availability of more binding site on the particles.57 Rate constant of pseudo-second-order kinetic “k2” decreases with increase in initial concentration of ions. In all cases, the amount of metal ions adsorbed increases with increase in their initial concentration. Adsorption capacity of Pb2+, Fe3+ and PO43− was found to be 506.1 mg g−1, 358 mg g−1 and 1606 mg g−1, respectively by ZnO@TnC and of AsO21− to be 189 mg g−1 by Fe–ZnO@TnC.
Table 3 Pseudo first and second order kinetic model parameters for Pb2+, Fe3+, PO43− and AsO21− adsorption by ZnO@TnC
| Initial conc. (PPM) |
k2 (g mg−1 min−1) |
h (mg g−1 min−1) |
Qe (mg g−1) practical |
Qe (mg g−1) calculated |
| Pb2+ |
| 10 |
3.68 × 10⁻² |
68.57 |
43.11 |
43.15 |
| 50 |
2.35 × 10⁻³ |
160.72 |
260.10 |
261.09 |
| 100 |
6.69 × 10⁻⁵ |
20.89 |
512.25 |
558.65 |
![[thin space (1/6-em)]](https://www.rsc.org/images/entities/char_2009.gif) |
| Fe3+ |
| 10 |
1.17 × 10⁻² |
13.75 |
33.97 |
34.19 |
| 50 |
9.09 × 10⁻⁴ |
29.32 |
175.25 |
179.53 |
| 100 |
8.95 × 10⁻⁵ |
13.65 |
358.35 |
390.62 |
![[thin space (1/6-em)]](https://www.rsc.org/images/entities/char_2009.gif) |
| PO43− |
| 10 |
1.23 × 10⁻⁴ |
0.23 |
39.68 |
38.49 |
| 50 |
1.12 × 10⁻⁴ |
6.33 |
222.90 |
237.52 |
| 100 |
1.10 × 10⁻⁴ |
20.03 |
408.00 |
425.53 |
![[thin space (1/6-em)]](https://www.rsc.org/images/entities/char_2009.gif) |
| AsO21− |
| 10 |
3.67× 10⁻⁴ |
0.19 |
23.15 |
22.90 |
| 50 |
8.73× 10⁻⁵ |
0.38 |
60.50 |
66.26 |
| 100 |
2.45× 10⁻⁵ |
1.13 |
189.00 |
214.59 |
3.7. Adsorption with variation in pH
Adsorption of all ions were conducted in the pH range 2 to 12 following the procedure described in the Experimental section. For PbCl2, however the study was conducted up to pH 9 due to insufficient solubility of PbCl2 at higher pH. The bar diagram showing the amount of ions adsorbed at different pH is displayed in Fig. S7 (ESI),† which shows that except PO43−, adsorption of all other ions are independent of pH. In case of PO43−, its adsorption was observed to be higher at acidic pH and lower at higher (basic) pH. This is probably due to the fact that PO43− binds with ZnO@TnC through H-bonding and at higher pH the binding sites get deprotonated.
3.8. Recovery of ZnO@TnC for reuse
The possibility to recover the ZnO@TnC by desorption of adsorbed metal ion to reuse it for further adsorption study is investigated. Detail experimental procedure has given in the Experimental section. For desorption of Pb2+, a strong chelating agent called ethylenediaminetetraacetate (EDTA) was added into Pb2+–ZnO@TnC, which resulted in formation of water soluble Pb2+–EDTA complex, the suspended ZnO@TnC was then separated by centrifugation and after washing the solid by water it is reused for adsorption of Pb2+ up to 3 consecutive cycles as shown in the Fig. S8A (ESI).† The schematic presentation of desorption of Pb2+ and formation of Pb2+–EDTA complex is depicted in Scheme 2b. As mentioned earlier, PO43− at higher pH does not interact with ZnO@TnC due to deprotonation of its binding sites, therefore ZnO@TnC after adsorption of PO43− was treated with NaOH solution, which induced deprotonation of the functional group (Scheme 3), resulting in the release of PO43− in the solution. After NaOH treatment, it was neutralized with HCl solution and then reused for further adsorption of PO43−.
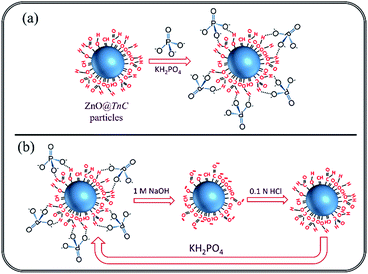 |
| | Scheme 3 Schematic presentation of (a) adsorption of PO43− by ZnO@TnC and (b) regeneration of ZnO@TnC by desorption of PO43− after treatment with 1 mol L−1 naOH solution. | |
ZnO@TnC was reused for PO43− adsorption up to 3 consecutive cycle as shown in Fig. S8B (ESI).† The chelating agent EDTA, however was not effective for releasing Fe3+ from Fe–ZnO@TnC. However, Fe–ZnO@TnC was used further for the adsorption of AsO21− in aqueous media. Attempt has been made for regeneration of ZnO@TnC from AsO21− adsorbed Fe–ZnO@TnC materials by desorption of AsO21− and Fe3+ by variation of pH and treatment with EDTA but it was not successful.
4. Conclusions
The present study demonstrated an easy and simple method for the preparation of a biomass grafted ZnO microcrystalline material as an adsorbent for selected metal ions and anions. The biomass powder was prepared from Tinospora cordifolia and it was anchored on to the surface of the ZnO particles by calcination of Zn(OH)2 in presence of the biomass. The surface functionalized ZnO particles (ZnO@TnC) adsorbed Pb2+, Fe3+and PO43− effectively out of a large number of metal ions and anions examined and the Fe3+ adsorbed ZnO@TnC material further adsorbed AsO21−. The amount of PO43− absorbed, 1606 mg g−1, is the highest so far reported to the best of our knowledge. The amount of Pb2+ (506.1 mg g−1) and Fe3+ (358 mg) adsorbed is also very high and are comparable to some of the best systems reported recent time. For Pb2+ and PO43−, the reusability of ZnO@TnC is demonstrated by desorption of the metal ion and anion for three cycle without deactivation. For Fe3+, the metal ion adsorbed material was further used to adsorb AsO21−. The experimental adsorption data fitted excellently with the Langmuir adsorption isotherm model and the adsorption kinetic data follow the pseudo-second-order equation. All of the calculated parameters are reported and the possible mechanism of adsorption is presented. The material developed following a simple method using low cost starting materials and is very useful for removal of Pb2+, Fe3+, PO43− and AsO21− from the waste water and industrial effluents.
Conflicts of interest
There are no conflicts to declare.
Acknowledgements
Manuscript number: CSIR-CSMCRI – 102/2019. P.P. gratefully acknowledge financial assistance in the form of CSIR-Emeritus Scientist scheme. GV and SB gratefully acknowledge Senior Research Fellowship award by CSIR. The authors acknowledge CSIR-CSMCRI for generous support towards infrastructures and core competency development. Authors also thank V. Agrawal, A. Bhatt, J. Chaudhary, R. Patidar, B. Rabary for recording IR spectra, XRD analysis, SEM images, ICP-OES and Ion chromatography analysis, respectively.
Notes and references
- T. Tong and M. Elimelech, The Global Rise of Zero Liquid Discharge for Wastewater Management: Drivers, Technologies, and Future Directions, Environ. Sci. Technol., 2016, 50(13), 6846–6855 CrossRef CAS.
- A. B. Boehm, K. E. Graham and W. C. Jennings, Can We Swim Yet? Systematic Review, Meta-Analysis, and Risk Assessment of Aging Sewage in Surface Waters, Environ. Sci. Technol., 2018, 52(17), 9634–9645 CrossRef CAS.
- N. Saha, M. S. Rahman, M. B. Ahmed, J. L. Zhou, H. H. Ngo and W. Guo, Industrial Metal Pollution in Water and Probabilistic Assessment of Human Health Risk, J. Environ. Manage., 2017, 185, 70–78 CrossRef CAS.
- B. Moss, Water Pollution by Agriculture, Philos. Trans. R. Soc., B, 2008, 363(1491), 659–666 CrossRef CAS.
- F. M. Rebelo and E. D. Caldas, Arsenic, Lead, Mercury and Cadmium: Toxicity, Levels in Breast Milk and the Risks for Breastfed Infants, Environ. Res., 2016, 151, 671–688 CrossRef CAS.
- G. Flora, D. Gupta and A. Tiwari, Toxicity of Lead: A Review with Recent Updates, Interdiscip. Toxicol., 2012, 5(2), 47–58 CAS.
- B. E. Hettick, J. E. Canas-Carrell, A. D. French and D. M. Klein, Arsenic: A Review of the Element's Toxicity, Plant Interactions, and Potential Methods of Remediation, J. Agric. Food Chem., 2015, 63(32), 7097–7107 CrossRef CAS.
- E. Topuz, O. V. Erkan and I. Talinli, Waste Management Strategies for Cleaner Recycling of Spent Batteries: Lead Recovery and Brick Production from Slag, Int. J. Environ. Sci. Technol., 2019 DOI:10.1007/s13762-019-02308-4.
- B. Ericson, P. Landrigan, M. P. Taylor, J. Frostad, J. Caravanos, J. Keith and R. Fuller, The Global Burden of Lead Toxicity Attributable to Informal Used Lead-Acid Battery Sites, Ann. Glob. Health., 2016, 82(5), 686–699 CrossRef.
- T. L. Pan, P. W. Wang, S. A. Al-Suwayeh, C. C. Chen and J. Y. Fang, Skin Toxicology of Lead Species Evaluated by Their Permeability and Proteomic Profiles: A Comparison of Organic and Inorganic Lead, Toxicol. Lett., 2010, 197(1), 19–28 CrossRef CAS.
- M. Jaishankar, T. Tseten, N. Anbalagan, B. B. Mathew and K. N. Beeregowda, Toxicity, Mechanism and Health Effects of Some Heavy Metals, Interdiscip. Toxicol., 2014, 7(2), 60–72 Search PubMed.
- W. Q. Chen, Y. L. Shi, S. L. Wu and Y. G. Zhu, Anthropogenic Arsenic Cycles: A Research Framework and Features, J. Cleaner Prod., 2016, 139, 328–336 CrossRef CAS.
- H. T. Hanh, J. Y. Kim, S. Bang and K. W. Kim, Sources and Fate of As in the Environment, Geosyst. Eng., 2010, 13(1), 35–42 CrossRef.
- T. S. Y. Choong, T. G. Chuah, Y. Robiah, F. L. Gregory Koay and I. Azni, Arsenic Toxicity, Health Hazards and Removal Techniques from Water: An Overview, Desalination, 2007, 217(1–3), 139–166 CrossRef CAS.
- G. Vyas, A. Kumar, M. Bhatt, S. Bhatt and P. Paul, New Route for Synthesis of Fluorescent SnO2 Nanoparticles for Selective Sensing of Fe(III) in Aqueous Media, J. Nanosci. Nanotechnol., 2018, 18, 3954–3959 CrossRef CAS.
- V. Kumar, P. K. Bharti, M. Talwar, A. K. Tyagi and P. Kumar, Studies on High Iron Content in Water Resources of Moradabad District (UP), India, Water Science, 2017, 31(1), 44–51 CrossRef.
- B. Kestenbaum, J. N. Sampson, K. D. Rudser, D. J. Patterson, S. L. Seliger, B. Young, D. J. Sherrard and D. L. Andress, Serum Phosphate Levels and Mortality Risk among People with Chronic Kidney Disease, J. Am. Soc. Nephrol., 2005, 16, 520–528 CrossRef CAS.
- S. M. Harris, J. T. Nguyen, S. L. Pailloux, J. P. Mansergh, M. J. Dresel, T. B. Swanholm, T. Gao and V. C. Pierre, Gadolinium Complex for the Catch and Release of Phosphate from Water, Environ. Sci. Technol., 2017, 51(8), 4549–4558 CrossRef CAS.
- S. K. Gunatilake, Methods of Removing Heavy Metals From Industrial Wastewater, J. Multidiscip. Eng. Sci. Stud., 2015, 1(1), 13–18 Search PubMed.
- C. A. Basha, N. S. Bhadrinarayana, N. Anantharaman and K. M. Meera Sheriffa Begum, Heavy Metal Removal from Copper Smelting Effluent Using Electrochemical Cylindrical Flow Reactor, J. Hazard. Mater., 2008, 152(1), 71–78 CrossRef.
- A. Dabrowski, Z. Hubicki, P. Podkoscielny and E. Robens, Selective Removal of the Heavy Metal Ions from Waters and Industrial Wastewaters by Ion-Exchange Method, Chemosphere, 2004, 56(2), 91–106 CrossRef CAS.
- V. K. Gupta, I. Ali, T. A. Saleh, A. Nayak and S. Agarwal, Chemical Treatment Technologies for Waste-Water Recycling – An Overview, RSC Adv., 2012, 2(16), 6380–6388 RSC.
- Y. R. Zhao, Z. R. Zhang, C. Yang, H. L. Fan, J. Wang, Z. Tian and H. Y. Zhang, Critical Role of Water on the Surface of ZnO in H2S Removal at Room Temperature, Ind. Eng. Chem. Res., 2018, 57, 15366–15374 CAS.
- S. Alhan, M. Nehra, N. Dilbaghi, N. K. Singhal, K. H. Kim and S. Kumar, Potential use of ZnO@activated carbon nanocomposites for the adsorptive removal of Cd2+ ions in aqueous solutions, Environ. Res., 2019, 173, 411–418 CrossRef CAS PubMed.
- I. Ghiloufi, J. El Ghoul, A. Modwi and L. El Mir, Ga-Doped ZnO for Adsorption of Heavy Metals from Aqueous Solution, Mater. Sci. Semicond. Process., 2016, 42(3), 102–106 CrossRef CAS.
- A. S. Ibupoto, U. A. Qureshi, M. Arain, F. Ahmed, Z. Khatri, R. Z. Brohi, I. S. Kim and Z. I. Ahmad, ZnO/Carbon nanofibers for efficient adsorption of lead from aqueous solutions, Environ. Technol., 2019 DOI:10.1080/0959330.2019.1580774.
- K. Sao, M. Pandey, P. K. Pandey and F. Khan, Highly Efficient Biosorptive Removal of Lead from Industrial Effluent, Environ. Sci. Pollut. Res., 2017, 24(22), 18410–18420 CrossRef CAS.
- Z. Aly, A. Graulet, N. Scales and T. Hanley, Removal of Aluminium from Aqueous Solutions Using PAN-Based Adsorbents: Characterisation, Kinetics, Equilibrium and Thermodynamic Studies, Environ. Sci. Pollut. Res., 2014, 21(5), 3972–3986 CrossRef CAS.
- M. Podlogar, A. Recnik, G. Yilmazoglu, I. O. Ozer, M. Mazaj, E. Suvaci and S. Bernik, The Role of Hydrothermal Pathways in the Evolution of the Morphology of ZnO Crystals, Ceram. Int., 2016, 42(14), 15358–15366 CrossRef CAS.
- K. Sao, F. Khan, P. K. Pandey and M. Pandey, Equilibrium Isotherm Study for Removal of Mn(II) from Aqueous Solutions by Using Novel Bioadsorbent Tinospora cordifolia, J. Adv. Res., 2016, 6(4), 1–11 CrossRef.
- V. J. Inglezakis, S. G. Poulopoulos and H. Kazemian, Insights into the S-shaped sorption isotherms and their dimensionless forms, Microporous Mesoporous Mater., 2018, 272, 166–176 CrossRef CAS.
- P. Goyal, P. Sharma, S. Srivastava and M. M. Srivastava, Saraca Indica Leaf Powder for Decontamination of Pb: Removal, Recovery, Adsorbent Characterization and Equilibrium Modeling, Int. J. Environ. Sci. Technol., 2008, 5(1), 27–34 CrossRef CAS.
- F. Liu, Y. Jin, H. Liao, L. Cai, M. Tong and Y. Hou, Facile self-assembly synthesis of titanate/Fe3O4 nanocomposites for the efficient removal of Pb2+ from aqueous systems, J. Mater. Chem. A, 2013, 1, 805–813 RSC.
- A. M. Lopez-Marzo, J. Pons and A. Merkoci, Multifunctional system based on hybrid nanostructured rod formation, for sensoremoval applications of Pb2+ as a model toxic metal, J. Mater. Chem. A, 2013, 1, 13532–13541 RSC.
- A. M. Lopez-Marzo, J. Pons and A. Merkoci, Extremely fast and high Pb2+ removal capacity using a nanostructured hybrid material, J. Mater. Chem. A, 2014, 2, 8766–8772 RSC.
- J. Wang, W. Zhang, X. Yue, Q. Yang, F. Liu, Y. Wang, D. Zhang, Z. Li and J. Wang, One-pot synthesis of multifunctional magnetic ferrite–MoS2–carbon dot nanohybrid adsorbent for efficient Pb(II) removal, J. Mater. Chem. A, 2016, 4, 3893–3900 RSC.
- H. A. Sani, M. B. Ahmad, M. Z. Hussein, N. A. Ibrahim, A. Musa and T. A. Saleh, Nanocomposite of ZnO with Montmorillonite for Removal of Lead and Copper Ions from Aqueous Solutions, Process Saf. Environ. Prot., 2017, 109, 97–105 CrossRef CAS.
- J. Chen, H. Kong, D. Wu, X. Chen, D. Zhang and Z. Sun, Phosphate Immobilization from Aqueous Solution by Fly Ashes in Relation to Their Composition, J. Hazard. Mater., 2007, 139, 293–300 CrossRef CAS.
- X. Lei, X. Dai, S. Long, N. Cai, Z. Ma and X. Luo, Facile Design of Green Engineered Cellulose/Metal Hybrid Macrogels for efficient Trace Phosphate Removal, Ind. Eng. Chem. Res., 2017, 56, 7525–7533 CrossRef CAS.
- H. Qiu, C. Liang, X. Zhang, M. Chen, Y. Zhao, T. Tao, Z. Xu and G. Liu, Fabrication of a Biomass-Based Hydrous Zirconium Oxide Nanocomposite for Preferable Phosphate Removal and Recovery, ACS Appl. Mater. Interfaces, 2015, 7, 20835–20844 CrossRef CAS.
- Y. Yao, B. Gao, J. Chen and L. Yang, Engineered Biochar Reclaiming Phosphate from Aqueous Solutions: Mechanisms and Potential Application as a Slow-Release Fertilizer, Environ. Sci. Technol., 2013, 47, 8700–8708 CrossRef CAS.
- W. Chouyyok, R. J. Wiacek, K. Pattamakomsan, T. Sangvanich, R. M. Grudzien and G. E. Fryxell, Phosphate Removal by Anion Binding on Functionalized Nanoporous Sorbents, Environ. Sci. Technol., 2010, 44, 3073–3078 CrossRef CAS.
- X. Song, Y. Pan, Q. Wu, Z. Cheng and W. Ma, Phosphate Removal from Aqueous Solutions by Adsorption Using Ferric Sludge, Desalination, 2011, 280, 384–390 CrossRef CAS.
- M. A. Shavandi, Z. Haddadian, M. H. S. Ismail, N. Abdullah and Z. Z. Abidin, Journal of the Taiwan Institute of Chemical Engineers Removal of Fe(III), Mn(II) and Zn(II) from Palm Oil Mill Effluent (POME) by Natural Zeolite, J. Taiwan Inst. Chem. Eng., 2012, 43, 750–759 CrossRef CAS.
- L. Khalfa, M. L. Cervera, S. Souissi-najjar and M. Bagane, Removal of Fe(III) from synthetic wastewater into raw and modified clay: Experiments and models fitting, Sep. Sci. Technol., 2017, 1–11 CrossRef.
- R. Bun-ei, N. Kawasaki, F. Ogata, T. Nakamura, K. Aochi and S. Tanada, Removal of Lead and Iron Ions by Vegetable Biomass in Drinking water, J. Oleo Sci., 2006, 55, 423–427 CrossRef CAS.
- A. B. Jusoh, W. H. Cheng, W. M. Low, A. Noraaini and M. J. M. Mohd Noor, Study on the Removal of Iron and Manganese in Groundwater by Granular Activated Carbon, Desalination, 2005, 182, 347–353 CrossRef.
- S. R. Kanel, B. Manning, L. Charlet and H. Choi, Removal of Arsenic(III) from Groundwater by Nanoscale Zero-Valent Iron, Environ. Sci. Technol., 2005, 39(5), 1291–1298 CrossRef CAS.
- Y. Babaee, C. N. Mulligan and S. Rahaman, Removal of Arsenic(III) and Arsenic(V) from Aqueous Solutions through Adsorption by Fe/Cu Nanoparticles, J. Chem. Technol. Biotechnol., 2018, 93, 63–71 CrossRef CAS.
- R. M. Dhoble, P. R. Maddigapu, A. G. Bhole and S. Rayalu, Development of Bark-Based Magnetic Iron Oxide
Particle (BMIOP) , a Bio-Adsorbent for Removal of Arsenic(III) from Water, Environ. Sci. Pollut. Res., 2018, 25, 19657–19674 CrossRef CAS PubMed.
- M. Sharma, S. Ramakrishnan, S. Remanan, G. Madras and S. Bose, Nano-Structures & Nano-Objects Nano Tin Ferrous Oxide Decorated Graphene Oxide Sheets for Efficient Arsenic(III) Removal, Nano-Struct. Nano-Objects, 2018, 13, 82–92 CrossRef CAS.
- S. Hokkanen, B. Doshi, V. Srivastava, L. Puro and R. Koivula, Arsenic(III) Removal from Water by Hydroxyapatite-Bentonite Clay-Nanocrystalline Cellulose, Environ. Prog. Sustainable Energy, 2019 DOI:10.1002/ep.13147.
- B. E. Reed and M. R. Matsumoto, Modeling Cadmium Adsorption by Activated Carbon Using the Langmuir and Freundlich Isotherm Expressions, Sep. Sci. Technol., 1993, 28, 2179–2195 CrossRef CAS.
- N. Ayawei, A. N. Ebelegi and D. Wankasi, Modelling and Interpretation of Adsorption Isotherms, J. Chem., 2017, 2017, 3039817–3039827 Search PubMed.
- A. M. Aljeboree, A. N. Alshirifi and A. F. Alkaim, Kinetics and Equilibrium Study for the Adsorption of Textile Dyes on Coconut Shell Activated Carbon, Arabian J. Chem., 2017, 10, S3381–S3393 CrossRef CAS.
- J. P. Simonin, On the Comparison of Pseudo-First Order and Pseudo-Second Order Rate Laws in the Modeling of Adsorption Kinetics, Chem. Eng. J., 2016, 300, 254–263 CrossRef CAS.
- Z. Aly and V. Luca, Uranium Extraction from Aqueous Solution Using Dried and Pyrolyzed Tea and Coffee Wastes, J. Radioanal. Nucl. Chem., 2013, 295(2), 889–900 CrossRef CAS.
Footnote |
| † Electronic supplementary information (ESI) available. See DOI: 10.1039/c9ra07042g |
|
| This journal is © The Royal Society of Chemistry 2019 |
Click here to see how this site uses Cookies. View our privacy policy here.  Open Access Article
 ab and
Parimal Paul
 *ab
*ab
![[double bond, length as m-dash]](https://www.rsc.org/images/entities/char_e001.gif) O) etc., which can effectively interact with metal ions.27 This functional material (ZnO@TnC) exhibited high adsorption capacity towards the metal ions such as Pb2+, Fe3+, AsO21− and anion like PO43− in aqueous media. This material can be reused for several time in the case of lead and phosphate, while in the case of iron, it was reused for adsorption of arsenic from waste water. Herein we report preparation of ZnO based biomass decorated functional material, its characterization, metal ion adsorption property and its reusability.
O) etc., which can effectively interact with metal ions.27 This functional material (ZnO@TnC) exhibited high adsorption capacity towards the metal ions such as Pb2+, Fe3+, AsO21− and anion like PO43− in aqueous media. This material can be reused for several time in the case of lead and phosphate, while in the case of iron, it was reused for adsorption of arsenic from waste water. Herein we report preparation of ZnO based biomass decorated functional material, its characterization, metal ion adsorption property and its reusability.


![[double bond, length as m-dash]](https://www.rsc.org/images/entities/char_e001.gif) O/COOH and OH/NH functional groups of TnC embedded onto the surface of the ZnO particles. The IR spectrum of the AsO21− bound Fe–ZnO@TnC, shown in Fig. S4 (ESI),† also showed significant change compared to its mother compound in the finger print region confirming the interaction of AsO21− with Fe–ZnO@TnC. The morphology of the ion adsorbed ZnO@TnC is investigated by FE-SEM and the presence of ions (Pb2+/Fe3+/PO43−) in it is confirmed by EDX analysis. The FE-SEM images and the EDX analysis of all the ion adsorbed ZnO@TnC are shown in Fig. 6. It may be noted that on adsorption of ion, the morphology of ZnO@TnC has changed substantially and the EDX data show the presence of respective metal ion/element (P of phosphate ion). Therefore, PXRD, IR, FE-SEM and EDX analysis have confirmed the adsorption of ions by ZnO@TnC.
O/COOH and OH/NH functional groups of TnC embedded onto the surface of the ZnO particles. The IR spectrum of the AsO21− bound Fe–ZnO@TnC, shown in Fig. S4 (ESI),† also showed significant change compared to its mother compound in the finger print region confirming the interaction of AsO21− with Fe–ZnO@TnC. The morphology of the ion adsorbed ZnO@TnC is investigated by FE-SEM and the presence of ions (Pb2+/Fe3+/PO43−) in it is confirmed by EDX analysis. The FE-SEM images and the EDX analysis of all the ion adsorbed ZnO@TnC are shown in Fig. 6. It may be noted that on adsorption of ion, the morphology of ZnO@TnC has changed substantially and the EDX data show the presence of respective metal ion/element (P of phosphate ion). Therefore, PXRD, IR, FE-SEM and EDX analysis have confirmed the adsorption of ions by ZnO@TnC.


![[thin space (1/6-em)]](https://www.rsc.org/images/entities/char_2009.gif) Qe − k1t
Qe − k1t


![[thin space (1/6-em)]](https://www.rsc.org/images/entities/char_2009.gif)
![[thin space (1/6-em)]](https://www.rsc.org/images/entities/char_2009.gif)
![[thin space (1/6-em)]](https://www.rsc.org/images/entities/char_2009.gif)


