DOI:
10.1039/C9RA06551B
(Paper)
RSC Adv., 2019,
9, 34114-34119
Highly efficient and giant negative electrocaloric effect of a Nb and Sn co-doped lead zirconate titanate antiferroelectric film near room temperature
Received
20th August 2019
, Accepted 16th October 2019
First published on 23rd October 2019
Abstract
Adiabatic temperature variation (ΔT), coefficient of performance (COP) and electrocaloric coefficient (ΔT/ΔE) play important roles in evaluating the comprehensive performance of solid-state cooling technology based on the electrocaloric effect (ECE). A Nb and Sn co-doped lead zirconate titanate antiferroelectric film, Pb0.99Nb0.02(Zr0.85Sn0.13Ti0.02)O3 (PNZST), shows a highly efficient and giant negative ECE. The ΔT, |ΔT/ΔE| and COP are about −9.8 K, 0.0488 K cm kV−1 and 35.53 at around 50 °C, respectively. The full width at half maximum of the ΔT peak is about 37 °C. Phenomenological analysis indicates that the highly efficient and giant negative ECE is associated with the first-order transition that has a discontinuous polarization change with increasing temperature.
1. Introduction
The electrocaloric effect (ECE) is a phenomenon of adiabatic temperature variation (ΔT) (or isothermal entropy variation, ΔS) generated by the polarization change caused by an applied electric field (E). It could be used in solid-state cooling technology with the merits of being highly efficient, environment-friendly, inexpensive and compact. Since a giant ECE was found in PbZr0.95Ti0.05O3 antiferroelectric (AFE) films in 2006 (ΔT ∼ 12 K at 495 K with electric field change (ΔE) of ∼780 kV cm−1), it has attracted much attention.1 Many large ECEs have been reported in AFE/ferroelectric bulk ceramics,2–5 polymers6 and films.7–11 However, there are still some limits for practical applications. For example, many large ECEs happen at high temperature (>100 °C)1,9,12–16 and the coefficient of performance (COP)13,17–19 and electrocaloric (EC) coefficient (ΔT/ΔE) are very small.2–4,12,13 Therefore, it is a big challenge to design and prepare an EC material with good comprehensive performance.
In contrast to the normal positive ECE (ΔT > 0), the negative ECE (ΔT < 0) is considered as the decrease of polarization from higher-temperature state to lower-temperature state as well as the dipolar entropy. PbZrO3-based AFEs often are nonpolar at room temperature and could come into FE phase with increasing applied electric field. In some chemically modified PbZrO3-based AFEs, they undergo phase transitions into ferroelectric (FE) and paraelectric (PE) phases with increasing temperature.20 So the negative ECE could happen below Curie temperature with a certain applied electric field. For the improvement of ΔT/ΔE, not only large ΔT is expected, but also small ΔE is desired. Nb-dopant is often used to enhance the mobility of domains and reduce the coercive field of Pb(Zr, Ti)O3 (PZT) systems.21,22 Therefore, it may be helpful to decrease the switching electric field of AFE-FE phase transitions (EAFE-FE) of PbZrO3-based AFEs.
In this work, a Nb and Sn co-doped lead zriconate titante AFE film was prepared and a highly efficient and giant negative ECE were found near room temperature. Theoretical analysis revealed that the AFE films undergone first-order and second-order phase transitions under different temperatures and electric fields. The giant negative ECE near room temperature was closely related to the first-order phase transition.
2. Experimental procedure
Material preparation
A Pb0.99Nb0.02(Zr0.85Sn0.13Ti0.02)O3 (PNZST) film was prepared by sol–gel method. Lead acetate trihydrate, niobium ethoxide, zirconium propoxide, tin acetate, and tetrabutyl titanate [C16H36O4Ti] were used as raw materials and 2-methoxyethanol was chosen as solvent. The solution with concentration of 0.3 mol L−1 was mixed at 80 °C for 3 hours with polyvinylpyrrolidone (PVP) as an additive.23–25 The PNZST film was deposited by spin-coating the sol on the LaNiO3/Si substrates followed by drying at 120 °C for 5 min, pyrolyzing at 500 °C for 5 min and pre-annealing at 700 °C for 10 min using rapid thermal process (RTP). Above processes were repeated until the desired thickness of 1 μm was achieved. A PbO capping layer was deposited prior to final annealing at 700 °C for 30 min for crystallization. Finally, Au top electrodes with an area of 0.09 mm2 were sputtered on the PNZST films by a shadow mask for electrical measurements.
Characterization
The crystal structure of the PNZST film was characterized by X-ray diffraction (XRD) (Bruker AXS/D8). The surface morphologies were observed by atomic force microscope (AFM, Bruker MultiMode 8). The temperature-dependent dielectric and ferroelectric properties were measured by an impedance analyzer (Agilent E4990A) and a ferroelectric test system (Radiant, Precision Multiferroic) combined with a homemade automatic controlled heating system.
3. Results and discussion
Fig. 1(a) shows the XRD pattern of the PNZST film, which has typical perovskite orthorhombic structure26 with highly (001)/(100) orientation. AFM images of surface morphology exhibit that the PNZST film is smooth and consist of double-scale crystalline grains. The big and small grain sizes are about 110 nm and 50 nm, respectively, as shown in Fig. 1(b) (c).
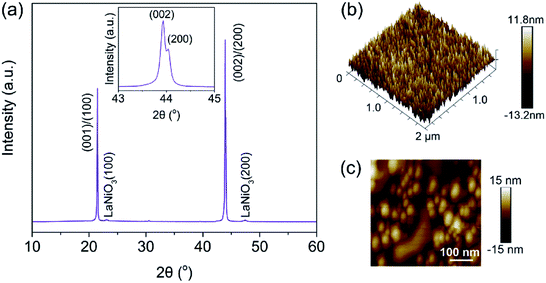 |
| | Fig. 1 (a) X-ray diffraction pattern of the PNZST film. The inset is enlarged (002)/(200) peaks. (b) and (c) AFM images of surface morphology of the PNZST film. | |
Fig. 2(a) shows the temperature-dependent dielectric responses of the PNZST film with frequencies of 1 kHz, 10 kHz and 50 kHz, respectively. All the peaks located at about 190 °C and the relative dielectric constant measured at 1 kHz is largest. The temperature-dependent hysteresis loops of the PNZST film with different electric fields are shown Fig. 2(b). The film has typical AFE double hysteresis loops and four current (dP dt−1) peaks below its own dielectric peak temperature. However, qualitative FE single hysteresis loops and lossy PE behaviors appear at 190 °C and 250 °C, respectively. This result is similar as previously reports and the peak temperature of 190 °C is often considered as the Curies temperatures TC associated with the phase transition of cubic PE.1,27,28
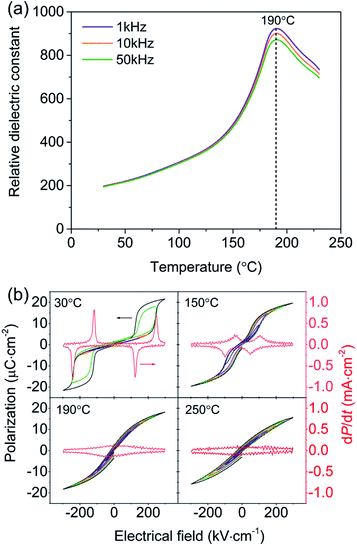 |
| | Fig. 2 (a) Temperature-dependent relative dielectric constants of the PNZST film. (b) Hysteresis loops of the PNZST film under different temperatures with applied electric fields of 20 kV cm−1, 50 kV cm−1, 100 kV cm−1, 150 kV cm−1, 200 kV cm−1, 250 kV cm−1 and 300 kV cm−1, respectively. | |
The ECE properties of the PNZST film are attained from the temperature-dependent hysteresis loops with different electric fields. The temperature-dependent maximum polarizations (Pmax), i.e. the polarization of each hysteresis loop at the maximum electric field, are shown in Fig. 3(a). There is one peak for each Pmax curve with applied electric field and the left part of the peak becomes more and more sharp with increasing electric field. Fig. 3(b) shows that the temperature of the peak (Tp) shifts to lower temperature linearly with increasing electric field and it has the similar trends with the switching electric field of AFE-FE phase (EAFE-FE) transitions. It is indicated that the Pmax peak is associated with the AFE-FE phase transition and the temperature of AFE-FE phase transition could be affected by applied electric fields which also could be confirmed by the hysteresis loops in Fig. 2(b). ΔT and ΔS of ECE are written by
| |
 | (1) |
| |
 | (2) |
where
T is absolute temperature, the heat capacity
C are assumed to be 330 J K
−1 kg
−1, the density
ρ are 7.78 g cm
−3 for PNZST film.
20 E1 is zero and
E2 is the applied electric field corresponding to each
Pmax.
Fig. 3(c) and (d) show the Δ
T and Δ
S calculated by the above equations using the eight order polynomial curves of
Pmax in
Fig. 3(a). It is indicated that the PNZST film has negative ECE at lower temperature and positive ECE at higher temperature. The negative Δ
T and Δ
S become larger with increasing electric field. The maximum negative Δ
T of about −9.8 K and Δ
S of about −9.9 J K
−1 kg
−1 appear at around 54 °C when the electric field of 200 kV cm
−1 is applied. They span a wide temperature range nearly from 30 °C to 100 °C and the full width at half maximum (FWHM) of the Δ
T peak is about 37 °C. Therefore, the PNZST film could work at temperatures from about 36 °C to 73 °C with at least a half of the maximum negative Δ
T of −4.9 K. The COP of the PNZST film in
Fig. 3(e) is given by
| |
 | (3) |
| |
 | (4) |
| |
 | (5) |
where
Q is isothermal heat,
W is energy-storage density,
P is polarization and
Pr is the remnant polarization of the hysteresis loop. The COP of PNZST film at 50 °C is as high as about 35.53, which is larger than those of the reported AFE/FE bulk ceramics, polymers and films, as shown in
Fig. 3(f). It is suggested that the PNZST film has potential applications in highly refrigeration efficient solid-state cooling technology.
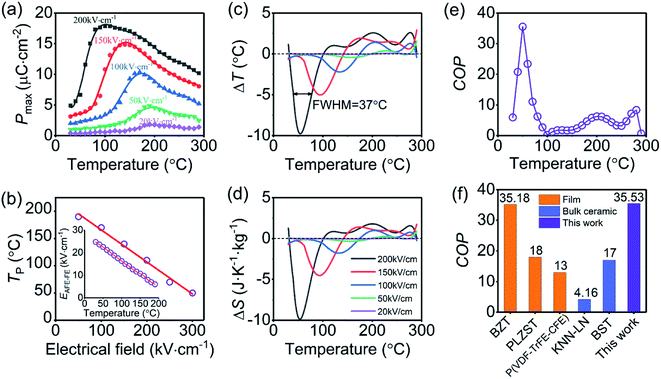 |
| | Fig. 3 (a) Temperature-dependent Pmax of the PNZST film with different applied electrical fields. (b) Tp of the PNZST film as a function of applied electrical field. The inset is the temperature-dependent EAFE-FE attained from hysteresis loops. (c) ΔT and (d) ΔS of the PNZST film as functions of temperature with different applied electrical fields. (e) Temperature-dependent COP of the PNZST film and (f) histogram of COP for the PNZST film in this work, BaZr0.2Ti0.8O3 (BZT),29 Pb0.97La0.02(Zr0.75Sn0.18Ti0.07)O3 (PLZST)17 and P(VDF-TrFE-CFE)18 films, (1 − x)K0.5Na0.5NbO3-xLaNbO3 (KNN-LN),13 and BaxSr1−xTiO3 (BST) bulk ceramics.19 | |
The electric field-induced phase transition of an AFE system can be well explained by the Ginzburg–Landau–Devonshire (GLD) phenomenology theory based on the Kittel model. The free energy (f) can be described by the FE polarization order parameter (p) and AFE polarization order parameter (q) as following equations30
| |
 | (6) |
| | |
p = P1 + P2, q = P1 − P2,
| (7) |
where
P1 and
P2 are the polarization components for the two sub-lattices 1 and 2 based on the Kittel's theory, respectively. Here
a,
b and
c are the Landau-type expansion coefficients, and
g is the AFE coupling strength. Among all the coefficients,
a is a temperature-dependent parameter, which can be described as
a =
g +
a1(
T/
T0 − 1), where
T0 is the Curie–Weiss temperature and equals to
TC of 190 °C for PNZST film by assuming the second-order phase transition. In order to understand the main characteristics of field-induced phase transition, all the coefficients are normalized. So we set
a1 = 1,
b =
c = 1/3 and
g = 0.5.
30 Through the thermodynamic conditions, ∂
f/∂
P1 = ∂
f/∂
P2 = 0, following relations could be established by
| |
 | (8a) |
| |
 | (8b) |
The normalized Pmax in Fig. 3(a) are substituted into eqn (8) instead of order parameter p, and then the p and q as functions of T/T0 are attained with effective normalized E shown in Fig. 4(a). The T3cp, which is equal to 0.763T0, is often considered as the tricritical point of the transition from the PE (or field-induced FE polar phase) to the AFE (or antipolar) phase.30 The Tp of the PNZST film with 200 kV cm−1 and 150 kV cm−1 is smaller than T3cp while the film with other small electric fields has larger Tp than T3cp. It is suggested that the film undergoes second-order transitions (continuous q) with electric fields of 200 kV cm−1 and 150 kV cm−1, and first-order transitions (discontinuous q) with other small electric fields. For first-order transition, the discontinuous change of q and the abrupt increase of p with increasing temperature at the phase transition point could lead to large (∂P/∂T)E. Therefore, when the applied electric field is 200 kV cm−1, the PNZST film presents the largest negative ΔT and ΔS around the phase transition point of 0.56T0 (∼110 °C), as shown in Fig. 4(b).
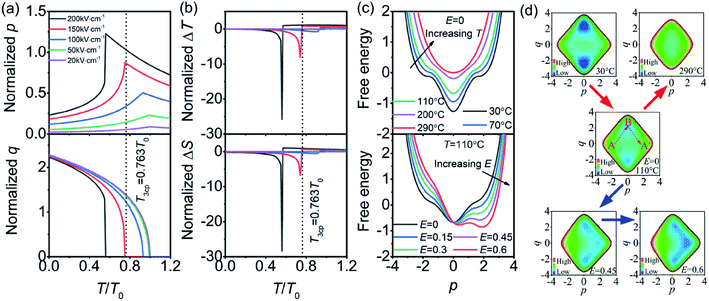 |
| | Fig. 4 Temperature-dependent (a) normalized p and q, (b) normalized ΔT and ΔS of the PNZST film. The legends of 20 kV cm−1, 50 kV cm−1, 100 kV cm−1, 150 kV cm−1 and 200 kV cm−1, represents the theoretical curves are calculated from the experimental data with the corresponding actual applied electric fields. (c) Free energy as functions of p under different temperatures and electrical fields. (d) Contour plots of free energy with increasing temperature (red arrows) and electrical field (blue arrows). | |
The giant negative ECE of PNZST film also could be understood by the free energy shown in Fig. 4(c) (d). At room temperature, the Gibbs free energy has four minima. The global minima are the AFE phase, where q≠0 and p = 0, while the local minima correspond to the FE phase with q = 0 and p ≠ 0. The energy barrier from AFE to FE phases (B to A′) is large, so that only a small polarization can be induced by temperature even without electrical field. With increasing temperature (T > 110 °C), the energy barrier becomes flat and only one minimum, i.e. PE phase, appears at the temperature much higher than the T0. Similarly, with low electrical field the phase transition is also difficult at around 110 °C because of the large energy barrier. With increasing electrical field (normalized E > 0.45), the Gibbs free energy has three minima, which results in an AFE to FE phase transition. With an enough large electrical field, the temperature of phase transition will achieve a tricritical point T3cp which is much lower than TC. Therefore, a giant negative ECE could happen at lower temperature with moderate electrical field. It is worth noting that the normalized ΔT and ΔS at 110 °C in Fig. 4(b) are very large within a narrow temperature range that is much smaller than that of experimental results. The reason should be attributed to the small slope of Pmax with decreasing temperature from tricritical point to near room temperature. Although much larger ΔT is sacrificed in experimental result, the broadened working temperature band is achieved near room temperature. It is suggested that the PNZST film has good ECE within a wide temperature range.
Fig. 5 shows that the PNZST film has good comprehensive ECE performance compared with the previous reported negative ECE results. The |ΔT| of the PNZST film in this work is larger than those of many bulk ceramics and films. The |ΔT/ΔE|, which is 0.0488 K cm kV−1, is the largest of all films and even comparable with the largest one of the PLZST bulk ceramic near room temperature. Thus, the PNZST film gives consideration to the high efficiency and giant negative ECE.
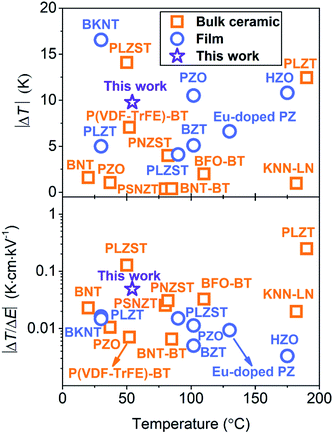 |
| | Fig. 5 Comparation of |ΔT| and |ΔT/ΔE| between bulk ceramics and films with negative ECE. The bulk ceramics are BNT (Bi0.5Na0.5TiO3),2 PLZST (Pb0.97La0.02(Zr0.80Sn0.14Ti0.06)O3),4 P(VDF-TrFE)-BT ((P(VDF-TrFE))-BaTiO3),6 PLZT ((Pb0.97La0.02) (Zr0.95Ti0.05)0.99O3),12 KNN-LN ((1 − x)K0.5Na0.5NbO3-xLaNbO3),13 BFO-BT (0.68BiFeO3-0.32BaTiO3),14 PNZST (Pb0.99Nb0.02(Zr0.85Sn0.13Ti0.02)0.98O3),20 PZO (PbZrO3),30 and BNT-BT (0.94Bi0.5Na0.5TiO3-0.06BaTiO3).31 The films are PNZST85/13/2 in this work, PLZT ((Pb0.97La0.02)(Zr0.95Ti0.05)O3),7 BKNT (Bi0.5(K0.15Na0.85)0.05TiO3),8 PLZST (Pb0.97La0.02(Zr0.92Sn0.05Ti0.03)O3),9 PZO (PbZrO3),15 HZO (Hf0.5Zr0.5O2),16 BZT (BaZr0.2Ti0.8O3)29 and Eu-doped PZ (PbZrO3).32 | |
4. Conclusions
In summary, a PNZST AFE film with good comprehensive ECE performance is prepared successfully. The giant ΔT, |ΔT/ΔE| and COP are even up to −9.8 K, 0.0488 K cm kV−1 and 35.53 at around 50 °C, respectively. Theoretical analysis shows that the PNZST film undergoes a first-order transition with discontinuous polarization change as increasing temperature with electric field of 200 kV cm−1. These results suggested that the PNZST film with good comprehensive ECE performance has promising potential in highly efficient solid-state cooling devices.
Conflicts of interest
There are no conflicts of interest to declare.
Acknowledgements
This work was supported by the Beijing Natural Science Foundation under Grant No. 3172009, L172001, L160001 and 3194047, National Natural Science Foundation of China under Grant No. 51775002.
References
- A. S. Mischenko, Q. Zhang, J. F. Scott, R. W. Whatmore and N. D. Mathur, Science, 2006, 311, 1270 CrossRef CAS.
- X. J. Jiang, L. H. Luo, B. Y. Wang, W. P. Li and H. B. Chen, Ceram. Int., 2014, 40, 2627 CrossRef CAS.
- X. H. Hao and J. W. Zhai, Appl. Phys. Lett., 2014, 104, 022902 CrossRef.
- F. P. Zhuo, Q. Li, J. H. Gao, Y. J. Ji, Q. F. Yan, Y. L. Zhang, H. H. Wu, X. Q. Xi, X. C. Chu and W. W. Cao, ACS Appl. Mater. Interfaces, 2018, 10, 11747 CrossRef CAS.
- L. C. Li, M. X. Xu, Q. Zhang, P. Chen, N. Z. Wang, D. K. Xiong, B. L. Peng and L. J. Liu, Ceram. Int., 2018, 44, 343 CrossRef CAS.
- S. Uddin, G. P. Zheng and Z. Y. Jiang, Solid State Sci., 2019, 90, 9 CrossRef CAS.
- W. P. Geng, Y. Liu, X. J. Meng, L. Bellaiche, J. F. Scott, B. Dkhil and A. Jiang, Adv. Mater., 2015, 27, 3165 CrossRef CAS PubMed.
- J. Y. Chen, Z. H. Tang, Q. S. Lu and S. F. Zhao, J. Alloy. Comp., 2018, 756, 62 CrossRef CAS.
- Y. Li, H. C. Gao, Y. Y. Liu, L. W. Zhang and X. H. Hao, J. Mater. Sci. Mater. Electron., 2018, 29, 14528 CrossRef CAS.
- B. L. Peng, Q. Zhang, B. Gang, G. J. T. Leighton, C. Shaw, S. J. Milne, B. S. Zou, W. H. Sun, H. T. Huang and Z. L. Wang, Energy Environ. Sci., 2019, 12, 1708 RSC.
- T. M. Correia and Q. Zhang, Philos. Trans. R. Soc. A Math. Phys. Eng. Sci., 2016, 374, 2074 Search PubMed.
- Z. H. Niu, Y. P. Jiang, X. G. Tang, Q. X. Liu, W. H. Li, X. W. Lin and S. G. Lu, Mater. Res. Lett., 2018, 6, 384 CrossRef CAS.
- R. Kumar, A. Kumar and S. Singh, Sustainable Energy Fuels, 2018, 2, 2698 RSC.
- N. T. Liu, R. H. Liang, G. Z. Zhang, Z. Y. Zhou, S. G. Yan, X. B. Li and X. L. Dong, J. Mater. Chem. C, 2018, 6, 10415 RSC.
- M. Wu, D. S. Song, G. Vats, S. C. Ning, M. Y. Guo, D. W. Zhang, D. Q. Xue, S. J. Pennycook and X. J. Lou, J. Mater. Chem. C, 2018, 6, 10332 RSC.
- M. H. Park, H. J. Kim, Y. J. Kim, T. Moon, K. D. Kim, Y. H. Lee, S. D. Hyun and C. S. Hwang, Adv. Mater., 2016, 28, 7956 CrossRef CAS.
- Y. Zhao, X. H. Hao and Q. Zhang, J. Mater. Chem. C, 2015, 3, 1694 RSC.
- R. Ma, Z. Y. Zhang, K. Tong, D. Huber, R. Kornbluh, Y. S. Ju and Q. Pei, Science, 2006, 357, 1130 CrossRef.
- K. S. Sriksnth, S. Patel and R. Vaish, J. Aust. Ceram. Soc., 2017, 54, 439 CrossRef.
- Z. P. Xu, Z. M. Fan, X. M. Liu and X. L. Tan, Appl. Phys. Lett., 2017, 110, 082901 CrossRef.
- Q. L. Zhao, P. P. Tan, G. P. He, J. J. Di, D. W. Wang, L. H. Qi, H. B. Jin and M. S. Cao, J. Sol-Gel Sci. Technol., 2016, 78, 258 CrossRef CAS.
- W. Gong, J. F. Li, X. C. Chu, Z. L. Gui and L. T. Li, Appl. Phys. Lett., 2004, 85, 17 Search PubMed.
- Q. L. Zhao, H. Lei, G. P. He, J. J. Di, D. W. Wang, P. P. Tan and H. B. Jin, Ceram. Int., 2016, 42, 1314 CrossRef CAS.
- X. X. Cui, Y. Li, N. N. Sun, J. H. Du, X. W. Li, H. J. Yang and X. H. Hao, Sol. Energy Mater. Sol. Cells, 2018, 187, 9 CrossRef CAS.
- Y. Li, X. X. Cui, N. N. Sun, J. H. Du, X. W. Li, G. X. Jia and X. H. Hao, Adv. Opt. Mater., 2019, 7, 1801105 CrossRef.
- Y. Li, N. N. Sun, X. W. Li, J. H. Du, L. M. Chen, H. C. Gao, X. H. Hao and M. S. Cao, Acta Mater., 2018, 146, 202 CrossRef CAS.
- Y. Li, N. N. Sun, J. H. Du, X. W. Li and X. H. Hao, J. Mater. Chem. C, 2019, 7, 7692 RSC.
- X. L. Wang, X. H. Hao, Q. W. Zhang, S. L. An and X. J. Chou, J. Mater. Sci. Mater. Electron., 2017, 28, 1438 CrossRef CAS.
- F. Guo, X. Wu, Q. S. Lu and S. F. Zhao, Ceram. Int., 2018, 44, 2803 CrossRef CAS.
- R. Pirc1, B. Rozic1, J. Koruza1, B. Malic and Z. Kutnjak, Europhys. Lett., 2014, 107, 17002 CrossRef.
- Z. Y. Jiang, G. P. Zheng and S. Ullah, Ceram. Int., 2018, 45, 2876 CrossRef.
- M. Ye, T. Li, Q. Sun, Z. K. Liu, B. L. Peng, C. W. Huang, P. Lin, S. M. Ke, X. R. Zeng, X. Peng, L. Chen and H. T. Huang, J. Mater. Chem. C, 2016, 4, 3375 RSC.
Footnote |
| † Quanliang Zhao and Tianyu Sheng contributed equally to this work. |
|
| This journal is © The Royal Society of Chemistry 2019 |
Click here to see how this site uses Cookies. View our privacy policy here.  Open Access Article
 *a,
Tianyu Sheng†a,
Lei Panga,
Guangping Hea,
Jiejian Dia,
Lei Zhaoa,
Zhiling Hou
 b and
Maosheng Cao
 *c
*c


