
 Open Access Article
 This Open Access Article is licensed under a Creative Commons Attribution-Non Commercial 3.0 Unported Licence
Acetone fractionation: a simple and efficient method to improve the performance of lignin for dye pollutant removal
Hao Li abc,
Ze Yuana,
Yuyu Xinga,
Jiarong Lia,
Jing Fang*ac,
Lifang Changa and
Chunli Li*a
abc,
Ze Yuana,
Yuyu Xinga,
Jiarong Lia,
Jing Fang*ac,
Lifang Changa and
Chunli Li*a
aNational-Local Joint Engineering Laboratory for Energy Conservation in Chemical Process Integration and Resources Utilization, School of Chemical Engineering and Technology, Hebei University of Technology, Tianjin, China. E-mail: ctstfj@hebut.edu.cn; lichunli_hebut@126.com
bGuangdong Provincial Key Lab of Green Chemical Product Technology, Wushan Road, Guangzhou, PR China
cTianjin Key Laboratory of Chemical Process Safety, China
First published on 4th November 2019
Abstract
In this work, it was found that the adsorption capacity of lignin to cationic dye (methylene blue, MB) from aqueous solution could be significantly improved by simple acetone fractionation. The removal efficiency of MB by acetone insoluble kraft lignin (AIKL) was 10 times that of unfractionated kraft lignin (KL). And the maximum capacity of AIKL could reach up to 623.4 mg g−1. And the high removal rate could be achieved even at low concentrations. The effects of ionic strength, temperature, adsorbent dosage were systematically investigated. Adsorption kinetics showed the adsorption behavior obeyed the pseudo-second-order kinetic model. The equilibrium data was more consistent with the Langmuir isotherm model. Thermodynamic analyses proved that the adsorption was a spontaneous and endothermic physisorption process. In addition, the reasons for the enhanced adsorption effect by fractionation were clarified based on characterization by FT-IR. The enhancement of π–π interaction between AIKL and MB caused by fractionation plays an important role in the adsorption process.
1. Introduction
The discharge of wastewater containing dyes is a key environmental challenge.1 Not only do they cause damage to the ecosystem but they are also harmful to human beings.2 Methylene blue (MB) is one of the most commonly used cationic dyes.3 It could cause many harmful effects on human beings, such as nausea, mental confusion, jaundice, quadriplegia and tissue necrosis.4 Consequently, MB must be removed from wastewater effluents before discharging.Various techniques have been used to remove dyes that include biodegradation, flocculation–coagulation, chemical oxidation, ion-exchange, reverse osmosis, ultrafiltration and adsorption.5–9 Among these techniques, adsorption is considered to be efficient and economical.10–12 Activated carbon was a commonly adsorbent for dye removal,13 while the high cost limited its application on a larger scale.14
Recently, low cost adsorbents have been developed such as natural materials, agricultural by-products and industrial solid wastes.15–19 Especially, they were more suitable for treating solutions containing dilute MB concentrations.20 Due to the advantages of low cost, biodegradability, usability, renewability and high adsorption efficiency, they are considered promising potential alternatives to conventional methods of removing MB.
Lignin is considered as an excellent candidate among the low-cost class.21–23 It is one of the most abundant natural polymers, second only to cellulose.24 Many researchers have reported the feasibility of using various lignin as the precursors of absorbents for MB removal. A formaldehyde modified formic lignin and a lignin–chitosan extruded blends25 shown the adsorption capacity of about 35 mg g−1 for MB. Alkali extracted lignin, chitosan–kraft lignin composites,26 and the activated carbon27 prepared from lignin exhibited higher adsorption capacity among 121–147 mg g−1. After deacetylated and fractionated, the adsorption capacity of acetic acid lignin for MB increased from 18 to 63 mg g−1.28 The sulfonate lignin-based hydrogels were prepared by grafting sulfonic groups on KL and the adsorption capacity could been improved to 495 mg g−1.29
However, kraft technology was used by mostly pulp mills for pulp production, and thus KL is easier to use for value-added production.30 Although KL can be directly used as a promising adsorbent owing to their insolubility in water, its application for MB adsorption did not arouse much attention. To our delight, the authors recently found that the performance of KL for MB removal could be significantly enhanced just by easy fractionation with acetone.
Acetone was extensively used to dissolve lignin as a facile solvent. As we know, the acetone soluble kraft lignin (ASKL) has been widely reported in many applications, due to the soluble lignin is easier to process and react chemically in solution. For example, ASKL could improve the thermal stability of its blends with polyethylene, due to the better antioxidant activity.31 Also, ASKL is more easily to form lignin colloidal spheres with high sun protection factor.32 ASKL shown its tremendous potential for thermoplastic materials relations.33 Comparing to the reports for the application of ASKL, the application of AIKL is rarely reported. Obviously, the usage of AIKL could improve the utilization efficiency for the all-components of lignin. As a biosorbent coming from the abandoned biomass, AIKL was obtained just by a simple physical chemistry process without any chemical modification. Thus, it has the advantage of cost effective, biodegradability, high usability, minimization of waste, in addition to good adsorption efficiency.
In this study, KL was fractionated by acetone to ASKL and AIKL. Then, the first application of the AIKL, as an adsorption material for MB was investigated. The influence of adsorption parameters such as initial dye concentration, contact time, temperature, ionic strength was investigated. The adsorption process was studied by equilibrium data on batch adsorption, and the adsorption kinetics were calculated to establish the efficiency of AIKL. The adsorption behavior of KL and ASKL were also reported as reference. The interactions between the lignin and MB was investigated by FTIR, and then the reason for the performance improvement by solvent fractionation was deduced.
2. Materials and methods
2.1. Materials
KL (softwood), purchased from the Quanlin Paper Mill in Shandong Province of China, was obtained from the straw. Cationic dye MB was supplied by Tianjin Fenghua Chemical Reagent Technology Co., Ltd. All the reagents were analytical reagent grade and working solutions were prepared by distilled water.2.2. Methods
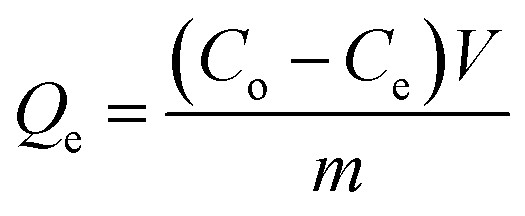 | (1) |
In the solution with methylene blue concentration of 120 mg L−1 at 30 °C, the lignin concentration was changed from 0.1 g L−1 to 12.0 g L−1 to investigate the effect of the amount of adsorbent to adsorption capacity of MB. Under the same experimental conditions, the influences of adding one electrolytes (NaCl) were investigated. The MB adsorption effected by temperature were measured in three different temperature (30, 40 and 50 °C). The MB adsorption kinetics were measured in 30 °C, samples collection time is from 5 minutes to 24 hours. The adsorption isotherms were measured at 30 °C, the contact time was 24 h, and the initial MB concentration was in the range from 10 to 300 mg L−1.
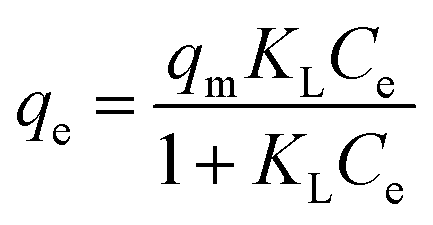
2.2.3.1. Langmuir isotherm model. The Langmuir and Freundlich models were used to interpret the equilibrium absorption data, respectively.
The Langmuir expression and its linearized form are calculated according to the following equations:
 | (2) |
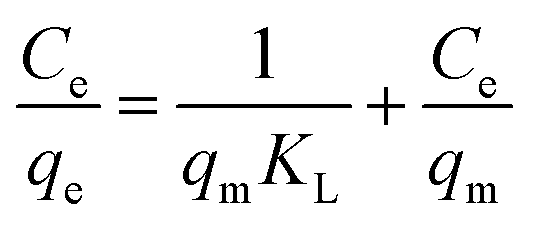 | (3) |
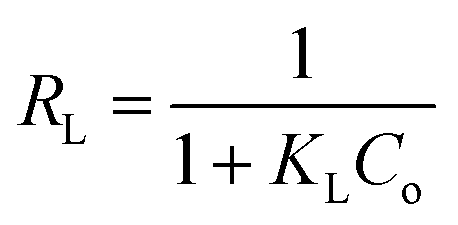 | (4) |
2.2.3.2. Freundlich isotherm model. The Freundlich expression and its linearized form are calculated according to the following equations:
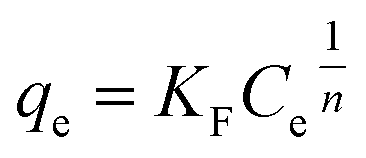 | (5) |
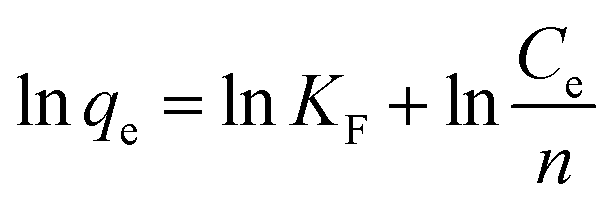 | (6) |
![[thin space (1/6-em)]](https://www.rsc.org/images/entities/char_2009.gif) qe versus lnCe shows a straight line, where KF and 1/n are determined by intercept and slope respectively.
qe versus lnCe shows a straight line, where KF and 1/n are determined by intercept and slope respectively.
|
ln(qe − qt) = lnqe − k1t
| (7) |
 | (8) |
 | (9) |
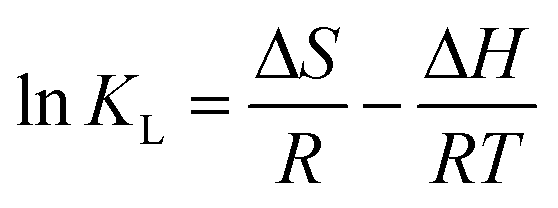
KL vs. T−1, respectively.The Gibbs energy change, ΔG (J mol−1), was estimated from the following relationship:
|
ΔG = −RTlnKL
| (10) |
3. Results and discussion
3.1. Effects of adsorbent dosage and treating effect
Fig. 1 shows the effects of the sample dosage of KL, ASKL and AIKL on MB adsorption. The removal rate of MB increased with the increasing adsorbent dosage because of the increase of the binding sites in adsorption. And the adsorption capacity of MB decreases with increasing adsorbent. This is owing to the higher adsorbent dosage could provide a large excess of the active sites which causing a decrease in the utility of active sites. Obviously, AIKL is superior to KL and ASKL in MB removal under the lower dosage. The removal rate of MB by AIKL could approached 100% when the dosage was 1.8 g L−1. However, for the same removal rate, no less than 11 g L−1 of KL was needed. And the removal rate of MB was only 44% while the dosage of ASKL was up to 10 g L−1. It means that, compared to KL and ASKL, only a little AIKL was needed for MB removal.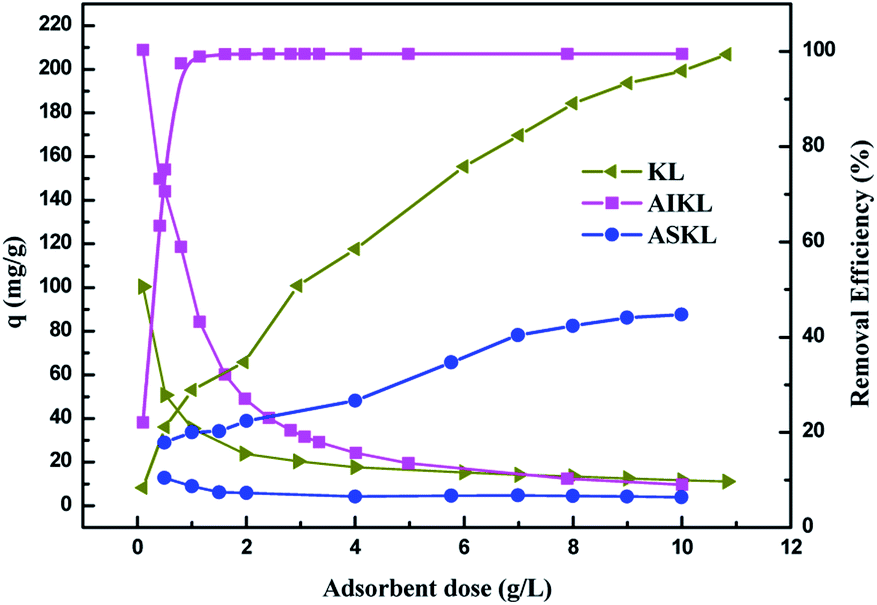 | ||
| Fig. 1 Effect of the adsorbent dosage on the adsorption of MB (initial CMB: 0.12 g L−1, temp.: 30 °C). | ||
From UV-vis spectra (Fig. 2), the characteristic peaks of the MB show obvious decrease or completely disappear after removal by the three samples at the same dosage. Meantime, the colour of solution (inset of Fig. 2) were also getting lighter. Especially, the solutions treated by AIKL were almost completely decolorized, indicating the most efficient removal of the MB from water.
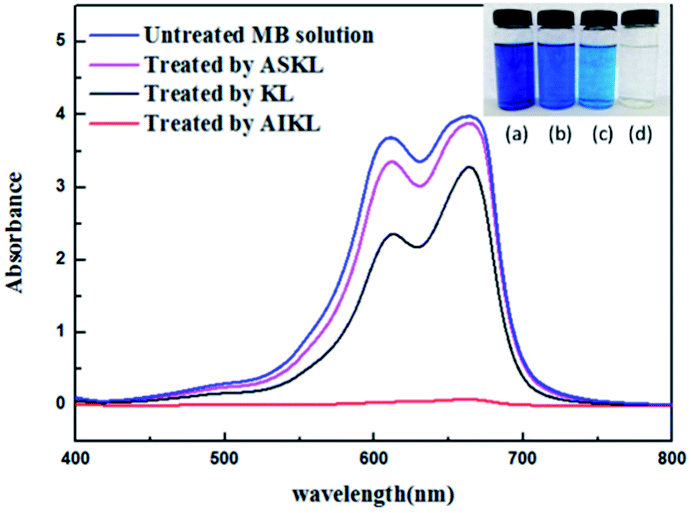 | ||
| Fig. 2 UV-vis absorption spectra of the MB solution before and after treating. Inset: color of MB solution adsorbed by: (a) the control, (b) ASKL, (c) KL, (d) AIKL. | ||
3.2. Adsorption kinetics
The time-dependent absorption of MB on three kinds of lignin samples were measured, and results are presented in Fig. 3. The adsorption of MB on the three samples start out fast, then slow down and finally reach to equilibrium. Steep slope of MB adsorption on the three samples at the initial period indicated the instantaneous adsorption which might be due to the abundant adsorption sites for MB.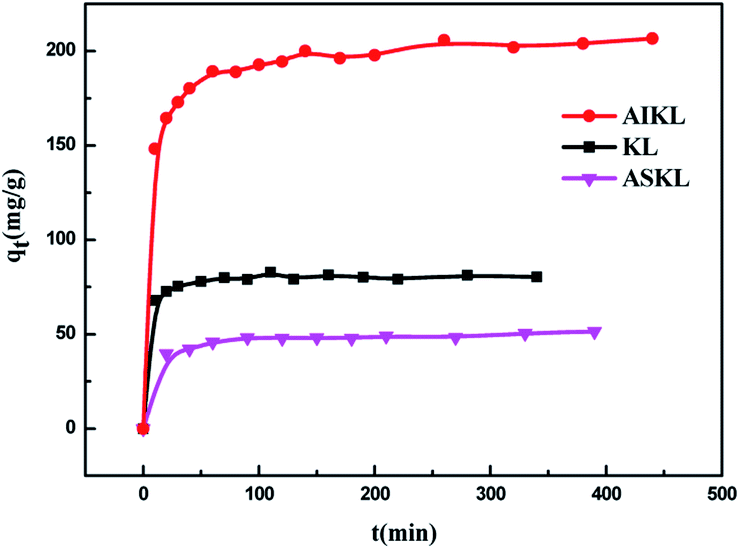 | ||
| Fig. 3 Effect of contact time on the adsorption of MB onto KL, ASKL and AIKL at 30 °C. | ||
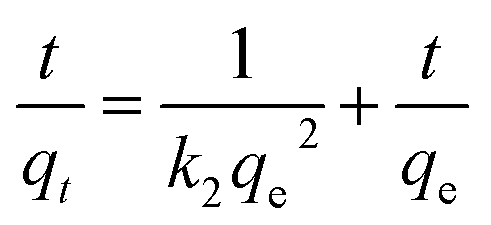
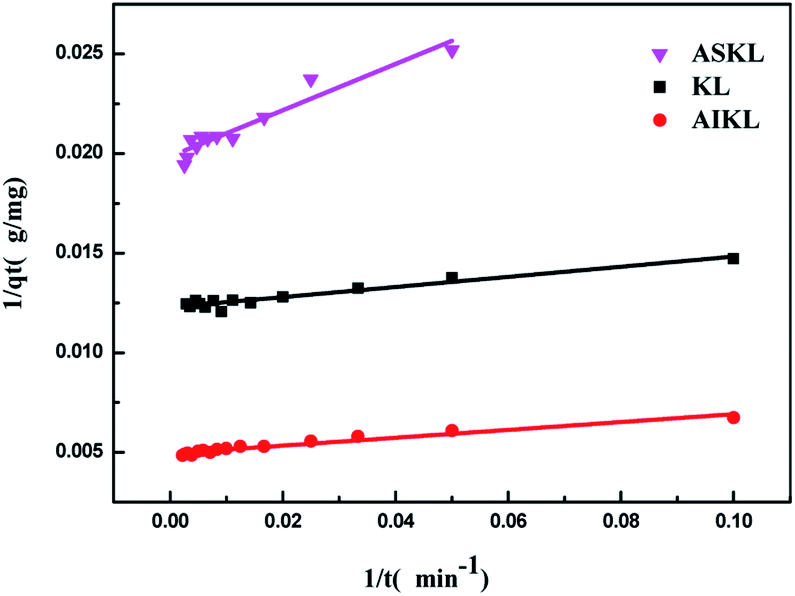
The values of k1 was calculated by the plots of ln(qe − qt) versus t (Fig. 5). The linear plots of t/qt versus t (Fig. 4), and values of k2 and qe were calculated from the intercept and slope of the plots. The experimental adsorption capacities and characteristic parameters calculated were shown in Table 1. The correlation coefficients (R2) for pseudo-second-order kinetics were better than that for pseudo-first-order kinetics. Furthermore, the qe calculated from pseudo-second-order kinetic model was more consistent with the experimental data (qex) than the pseudo-first-order kinetic model. Thus, the pseudo-second-order kinetics could describe the adsorption process more reasonably in comparison to the pseudo-first-order models.
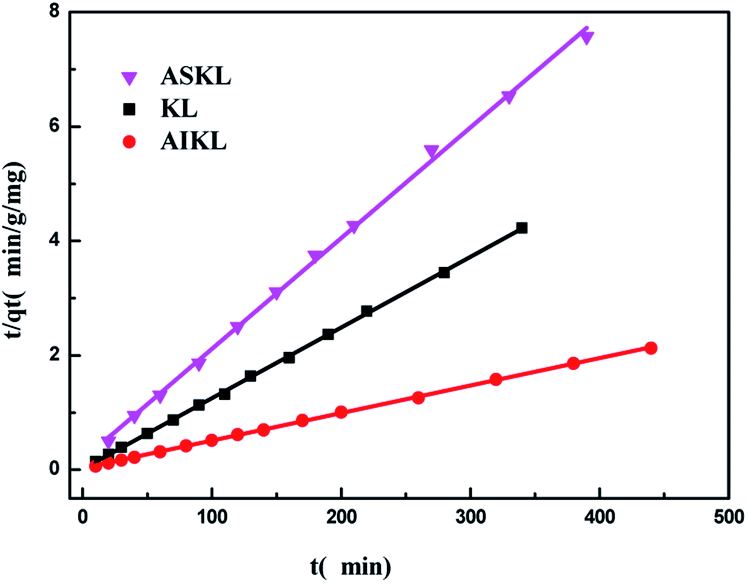 | ||
| Fig. 4 Second-order kinetic equation for adsorption of methylene blue on to KL, ASKL and AIKL. | ||
 | ||
| Fig. 5 Pseudo-first-order kinetic fit curve of MB adsorption on AIKL, KL and ASKL. | ||
| Sorbent | Pseudo-first-order | Pseudo-second-order | |||||
|---|---|---|---|---|---|---|---|
| k1 (min−1) | qe (mg g−1) | R2 | qex | k2 (g mg−1 min−1) | qe (mg g−1) | R2 | |
| AIKL | 3.9939 | 202.4291 | 0.9499 | 206.6405 | 0.0007 | 207.9002 | 0.9997 |
| KL | 2.0717 | 81.4332 | 0.9293 | 80.3529 | 0.0084 | 80.9717 | 0.9996 |
| ASKL | 5.8524 | 50.3778 | 0.9113 | 51.4837 | 0.0021 | 51.6796 | 0.9985 |
From Fig. 3, the time required for ASKL and KL to reach the adsorption equilibrium was less than AIKL. The adsorption process of MB on AIKL in the following stage need a relative long time. Also, the values of k2 for KL and ASKL was higher than AIKL, indicating the adsorption process of the latter system was slow.
As a matter of fact, AIKL is easier to form larger aggregates due to it is more hydrophobic. Thus, there are more inner cavities or porous structures formed by aggregation. The adsorption sites in the inner space of AIKL aggregates was more tough to contact MB, resulting in the longer adsorption equilibrium time and a lower adsorption rate.
3.3. Adsorption isotherms
Fig. 6 shows the adsorption isotherms of MB on KL, AIKL and ASKL and the uniformity and non-uniformity of adsorbent surface can be obtained by its shape. The adsorption capacity of MB on the three samples all increased with the increase of the equilibrium concentration and finally reached the saturation value. At the same equilibrium concentration, the adsorption capacity of MB on AIKL is much higher than that of KL, while the adsorption capacity of MB on ASKL is a little lower than KL. It is noteworthy that the absorption amount of MB on AIKL increased almost vertically with initial lower dye concentration, making the AIKL have the advantage of removing lower concentration wastewater.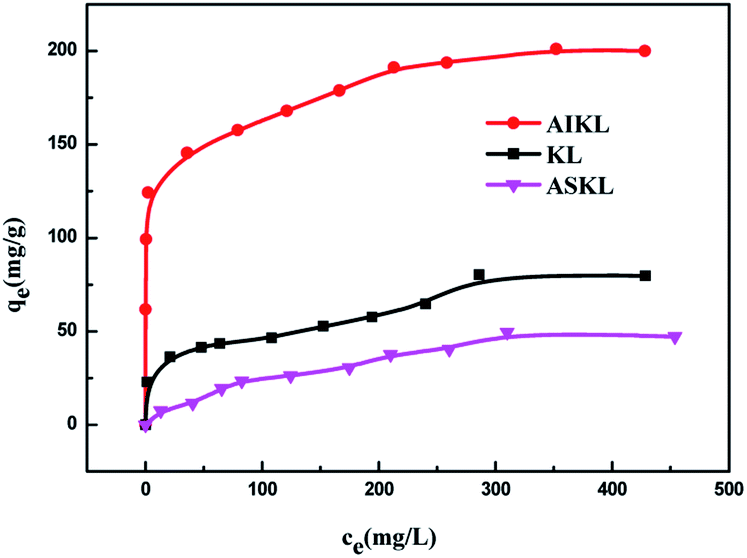 | ||
| Fig. 6 Isotherms of MB adsorption onto KL, AIKL and ASKL at 30 °C. | ||
Fig. 7 shows the Langmuir plot for the adsorption of MB onto AIKL, KL and ASKL, from the linearized Langmuir equation. The Langmuir constants KL and qm are shown in Table 2, the equilibrium data has a higher correlation coefficient and well adapted of Langmuir model. The adsorption isotherm data was also analyzed by Freundlich model, but its poor fit (Table 2) indicated that it was not suitable for MB/lignin system.
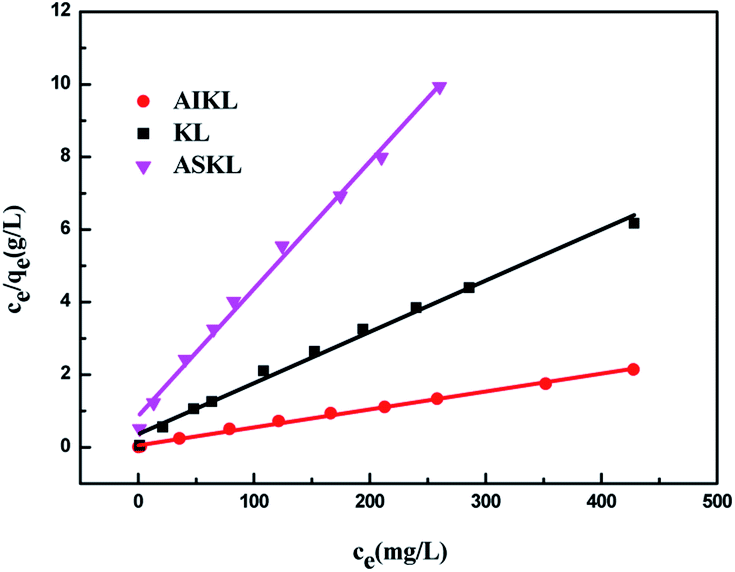 | ||
| Fig. 7 Langmuir plot of adsorption of MB onto KL, ASKL and AIKL. | ||
| Sorbent | Langmuir isotherm parameters | Freundlich isotherm parameters | |||||
|---|---|---|---|---|---|---|---|
| qm (mg g−1) | KL (L mg−1) | R2 | RL | KF (mg1−1/n L1/n g−1) | n | R2 | |
| AIKL | 200.0000 | 0.1042 | 0.9933 | 0.0188–0.1610 | 91.9741 | 7.800 | 0.9318 |
| KL | 79.9361 | 0.0398 | 0.9910 | 0.0537–0.3620 | 21.2886 | 4.587 | 0.9453 |
| ASKL | 49.8753 | 0.0233 | 0.9940 | 0.0789–0.4615 | 1.3265 | 1.713 | 0.9753 |
Due to the better fits with Langmuir isotherm, the adsorption of MB onto the three adsorbents was monolayer physical adsorption on homogeneous surfaces.
The separation factor RL, calculated by eqn (4), was the dimensionless parameter of the adsorption intensity. The type of the isotherm was either unfavorable (RL > 1), linear (RL = 1), favorable (0 < RL < 1) or irreversible (RL = 0) could be inferred by the value of RL (eqn (4)). For adsorption of MB onto three adsorbents in this study, all the RL values (Table 2) are in the range of 0.0188 to 0.4615, indicating the adsorption is a favorable process.
MB adsorption had been studied by a variety of different adsorbents. MB adsorption had been studied by a variety of different adsorbents. Table 3 compared the maximum adsorption capacity of MB for various biomass adsorbents. Compared with the other modified natural materials such as banana pseudostem, Platanus orientalis leaf and Luffa cylindrica fibers,37–39 the advantage of AIKL is that the aromatic ring of lignin could have π–π interaction with MB which is beneficial to the adsorption. As for lignin-based hydrogels prepared by crosslinking poly used methyl vinyl ether co-maleic acid,35 the preparation of AIKL only requires one step of dissolution, the entire process is simple to operate and can be easily scalable.
| Adsorbent | Adsorption capacity (mg g−1) | Reference |
|---|---|---|
| AIKL | 200.00 | This work |
| Lignin–chitosan composite | 36.25 | 25 |
| Lignin–silica composite | 60.00 | 34 |
| Lignin-based hydrogels | 69 to 629 | 35 |
| Sawdust | 27.78–59.17 | 36 |
| Kapok fiber | 110.13 | 14 |
| Platanus orientalis leaf | 114.94 | 37 |
| Luffa cylindrica fibers | 122.00 | 38 |
| Activated carbon prepared from lignin | 147.00 | 27 |
| Banana pseudostem biochar | 146.23 | 39 |
Although its adsorption capacity is not the highest, it possesses the merits of renewable and easy to mass produce. Thus, AIKL could be a promising low-cost adsorbent for MB removal from solution.
According to the Langmuir equation, the maximum uptake capacity of MB on AIKL were 200.0 mg g−1. While, the saturated adsorption capacity of KL and ASKL were 79.9 mg g−1 and 49.9 mg g−1, respectively. The saturated adsorption capacity of AIKL for MB increased about 2.5 times than KL. It is worth nothing that, the data of adsorption capacities for the three samples could not be explained by the conservation of mass. When the KL was fractionated by acetone, the yields of ASKL and AIKL were 46.7% and 53.3%, respectively. If we sum up the adsorption capacities ASKL and AIKL in proportion, that is:
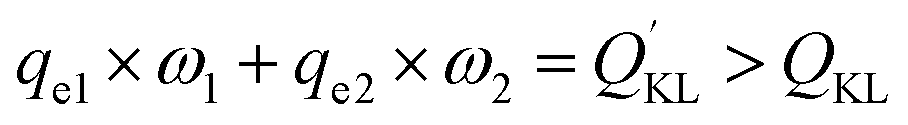
 represents the adsorption capacity calculated by mass conservation. QKL is the adsorption capacity of KL. It could be found
  (118.6 mg g−1) is much larger than QKL (79.9 mg g−1). Obviously, this did not obey the mass conservation. Thus, there must be some underlying reasons for explain this unpredictable result, which was described in the following paragraphs.
3.4. Effects of operating conditions on MB adsorption
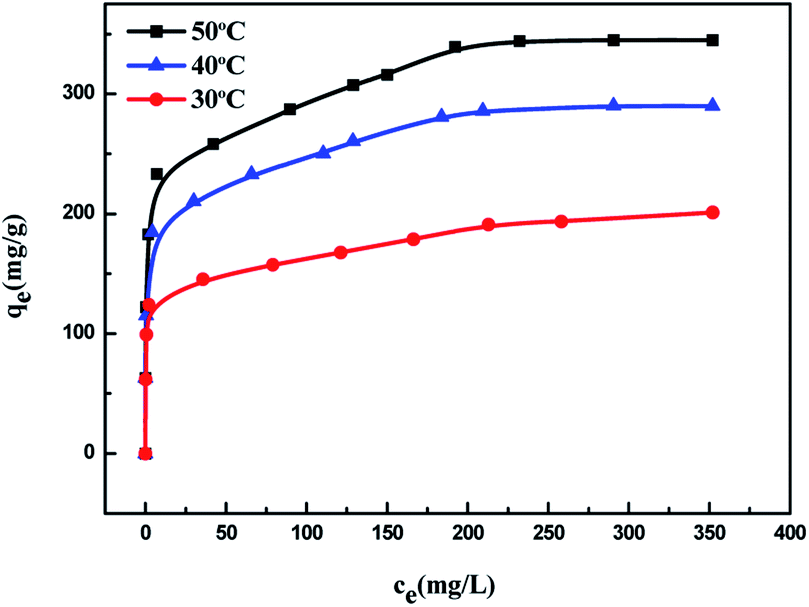 | ||
| Fig. 8 Effect of the temperature on the adsorption of MB. | ||
| ΔH (kJ mol−1) | ΔS (J mol−1 K−1) | ΔG (kJ mol−1) | ||
|---|---|---|---|---|
| 303 K | 313 K | 323 K | ||
| 74.3996 | 10.8422 | −11.7051 | −12.4357 | −13.1937 |
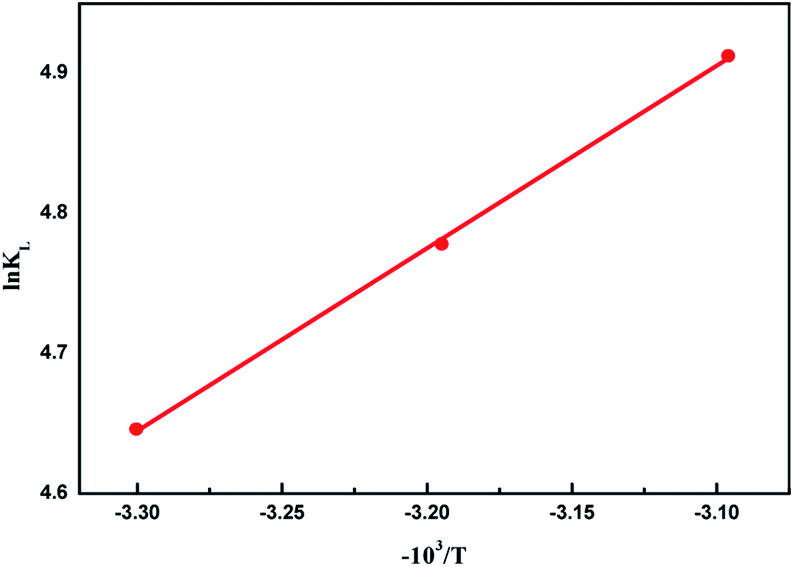 | ||
| Fig. 9 Thermodynamic plots for the adsorption of MB onto AIKL. | ||
The positive enthalpy changes suggest that the adsorption process of MB onto AIKL is endothermic. Generally, adsorption was exothermic processes due to the binding of solute and adsorbent, and the adsorption capacity decreases with the increase of temperature. A reasonable explanation for the positive enthalpy changes of this system was the high energy water molecules were released from the desolvation of MB and AIKL. As we know, the high-energy water molecules were released from the cavity upon polycyclic aromatic compounds, leads to the endothermic reaction. Increasing the temperature could reduce of hydration layer remarkably, resulting the enhance of hydrophobic interaction which could increase the adsorption capacity.
This opinion could be further confirmed by the positive value of the entropy change (ΔS). It indicates that the adsorption of MB on AIKL was completely driven by the entropic increase (Table 4) which is a typical characteristic of hydrophobic interaction in adsorption.41 Thus, the hydrophobic interaction could be considered as one of the main binding contributions for the adsorption of MB onto AIKL.
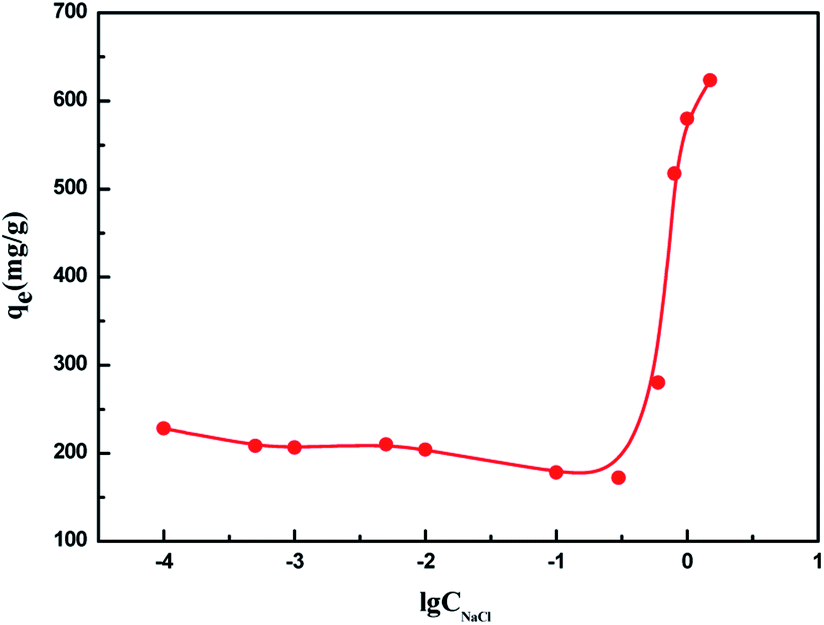 | ||
| Fig. 10 Effects of ionic strength (NaCl concentration) on the adsorption of MB. | ||
When the NaCl was added to the solution, it would screen the charges of MB and AIKL, and thus inhibits the cation–anion interactions between them. So, NaCl plays an adverse effect on the electrostatic attraction for MB adsorption. When enough salt was added, the electrostatic attraction between MB and AIKL becomes negligible. However, the adsorption amount increased obviously. It indicated that there must exist some other important driving forces besides the electrostatic interaction. As we know, the increase of ionic strength could reduce the barrier of the hydration layer,43 and the hydration layer barriers the combination of MB and AIKL molecules by hydrophobic interaction. Thus, the experimental results further proved that the hydrophobic interaction was beneficial to the adsorption.
3.5. Strengthening mechanism of acetone fractionation
As discussed in the effect of solvent conditions above on, the electrostatic attraction and hydrophobic interaction were the two main forces of adsorption. As we know, after acetone fractionation, due to the reduction of phenolic hydroxyl (–OH) and carboxyl groups (–COOH), AIKL has fewer negative charges than ASKL and KL.44 Interestingly, AIKL with fewer negative charge has much higher adsorption capacity. Thus, the electrostatic attraction may not play a central role for the adsorption between lignin and MB. While, the hydrophobic interaction may play the dominant role.The band around 1460 cm−1 of these lignin samples, ascribed to vibration of aromatic ring, all shifted to low wavenumber when MB was adsorbed on them. And the main aromatic peaks of these samples, before and after adsorption, were listed in Table 5. The shifts in the main aromatic peak position to lower wavenumber in vibrational spectroscopy provides direct evidence for π–π interactions. Moreover, the peaks around 1460 cm−1 of AIKL caused by MB adsorption shift about 6.04 cm−1, while, it is only 1.52 cm−1 for KL and 0.46 for ASKL. This information indicated that the π–π interactions of AIKL-MB is stronger than that KL-MB.
| Before and after adsorbed by AIKL | |||
|---|---|---|---|
| Adsorbent | Unloaded by MB (cm−1) | Loaded by MB (cm−1) | Δ (cm−1) |
| KL | 1461.44 | 1459.92 | −1.52 |
| ASKL | 1462.54 | 1463.00 | 0.46 |
| AIKL | 1458.67 | 1452.63 | −6.04 |
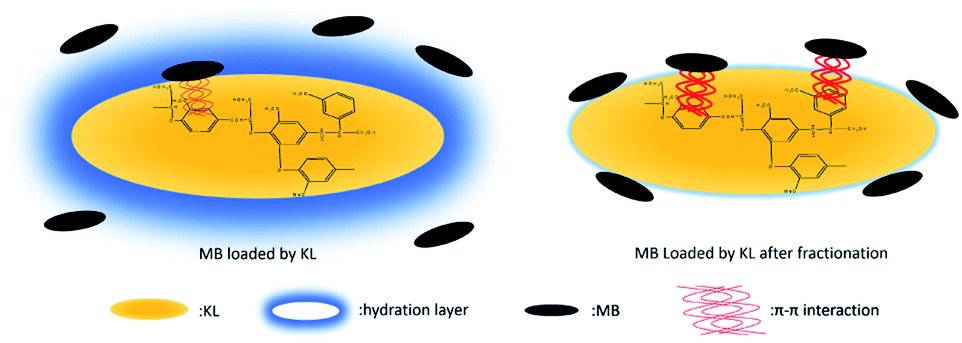
Indeed, the π–π interactions between AIKL and MB not only can be confirmed by the results of FT-IR, but also could be explained reasonably (Fig. 11). The strengthening mechanisms of acetone fractionation were schematically described in Fig. 12. The MB is an ideal planar molecule which has C–C double bonds and contains π-electrons. The aromatic rings of lignin are oriented preferentially parallel to the surface. Also, the associated KL complexes is a flexible lamellar configuration. Obviously, this spatial structure feature of lignin could contribute to the formation of π–π stacking between MB and lignin. The similar π–π electron donor acceptor interaction also play an important role when MB were adsorbed onto graphene oxide45 and carbon nanotubes.42
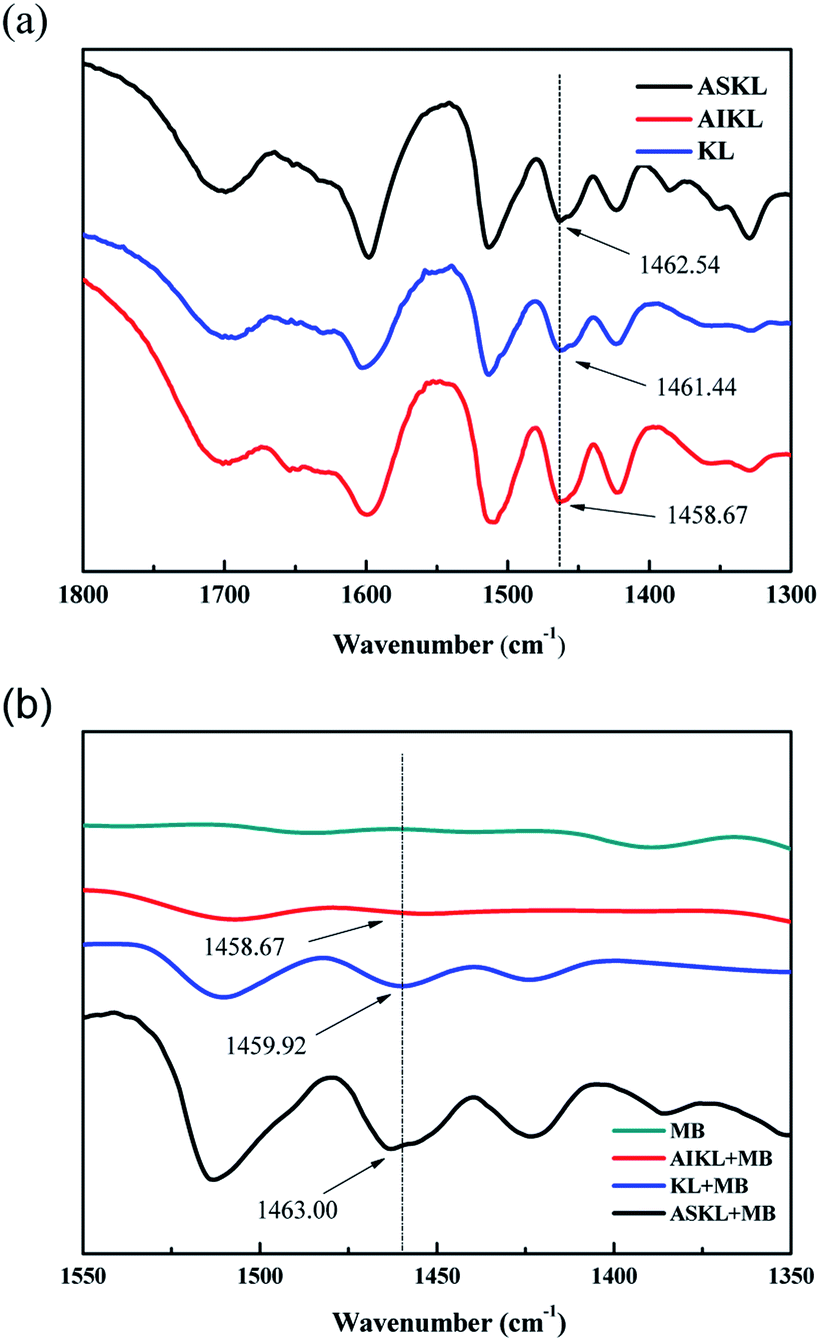 | ||
| Fig. 11 FTIR spectra of KL, ASKL and AIKL (a); and KL, ASKL and AIKL after MB loading (b). | ||
 | ||
| Fig. 12 Schematic illustration of enhanced adsorption after acetone grading. | ||
It is reported that, the lignin after fractionation by acetone-aqueous solution of different concentrations, the molecular weight of lignin decreases with the decrease of acetone concentration, and the content of phenolic hydroxyl group and carboxyl group increases.44,46,47 And the AIKL with higher molecular weight after fractionation tend to have more aromatic groups.48 On the one side, more aromatic groups could provide more effective adsorption sites for the reception of MB by π–π interactions. On the other side, less phenolic hydroxyl and carboxyl groups could reduction the hydration layer which was beneficial to the π–π interaction between AIKL and MB aromatic rings. By the promotion of these two reasons, the performance of AIKL has been significantly improved.
4. Conclusions
In summary, the surface properties of KL were obviously improved by solvent fractionation treatment. The reduction of hydration layer on AIKL surface was beneficial to the π-electron coupling between the aromatic molecules of MB and AIKL. The increase of ionic strength and temperature would cause the reduction of hydration layer which lead to the increase of adsorption capacity. Compared to other adsorbents, AIKL has advantage of inherent adsorption ability for aromatic compounds through stronger π–π interaction. Therefore, the fractionated AIKL adsorbents derived from abundant, low-cost and non-toxic KL, would be a promising adsorbent for aromatic pollutants removal in wastewater.Conflicts of interest
There are no conflicts to declare.Acknowledgements
We are grateful for financial support from the National Natural Science Foundation of China (21808047), the High-level Personnel Foundation of Hebei Province (A2017002032), the Outstanding Young Scholars Program in Universities of Hebei, China (BJ201615), the Natural Science Foundation of Hebei, China (B2017202087), the Research Fund Program of Guangdong Provincial Key Lab of Green Chemical Product Technology, China (GC201805).References
- X. Wang, C. Jiang, B. Hou, Y. Wang, C. Hao and J. Wu, Chemosphere, 2018, 206, 587–596 CrossRef CAS.
- H. Li, S. Xu, J. Du, J. Tang and Q. Zhou, RSC Adv., 2019, 9, 941–942 Search PubMed.
- H. Deng, J. Lu, G. Li, G. Zhang and X. Wang, Chem. Eng. J., 2011, 172, 326–334 CrossRef CAS.
- J. Yi and L. Zhang, Bioresour. Technol., 2008, 99, 2182–2186 CrossRef CAS.
- G. Li, W. Zhu, C. Zhang, S. Zhang, L. Liu, L. Zhu and W. Zhao, Bioresour. Technol., 2016, 206, 16–22 CrossRef CAS PubMed.
- K. Jung, B. H. Choi, M. Hwang, T. Jeong and K. Ahn, Bioresour. Technol., 2016, 219, 185–195 CrossRef CAS.
- M. T. Yagub, T. K. Sen, S. Afroze and H. M. Ang, Adv. Colloid Interface Sci., 2014, 209, 172–184 CrossRef CAS PubMed.
- L. Shi, D. Wei, H. H. Ngo, W. Guo, B. Du and Q. Wei, Bioresour. Technol., 2015, 194, 297–304 CrossRef CAS.
- C. Li, Y. He, L. Zhou, T. Xu, J. Hu, C. Peng and H. Liu, RSC Adv., 2018, 8, 41986–41993 RSC.
- B. Li, J. Lv, J. Guo, S. Fu, M. Guo and P. Yang, Bioresour. Technol., 2019, 275, 360–367 CrossRef CAS.
- Y. Jin, C. Zeng, Q. Lü and Y. Yu, Int. J. Biol. Macromol., 2019, 123, 50–58 CrossRef CAS.
- J. Liu, Y. Du, W. Sun, Q. Chang and C. Peng, RSC Adv., 2019, 9, 22513–22522 RSC.
- C. Chen, S. Mi, D. Lao, P. Shi, Z. Tong, Z. Li and H. Hu, RSC Adv., 2019, 9, 22248–22262 RSC.
- Y. Liu, J. Wang, Y. Zheng and A. Wang, Chem. Eng. J., 2012, 184, 248–255 CrossRef CAS.
- M. S. Ur Rehman, I. Kim and J. Han, Carbohydr. Polym., 2012, 90, 1314–1322 CrossRef.
- A. Bhatnagar and M. Sillanpaa, Chem. Eng. J., 2010, 157, 277–296 CrossRef CAS.
- X. Han, W. Wang and X. Ma, Chem. Eng. J., 2011, 171, 1–8 CrossRef CAS.
- S. Zhao and T. Zhou, Bioresour. Technol., 2016, 219, 330–337 CrossRef CAS.
- M. T. Islam, R. Saenz-Arana, C. Hernandez, T. Guinto, M. A. Ahsan, H. Kim, Y. Lin, B. Alvarado-Tenorio and J. C. Noveron, RSC Adv., 2018, 8, 32545–32557 RSC.
- M. Rafatullah, O. Sulaiman, R. Hashim and A. Ahmad, J. Hazard. Mater., 2010, 177, 70–80 CrossRef CAS.
- J. Li, Y. Li, Y. Wu and M. Zheng, J. Hazard. Mater., 2014, 280, 450–457 CrossRef CAS.
- Y. Ge and Z. Li, ACS Sustainable Chem. Eng., 2018, 6, 7181–7192 CrossRef CAS.
- X. Wang, Y. Wang, S. He, H. Hou and C. Hao, Ultrason. Sonochem., 2018, 40, 221–229 CrossRef CAS.
- Z. Li, Y. Kong and Y. Ge, Chem. Eng. J., 2015, 270, 229–234 CrossRef CAS.
- A. B. Albadarin, M. N. Collins, M. Naushad, S. Shirazian, G. Walker and C. Mangwandi, Chem. Eng. J., 2017, 307, 264–272 CrossRef CAS.
- V. Nair, A. Panigrahy and R. Vinu, Chem. Eng. J., 2014, 254, 491–502 CrossRef CAS.
- A. Kriaa, N. Hamdi and E. Srasra, Russ. J. Phys. Chem. A, 2011, 85, 279–287 CrossRef CAS.
- Q. Feng, H. Cheng, F. Chen, X. Zhou, P. Wang and Y. Xie, J. Wood Chem. Technol., 2016, 36, 173–181 CrossRef CAS.
- J. Li, H. Li, Z. Yuan, J. Fang, L. Chang, H. Zhang and C. Li, Int. J. Biol. Macromol., 2019, 135, 1171–1181 CrossRef CAS.
- T. Aro and P. Fatehi, ChemSusChem, 2017, 10, 1861–1877 CrossRef CAS.
- H. Sadeghifar and D. S. Argyropoulos, ACS Sustainable Chem. Eng., 2015, 3, 349–356 CrossRef CAS.
- Y. Qian, Y. Deng, X. Qiu, H. Li and D. Yang, Green Chem., 2014, 16, 2156 RSC.
- S. Sen, S. Patil and D. S. Argyropoulos, Green Chem., 2015, 17, 1077–1087 RSC.
- T. M. Budnyak, S. Aminzadeh, I. V. Pylypchuk, D. Sternik, V. A. Tertykh, M. E. Lindström and O. Sevastyanova, J. Environ. Chem. Eng., 2018, 6, 4997–5007 CrossRef CAS.
- J. Domínguez-Robles, M. S. Peresin, T. Tamminen, A. Rodríguez, E. Larrañeta and A. Jääskeläinen, Int. J. Biol. Macromol., 2018, 115, 1249–1259 CrossRef PubMed.
- F. Ferrero, J. Hazard. Mater., 2007, 142, 144–152 CrossRef CAS.
- M. Peydayesh and A. Rahbar-Kelishami, J. Ind. Eng. Chem., 2015, 21, 1014–1019 CrossRef CAS.
- H. Demir, A. Top, D. Balkose and S. Ulku, J. Hazard. Mater., 2008, 153, 389–394 CrossRef CAS PubMed.
- S. Liu, J. Li, S. Xu, M. Wang, Y. Zhang and X. Xue, Bioresour. Technol., 2019, 282, 48–55 CrossRef CAS.
- H. Chen, J. Zhao and G. Dai, J. Hazard. Mater., 2011, 186, 1320–1327 CrossRef CAS.
- M. Chen, Y. Chen and G. Diao, J. Chem. Eng. Data, 2010, 55, 5109–5116 CrossRef CAS.
- J. Ma, F. Yu, L. Zhou, L. Jin, M. Yang, J. Luan, Y. Tang, H. Fan, Z. Yuan and J. Chen, ACS Appl. Mater. Interfaces, 2012, 4, 5749–5760 CrossRef CAS.
- X. P. Ouyang, Y. H. Deng, Y. Qian, P. Zhang and X. Q. Qiu, Biomacromolecules, 2011, 12, 3313–3320 CrossRef CAS.
- H. Sadeghifar, T. Wells, R. K. Le, F. Sadeghifar, J. S. Yuan and A. Jonas Ragauskas, ACS Sustainable Chem. Eng., 2016, 5, 580–587 CrossRef.
- T. Wu, X. Cai, S. Tan, H. Li, J. Liu and W. Yang, Chem. Eng. J., 2011, 173, 144–149 CrossRef CAS.
- J. Domínguez-Robles, T. Tamminen, T. Liitiä, M. S. Peresin, A. Rodríguez and A. Jääskeläinen, Int. J. Biol. Macromol., 2018, 106, 979–987 CrossRef PubMed.
- A. S. Jääskeläinen, T. Liitiä, A. Mikkelson and T. Tamminen, Ind. Crops Prod., 2017, 103, 51–58 CrossRef.
- L. An, G. Wang, H. Jia, C. Liu, W. Sui and C. Si, Int. J. Biol. Macromol., 2017, 99, 674–681 CrossRef CAS.
| This journal is © The Royal Society of Chemistry 2019 |