
 Open Access Article
 This Open Access Article is licensed under a Creative Commons Attribution-Non Commercial 3.0 Unported Licence
A simple and green synthesis of carbon quantum dots from coke for white light-emitting devices
Xiaoting Feng * and
Yi Zhang*
* and
Yi Zhang*
Department of Chemistry and Chemical Engineering, Lu Liang University, Lvliang 033001, China. E-mail: xiaotingfeng@llhc.edu.cn; yiyi9900474@163.com
First published on 21st October 2019
Abstract
Coke is a by-product of coal. This paper reports a simple and green chemical oxidation method for carbon quantum dots (CQDs) from coke for use in novel applications. The CQDs emit blue fluorescence and have a fluorescence quantum yield of 9.2% and blue-green-red spectral composition of 48%. A light-emitting diode (LED) was fabricated by combining the CQDs as a white-light converter with an ultraviolet chip. The Commission Internationale de L'Eclairage chromaticity coordinate (0.31, 0.35) and correlated color temperature (5125 K) of the LED are located in a cool white light zone, suggesting that they have superior potential application in lighting devices.
1. Introduction
Luminescent carbon quantum dots (CQDs), a new kind of quantum dots (QDs), have received broad attention owing to their superior properties such as variable photoluminescence (PL) behaviour, low toxicity and excellent biocompatibility.1,2 They hold great promise in many application fields such as fluorescent probes,3,4 fluorescent ink,5 bioimaging,6 solar cells,7 photocatalytic behaviour,8 and light-emitting devices.9–11Light-emitting devices (LEDs) are considered a promising substitute for conventional illumination systems owing to their small volume, high energy efficiency, low power consumption and long lifetime.12 In general, the most prevalent route for obtaining white LEDs is to combine a blue chip with a yellow-emitting phosphor.13,14 However, rare-earth phosphors have obvious drawbacks including high cost and limited resources which restrict further development.15 Semiconductor quantum dot phosphors often exhibit aggregation and environmentally unfriendly issues such as containing cadmium or other heavy metals, which largely limits their practical application.16,17 Thus, CQDs with low cost, low toxicity and broad visible light emission tend to become desirable phosphors. Recently, several white LED devices with ultraviolet (UV) chips as excitation light have also been researched. Compared with blue chips, the ultraviolet chip has higher energy to radiate phosphor, which leads to an increased emission intensity of the phosphor.
CQDs have been synthesized from various carbon-containing precursors including small organic carbon sources (e.g. phenylenediamine,18 citric acid,19,20 glucose,21 L-ascorbic acid,22 and thiosalicylic acid.23). However, the relatively high cost of mentioned carbon precursors above limits the practical applications of CQDs.
Coke is a cheap and abundant by-product obtained from coal products, which has high content of carbon and low content of ash. Coke is mainly used as a combustible energy resource. In recent years, the environmental pollution issues in the coal chemical industry have become very serious. Therefore, it is essential that clean utilization technologies for coal chemical products are developed. There are some works about coal-based CQDs. For example, Wu et al. prepared photoluminescent CQDs from petroleum coke by ultrasonic-assisted chemical oxidation method.24 Petroleum coke was oxidized first in concentrated H2SO4 and HNO3, and then functionalized by hydrothermal ammonia treatment. The resulting CQDs have excellent water solubility. Hu et al. reported a new strategy to synthesize size-controlled fluorescent CQDs from coal by a combination of carbonization and acidic oxidation etching.25 The as-prepared CQDs were used as fluorescence turn-off probe for fast detection of Cu2+ in aqueous solutions. Geng et al. developed a strategy for producing orange fluorescent CQDs from coal tar by a combination of acidic oxidation etching and solvothermal method.26 And as-fabricated CQDs exhibit low cytotoxicity and good biocompatibility with cells, making them highly potential for the in vitro and in vivo imaging applications. Although some amazing advances have been made in the applications of the CQDs from coal products, these reported preparation methods of CQDs are multi-step and involve complicated post-processing processes of removing the excess oxidizing agents. A simple and green synthetic approach and widening the application of coal-based CQDs are still in great demand.
Here we report fluorescent CQDs as a white-light converter for white LED, being prepared by a one-step and green chemical oxidation using low-cost coke as starting materials and hydrogen peroxide as oxidizing agent (Fig. 1). The excess oxidizing agent (H2O2) was removed through solution boiling without addition of bases to neutralize. The obtained CQDs are nano-sized and emit blue fluorescence. The emission spectrum of the CQDs exhibits a broad emission covering entire visible region with high blue-green-red spectral composition, which contributes to single phosphors to form white light. Ultimately, a cool white LED was constructed by combining the coke-based CQDs and UV-LED chip. The optoelectronic device application of the coke-based CQDs is demonstrated.
 | ||
| Fig. 1 Synthesis scheme of CQDs from coke and their applications in white LED. | ||
2. Experimental
2.1 Materials
Coke powders were obtained from Shanxi Datuhe Coking Co., Ltd (Shanxi, China). Hydrogen peroxide (30% wt%) was purchased from Kaitong Chemical Reagent Factory (Tianjin, China). Acetic acid (36% wt%) was acquired from Guangfu Technology Development (Tianjin, China). Dialysis bag (molecular weight cut-off 1000) was supplied by Union Carbide Corporation (USA). UV-LED chip (365 nm, 1.0 W) was provided from Guanghuashi Technology Co., Ltd (Shenzhen, China).2.2 Synthesis of CQDs
Coke powders (300 mg) were put into a mixture of H2O2 (20 mL) and H2O (30 mL) in a beaker under ultrasonic conditions for 0.5 h. The obtained mixture was heated at 40 °C under vigorous stirring conditions for 3 h. After the reaction, the solution was heated to the boiling point to remove the excess H2O2. The resulting solution was filtered using 0.22 μm polyether sulfone membranes and then purified for 12 h in a dialysis bag (Da 1000) to remove some the larger nanoparticles or impurities. The purified solution was kept for characterization such as UV absorption, photoluminescence behavior, and quantum yield measurements. Then, the purified CQDs solution was freeze-dried in a vacuum freeze dryer. The powdered CQDs were obtained and collected for characterization such as morphology, surface structure, and device performance.2.3 Device fabrication
The CQDs as a white light converter were applied to fabricate white LED devices. A few drops of CQDs/epoxy resin aquogel were dispensed into an optical lens, followed by leaving the optical lens in a vacuum chamber at 80 °C for 6 h to remove bubbles. Finally, the optical lens was solidly placed on the bottom of the UV chip with the emission wavelength centered at 365 nm.2.4 Characterization
The morphology of the CQDs was examined by transmission electron microscopy (TEM) on a JEOL JEM-2010 at an accelerating voltage of 200 kV. The surface structure of the CQDs was characterized by Fourier transform infrared (FT-IR) spectroscopy. FT-IR spectrum were recorded on a BRUKER TENSOR 27 spectrometer in the form of KBr pellets. The optical properties of the CQDs were measured on an Ultraviolet-visible (UV-vis) spectrophotometer and a luminescence spectrometer. UV-vis absorption spectrum of CQDs was obtained by a Hitachi U3900 UV-vis spectrophotometer. The PL spectra were recorded on a Horiba Fluoromax-4 luminescence spectrometer with a Xe lamp as the excitation source. The Spectra Scan PR655 was applied to analyze the correlated color temperature (CCT), emission spectra and Commission Internationale de L'Eclairage (CIE) chromaticity coordinate of the LED.2.5 Quantum yield (QY) measurements
The fluorescence QY of CQDs was determined according to an established procedure using a comparative method.27 Quinine sulfate (literature QY = 0.54) in 0.10 M H2SO4 was selected as the reference sample to determine the QY of CQDs solutions at different concentrations. All the optical absorbance values of the solutions were recorded at 360 nm excitation, which should not exceed 0.1 in order to minimize internal filter effects. The integrated fluorescence intensity is calculated according to the area under the photoluminescence curve from 380 to 700 nm. The graphs were plotted using integrated fluorescence intensity versus the absorbance. The QY of CQDs was calculated by the following equation:| Qx = Qs(kx/ks) (ηx/ηs)2 |
3. Results and discussion
The morphology of CQDs was investigated using TEM measurements. As shown in Fig. 2(a), the CQDs are spherical and well dispersed without apparent aggregation. The average particle size of CQDs was calculated to be 6.5 nm. To further investigate the chemical structure of CQDs, an FT-IR spectrum was obtained, as shown in Fig. 2(b). The broad characteristic band at 3415 cm−1 is related to the stretching vibration of O–H. The band at 1564 cm−1 originates from the stretching vibration of C![[double bond, length as m-dash]](https://www.rsc.org/images/entities/char_e001.gif) O in the carboxylic groups. The band at 1681 cm−1 corresponds to the stretching vibration of CC. The CQDs exhibited several characteristic absorption bands of C–H (2960 cm−1) and C–O–C (1267 cm−1). It can be speculated that massive hydroxyl groups are situated on the surface of the CQDs.
O in the carboxylic groups. The band at 1681 cm−1 corresponds to the stretching vibration of CC. The CQDs exhibited several characteristic absorption bands of C–H (2960 cm−1) and C–O–C (1267 cm−1). It can be speculated that massive hydroxyl groups are situated on the surface of the CQDs.
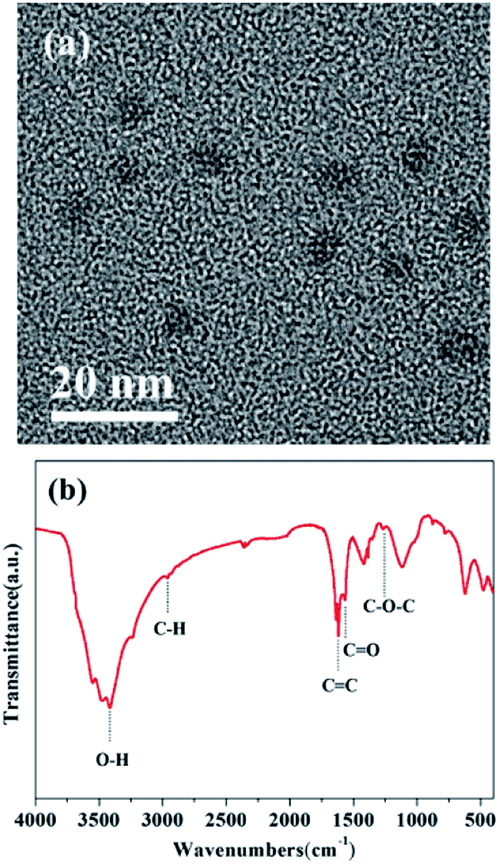 | ||
| Fig. 2 (a) TEM image of CQDs. (b) FT-IR spectrum of CQDs. | ||
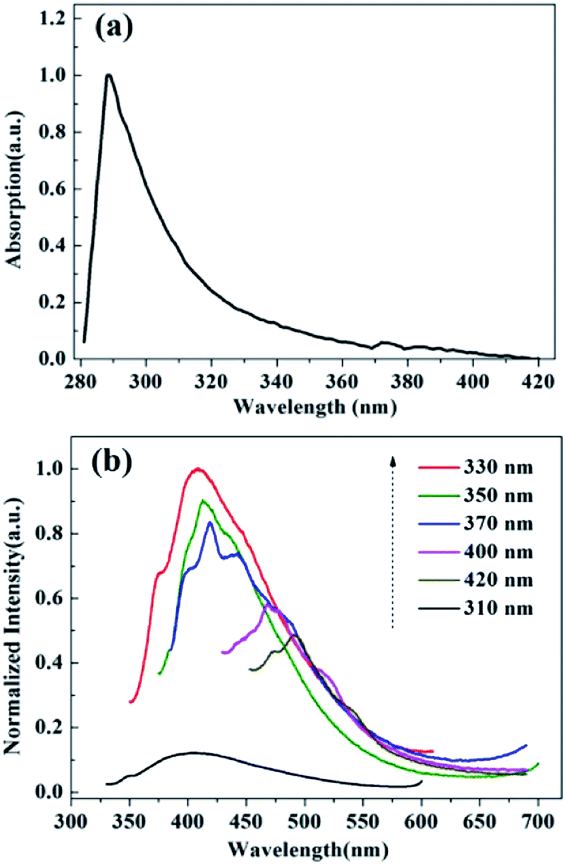
UV-vis absorption and PL spectra were investigated to explore the optical properties of the CQDs. From the UV-vis absorption spectrum (Fig. 3(a)), the peak at 289 nm is ascribed to the n → π* transition of CO, which is corresponding to the previously reported absorption peak at 279–355 nm ascribed to n → π* of CO.28,29 In Fig. 3(b), fluorescent measurements were carried out with different excitation wavelengths. As the excitation wavelength changes from 310 to 420 nm, PL emission intensity of CQDs aqueous solutions first increases in the 310–330 nm range and then gradually decreases in 330–420 nm range. When excited at 330 nm, the CQDs exhibit maximum PL emission. The maximum emission wavelength is located at 410 nm. When excited at 310 nm, the fluorescence intensity of CQDs reaches its minimum at 403 nm. The emission peak of CQDs shows red-shift with the increase in excitation wavelength. According to above-mentioned situation, the CQDs exhibit excitation-wavelength-dependent PL emission, which is contributed to different energy level structures of the CQDs.30,31 Surface states are known to induce energy level structures. The multiple energy levels in the different surface states of CQDs result in excitation-wavelength-PL property.32
 | ||
| Fig. 3 (a) UV-vis absorption spectrum of CQDs. (b) PL spectra of CQDs at different excitation wavelengths. | ||
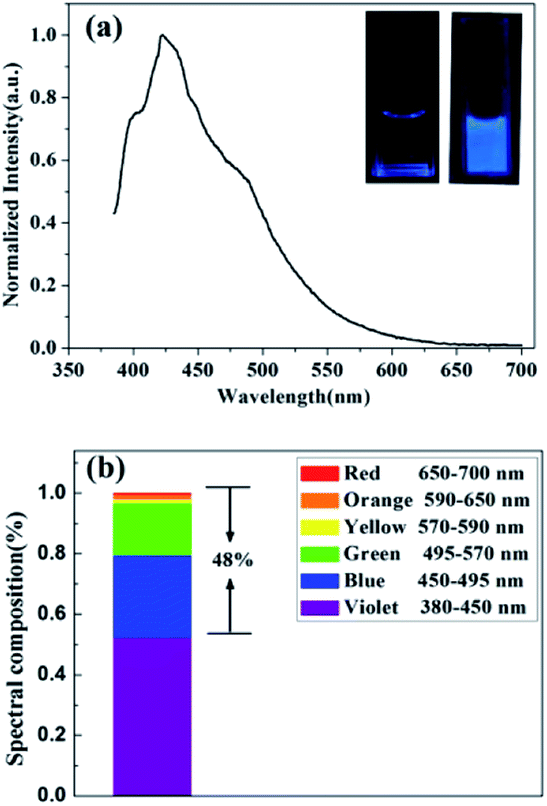
In Fig. 4(a), the CQDs aqueous solutions show a strong peak at 422 nm and broad visible light emission when excited at 365 nm. Deionized water showed no fluorescence a 365 nm UV lamp (inset, left, in Fig. 4(a)), while the CQDs aqueous solution emitted bright blue luminescence under UV light (inset, right, in Fig. 4(a)). In Fig. 4(b), then the PL spectrum under excitation of 365 nm is divided into six colors (violet for 380–450 nm, blue for 450–495 nm, green for 495–570 nm, yellow for 570–590 nm, orange for 590–650 nm, red for 650–700 nm) to measure the spectral composition of the CQDs. The spectral composition of CQDs indicates the proportion of blue-green-red spectrum can reach a rather high index of 48%, which is higher than the blue-green-red proportion value of 44% previously researched.33 A high blue-green-red spectral composition is conducive to a promotion in the efficiency of CQDs as a single white-light converter for white LED with low CCT. This phenomenon may be related to the π-electron density on the surface of CQDs. The energy gaps of the CQDs might decrease due to the existence of high π-electron density, consequently resulting in a redshift emission. As a result of this, the blue-green-red spectral composition of CQDs may increase.34,35
 | ||
| Fig. 4 (a) PL spectrum of CQDs under 365 nm, inset: photographs of deionized water (left) and CQDs in deionized water (right) under 365 nm UV light. (b) Spectral composition of CQDs. | ||
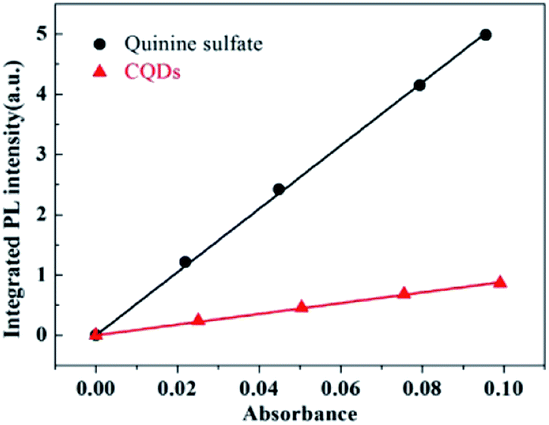
The QY of the CQDs is measured with quinine sulfate as a standard (QY = 54%).27 The relative QY of the coke-based CQDs is calculated to be 9.2% (Fig. 5), comparable to QY values of other coal-based CQDs (QY, usually less than 15%)24,25. Some researchers consider QY are dependent on the probability of electron–hole radiative recombination from the excited state to ground state.36 There remains broad research space for QY of coke-based CQDs.
 | ||
| Fig. 5 QY measurement of CQDs. | ||
To explore the potential of the coke-based CQDs which have exhibited excellent optical properties, we have fabricated a white LED with UV chip as excitation light and the obtained coke-based CQDs as a white light converter. Fig. 6(a) shows a cross-section view of the LED based on coke-based CQDs. It can be seen that the LED is basically fabricated with gold wires, electrodes, a lens and UV chip. Coke-based CQDs as a light converter are coated onto the inner wall of the lens. The ends of the chip are connected to anode and cathode of the power supply, respectively. CQDs are excited by the UV chip and then emit broad visible light, which can convert the ultraviolet light into white light. In addition, the optical stability of the LED based on the CQDs was investigated at different time intervals in Fig. 6(b). The emission peak of the LED exhibits no apparent shift and the emission intensity decreases slightly after continuous illumination for 4 h at 3.2 V, which indicate the excellent stability of the device.
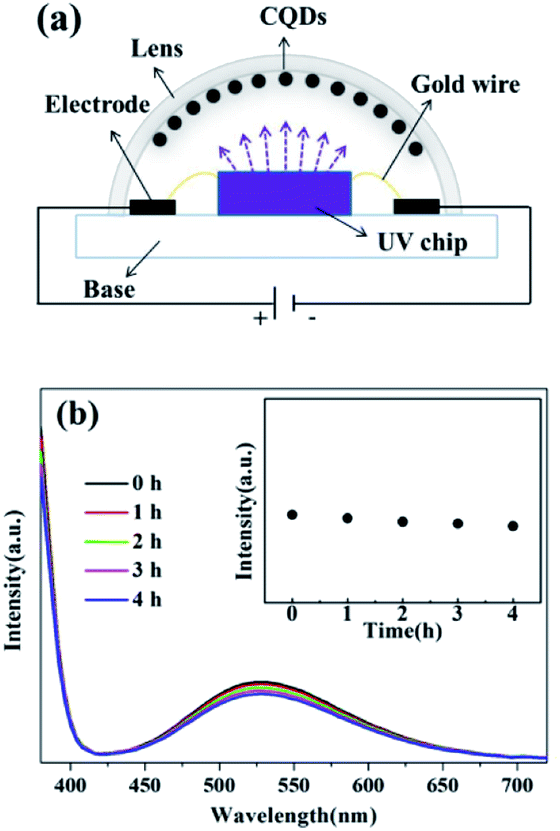 | ||
| Fig. 6 (a) A cross-section view of the LED based on coke-based CQDs. (b) Emission spectra of the white LED at different working time intervals operated at 3.2 V. Inset: Emission intensity with different working time intervals. | ||
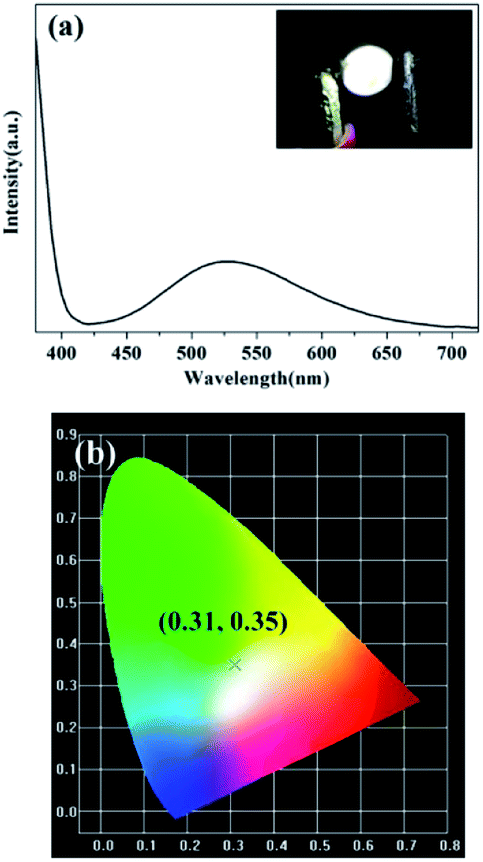
As shown in Fig. 7(a), the emission spectrum of the LED is broad and is spread over almost the entire visible range (400–720 nm). The as-prepared LED emits bright white light (inset in Fig. 7(a)). White light is made up of blue-green-red spectrum of the CQDs. The emission peak before 400 nm originates from the UV chip and is not involved in the formation of white light, which has no effect on the CIE coordinates of the device.37 Apart from the emission at 380 nm directly from the UV chip, the emission spectrum centered at 528 nm originates from the CQDs. The maximum emission wavelength of the LED shifts to longer wavelength compared with that of the CQDs aqueous solutions. This observation might be contributed to the energy transfer caused by light reabsorption of solid state CQDs.10,12 Shorter-wavelength light with high-energy emitted from CQDs might be partly reabsorbed by the surrounding CQDs, from which longer-wavelength light is emitted. In Fig. 7(b), the CIE chromaticity coordinate of the device is located at (0.31, 0.35). The correlated color temperature is 5125 K, corresponding to a cool white light gamut and being suitable for outdoor lighting.
 | ||
| Fig. 7 (a) Emission spectrum of the white LED, inset: the photograph of the LED operated at 3.2 V. (b) CIE 1931 chromaticity diagram of the white LED. | ||
4. Conclusions
In summary, we have demonstrated a green and simple method to prepare fluorescent CQDs from coke for white light-emitting devices. The prepared CQDs, with quantum yield of 9.2% and blue-green-red spectral composition up to 48%, were synthesized via a one-step chemical oxidation from coke as starting materials and hydrogen peroxide as oxidizing agent. The structural characterization of CQDs by FT-IR analysis demonstrates the CQDs contain carboxyl group and other O-rich groups. The obtained CQDs emit blue fluorescence under UV light illumination and exhibit excitation-dependent PL emission. By taking advantage of these remarkable properties, the CQDs based white LED exhibits bright cool-white light with a CIE chromaticity coordinate of (0.31, 0.35) and a CCT of 5125 K. This study demonstrates that the coke-based CQDs as candidate phosphors have promising potential applications in light-emitting devices.Conflicts of interest
There are no conflicts to declare.Acknowledgements
This work was supported by Shanxi Province Science Foundation for Youths (201801D221110, 201801D221106), Technological Innovation Foundation of the Higher Education Institutions of Shanxi Province (2019L0950, 2019L0946) and the Key Research Program of Lvliang City (No. 201701103, No. 201701102).Notes and references
- J. Zhang, X. An, X. Li, X. Liao, Y. Nie and Z. Fan, Chem. Phys. Lett., 2018, 706, 702–707 CrossRef CAS.
- G. Lecroy, P. Wang, C. Bunker, K. Fernando, W. Liang, L. Ge, M. Reibold and Y. Sun, Chem. Phys. Lett., 2019, 724, 8–12 CrossRef CAS.
- Y. Li, Y. Liu, X. Shang, D. Chao, L. Zhou and H. Zhang, Chem. Phys. Lett., 2018, 705, 1–6 CrossRef CAS.
- Y. Zhang, P. Cui, F. Zhang, X. Feng, Y. Wang, Y. Yang and X. Liu, Talanta, 2016, 152, 288–300 CrossRef CAS.
- J. Wang, C. Wang and S. Chen, Angew. Chem., Int. Ed., 2012, 51, 9297–9301 CrossRef CAS PubMed.
- H. Ding, S. Yu, J. Wei and H. Xiong, ACS Nano, 2016, 10, 484–491 CrossRef CAS.
- C. Liu, K. Chang, W. Guo, H. Li, L. Shen, W. Chen and D. Yan, Appl. Phys. Lett., 2014, 105, 073306 CrossRef.
- S. Hu, Z. Wei, Q. Chang, A. Trinchi and J. Yang, Appl. Surf. Sci., 2016, 378, 402–407 CrossRef CAS.
- Y. Miao, K. Wang, B. Zhao, L. Gao, P. Tao, X. Liu, Y. Hao, H. Wang, B. Xu and F. Zhu, Nanophotonics, 2018, 7, 295–304 CAS.
- J. Wang, F. Zhang, Y. Wang, Y. Yang and X. Liu, Carbon, 2018, 126, 426–436 CrossRef CAS.
- J. Zheng, Y. Wang, F. Zhang, Y. Yang, X. Liu, K. Guo, H. Wang and B. Xu, J. Mater. Chem. C, 2017, 5, 8105–8111 RSC.
- Y. Miao, X. Wei, L. Gao, K. Wang, B. Zhao, Z. Wang, B. Zhao, H. Wang, Y. Wu and B. Xu, Nanophotonics, 2019, 8, 1783–1794 CAS.
- M. Shang, C. Li and J. Lin, Chem. Soc. Rev., 2014, 43, 1372–1386 RSC.
- Q. Zhang, C. Wang, L. Ling and S. Chen, J. Mater. Chem. C, 2014, 2, 4358–4373 RSC.
- Q. Chen, C. Wang and S. Chen, J. Mater. Sci., 2013, 48, 2352–2357 CrossRef CAS.
- P. Tao, Y. Miao, H. Wang, B. Xu and Q. Zhao, Chem. Rec., 2019, 19, 1531–1561 CrossRef CAS.
- Y. Miao, K. Wang, L. Gao, B. Zhao, H. Wang, F. Zhu, B. Xu and D. Ma, J. Mater. Chem. C, 2018, 6, 8122–8134 RSC.
- K. Jiang, S. Sun, L. Zhang, Y. Lu, A. Wu, C. Cai and H. Lin, Angew. Chem., Int. Ed., 2015, 54, 5360–5363 CrossRef CAS.
- J. Xu, Y. Miao, J. Zheng, H. Wang, Y. Yang and X. Liu, Nanoscale, 2018, 10, 11211–11221 RSC.
- J. Xu, Y. Miao, J. Zheng, H. Yang and X. Liu, Adv. Opt. Mater., 2018, 6, 1800181 CrossRef.
- X. Feng, F. Zhang, Y. Wang, Y. Zhang, Y. Yang and X. Liu, J. Electron. Mater., 2016, 45, 2784–2788 CrossRef CAS.
- X. Feng, Y. Zhao, L. Yan, Y. Zhang, Y. He, Y. Yang and X. Liu, J. Electron. Mater., 2015, 44, 3436–3443 CrossRef CAS.
- X. Feng, F. Zhang, Y. Wang, Y. Zhang, Y. Yang and X. Liu, Appl. Phys. Lett., 2015, 107, 213102 CrossRef.
- M. Wu, Y. Wang, W. Wu, C. Hu, X. Wang, J. Zheng, Z. Li, B. Jiang and J. Qiu, Carbon, 2014, 78, 480–489 CrossRef CAS.
- C. Hu, C. Yu, M. Li, X. Wang, J. Yang and Z. Zhao, Small, 2014, 10, 4926–4933 CrossRef CAS.
- B. Geng, D. Yang, F. Zheng, C. Zhang, J. Zhan, Z. Li, D. Pan and L. Wang, New J. Chem., 2017, 41, 14444–14451 RSC.
- Y. Zhang, Y. Wang, X. Feng, F. Zhang, Y. Yang and X. Liu, Appl. Surf. Sci., 2016, 387, 1236–1246 CrossRef CAS.
- H. Nie, M. Li, Q. Li, S. Liang, Y. Tan, L. Sheng, W. Shi and S. Zhang, Chem. Mater., 2014, 26, 3104–3112 CrossRef CAS.
- L. H. Zhu, W. Zhang and S. Yu, Nanoscale, 2013, 5, 1797–1802 RSC.
- Y. Cui, Z. Hu, C. Zhang and X. Liu, J. Mater. Chem. B, 2014, 2, 6947–6952 RSC.
- S. Hu, Y. Wang, W. Zhang, Q. Chang and J. Yang, Materials, 2017, 10, 165 CrossRef.
- X. Li, Y. Liu, X. Song, H. Wang, H. Gu and H. Zeng, Angew. Chem., Int. Ed., 2015, 54, 1759–1764 CrossRef CAS.
- W. Kwon, S. Do, J. Lee, S. Hwang, J. Kim and S. Rhee, Chem. Mater., 2013, 25, 1893–1899 CrossRef CAS.
- Y. Wang, J. Zheng, J. Wang, Y. Yang and X. Liu, Opt. Mater., 2017, 73, 319–329 CrossRef CAS.
- L. Bao, C. Liu, Z. Zhang and D. Pang, Adv. Mater., 2015, 27, 1663–1667 CrossRef CAS.
- F. Zhang, Y. Wang, Y. Miao, Y. He, Y. Yang and X. Liu, Appl. Phys. Lett., 2016, 109, 083103 CrossRef.
- F. Zhang, X. Feng, Y. Zhang, L. Yan, Y. Yang and X. Liu, Nanoscale, 2016, 8, 8618–8632 RSC.
| This journal is © The Royal Society of Chemistry 2019 |