 Open Access Article
Single-walled carbon nanotubes/lithium borohydride composites for hydrogen storage: role of in situ formed LiB(OH)4, Li2CO3 and LiBO2 by oxidation and nitrogen annealing
Lathapriya
Vellingiri
 a,
Karthigeyan
Annamalai
 *a,
Ramamurthi
Kandasamy
ab and
Iyakutti
Kombiah
a
aHydrogen Storage Materials and Nanosensors Laboratory, Department of Physics and Nanotechnology, Faculty of Engineering and Technology, SRM Institute of Science & Technology, Kattankulathur-603203, Kancheepuram, Tamil Nadu, India. E-mail: karthiga@srmist.edu.in; karthigeyan.a@ktr.srmuniv.ac.in
bCrystal Growth and Thin Film Laboratory, Department of Physics and Nanotechnology, Faculty of Engineering and Technology, SRM Institute of Science & Technology, Kattankulathur-603203, Kancheepuram, Tamil Nadu, India
First published on 3rd October 2019
Abstract
Lithium Borohydride (LiBH4), from the family of complex hydrides has received much attention as a potential hydrogen storage material due to its high hydrogen energy densities in terms of weight (18.5 wt%) and volume (121 kg H2 per mol). However, utilization of LiBH4 as a hydrogen carrier in off- or on-board applications is hindered by its unfavorable thermodynamics and low stability in air. In this study, we have synthesized an air stable SWCNT@LiBH4 composite using a facile ultrasonication assisted impregnation method followed by oxidation at 300 °C under ambient conditions (SWLiB-A). Further, part of the oxidized sample is treated at 500 °C under nitrogen atmosphere (SWLiB-N). Upon oxidation in air, the in situ formation of lithium borate hydroxide (LiB(OH)4) and lithium carbonate (Li2CO3) on the surface of the composite (SWLiB@LiBH4) is observed. But in the case of SWLiB-N, the surface hydroxyl groups [OH4]− completely vanished leaving porous LiBH4 with SWCNT, LiBO2 and Li2CO3 phases. Hydrogen adsorption/desorption experiments carried out at 100 °C under 5 bar H2 pressure showed the highest hydrogen adsorption capacity of 4.0 wt% for SWLiB-A and 4.3 wt% for SWLiB-N composites in the desorption temperature range of 153–368 °C and 108–433 °C respectively. The observed storage capacity of SWLiB-A is due to the H+ and H− coupling between in situ formed Li+[B(OH)4]−, Li2+[CO3]− and Li+[BH4]−. Whereas in SWLiB-N, the presence of positively charged Li and B atoms and LiBO2 acts as a catalyst which resulted in reduced de-hydrogenation temperature (108 °C) as compared to bulk LiBH4. Moreover, it is inferred that the formation of intermediate phases such as Li+[B(OH)4]−, Li2+[CO3]− (SWLiB-A) and Li+[BO2]− (SWLiB-N) on the surface of the composites not only stabilizes the composite under ambient conditions but also resulted in enhanced de- and re-hydrogenation kinetics through catalytic effects. Further, these intermediates also act as a barrier for the loss of boron and lithium through diborane release from the composites upon dehydrogenation. Furthermore, the role of in situ formed intermediates such as LiB(OH)4, Li2CO3 and LiBO2 on the stability of the composite under ambient conditions and the hydrogen storage properties of the SWCNT@LiBH4 composite are reported for the first time.
1. Introduction
In the current scenario, increasing population growth and rapid industrialization result in high energy demand.1–8 Also, the depletion of fossil fuels and other non-renewable energy resources necessitates the development of energy systems that will satisfy our current and future energy needs.1,5 Owing to the environmental pollution caused by the conventional fuels, greener methods which could harness energy from sustainable energy sources are needed.1–8 In this context, hydrogen, being a versatile energy carrier with high energy density has potential as an alternative energy source. Moreover, the abundance of hydrogen along with its attribute of zero emission during power generation makes it an attractive alternate for conventional fuel.2,5,6 Despite being a better alternative source of energy, the commercialization of a hydrogen economy for on-board applications depends on finding solutions to problems such as lack of efficient production, distribution and effective storage of hydrogen as well as safety and financial constraints during the deployment of hydrogen-powered vehicles.7 Conventional methods available nowadays to store hydrogen are characterized by compressing the hydrogen gas under high pressures, or using as a cryogenic liquid, or a combination of both (cryo-compressed). Though these technologies are currently in use, they possess severe disadvantages such as low volumetric capacity, safety concerns and tank conformability.7,8For practical mobile applications, a compact, lightweight and inexpensive hydrogen storage medium possessing fast adsorption and desorption kinetics near the ambient conditions are necessary.8 Furthermore, the materials are expected to exhibit high gravimetric and volumetric capacity with better thermodynamics to satisfy the hydrogen storage targets set by Department of Energy (DOE) for 2020.9 Among the solid hydrogen storage materials, lightweight complex hydrides such as complex aluminum hydrides or alanates (MAlH4), alkali borohydrides (MBH4, where M = Li, K, Na) and amides (NH2) plays an important role as a safe hydrogen storage medium due to their high gravimetric and volumetric hydrogen storage capacities.10,11 The lithium borohydride (LiBH4), another lightweight complex borohydride, with high hydrogen energy densities by weight (18.5 wt%) as well as volume (121 kg m−3) makes it a potential candidate for hydrogen storage. However, its high sensitivity towards air, unfavorable thermodynamic and kinetic properties of LiBH4 as a result of strong B–H bonds, higher activation energy (180–200 kJ mol−1 of H2), high enthalpy of decomposition (−67 kJ mol−1), high decomposition temperature and release of volatile toxic diborane (B2H6) limit its practical application as hydrogen storage medium.10,11 Hence, to make LiBH4 as a viable storage medium, the researchers worldwide focus on improving its kinetics, thermodynamic properties and decomposition conditions by reacting with other metal or complex hydrides, doping with catalysts, cationic substitution or through confining nano-porous scaffolds such as metal organic frameworks (MOFs), metal oxides and carbon materials.11–35
P. A. Ward et al., studied the hydrogen storage properties of LiBH4–C nanocomposite and observed that the formation of C–H bond and nanoconfinement of LiBH4 in the carbon matrix significantly lowers the dehydrogenation temperature with reversible hydrogen adsorption under mild conditions.12 Moreover, the formation of substitution bond between B and C atoms facilitates the charge transfer reaction which results in high hydrogen release of 13.0 wt% with good reversibility.12 The addition of pre-milled MWCNTs improved the dehydrogenation kinetics of LiBH4–MgH2 system with good reversibility and lower decomposition enthalpy through catalytic effect.13 J. Kostka et al., studied the effect of adding mesoporous silica gel with different additives such as PdCl2, NiCl2, LaCl3 and TiCl3 on LiBH4 which significantly reduces the hydrogen release temperature that is close to the melting point of LiBH4 (280 °C) with suppressed B2H6 release.14 The nanotube length, structural defects and local disorders created during high energy milling on CNTs and nanoconfinement of LiBH4 showed a better desorption kinetics.15 The carbon vacancies and dangling bonds lowers the onset decomposition temperature and main dehydrogenation temperature with a maximum hydrogen release of 13 wt% at 400 °C.15 H. Zhou et al., showed that LiBH4 ball milled (BM) with activated charcoal (AC) has improved hydrogen storage properties because of catalytic and nanoconfinement effect.16 In addition, they found that LiBH4/AC (BM) sample showed a hydrogen release of 13.6 wt% at 400 °C with onset decomposition temperature of 160 °C which is lower than that of pure LiBH4.16 J. Xu et al., reported that graphene catalyzed LiBH4 started releasing hydrogen at an onset decomposition temperature of (230 °C) with 11.4 wt% hydrogen release observed below 700 °C with lower decomposition enthalpy.17 Carbon supported Pt nanoparticles catalyzed LiBH4 shows the high hydrogen release of 16.3 wt% under 560 °C as a result of catalytic dehydrogenation with reversibility.18 Moreover, it is reported that increasing the catalyst loading significantly reduces the dehydrogenation temperatures with increased hydrogen release from LiBH4.17–19 They added that the contact between graphene catalyst and LiBH4 enhances reversibility and dehydrogenation kinetics.17–19 Other researchers have reported that confining LiBH4 in mesoporous carbon,20–24 MWCNT,25,26 SWCNT,27 nanoporous carbon,28 carbon nanofiber,29 reduces the onset decomposition and main hydrogen release temperature significantly than that of pristine LiBH4. This significant improvement in the dehydrogenation properties was observed due to catalytic effect and confinement of LiBH4 in porous scaffolds.20–29 In addition to the nanoconfinement effect, catalytic effect also plays an important role in the hydrogen desorption properties of LiBH4.30–36 Shao et al.,31,32 reported an improved dehydrogenation kinetics at 194 °C and good reversibility of LiBH4 when it was confined in a zeolite template carbon network. The hydrogen storage capacity of hexagonal boron nitride (h-BN) decorated LiBH4 was studied by Naresh Muthu et al.33 They observed remarkable cyclic stability at low desorption temperature of 110 °C. The functionalization of nanostructured h-BN onto the LiBH4 significantly reduced the dehydrogenation temperature due to the polar mechanism and catalytic effect of h-BN.34,35 Puszkiel et al.,36 reported that the nanosized lithiated titanium oxide (LixTiO2) significantly reduced the dehydrogenation kinetics of LiBH4 by suppressing the formation of Li2B12H12.
Although, the dehydrogenation kinetics are improved significantly with good reversibility in some cases, all the experiments are carried out in an inert atmosphere due to the air sensitive nature of LiBH4 which requires sophisticated experimental set up. Very few studies focus on stabilizing the air sensitivity of LiBH4 which hinders its practical usage in onboard applications. The air sensitivity of LiBH4 was significantly reduced by functionalizing it with air sensitive polymer, polymethyl methacrylate (PMMA), which results in an improved kinetics of LiBH4.37,38 Kato et al.,39 reported that the hydrogen desorption rate of LiBH4 can be significantly enhanced by surface oxidation through the reduction of diborane desorption. From literature, it is reviewed that surface oxidation not only stabilizes the compound but also decreases diborane desorption with increased hydrogen desorption rate.
Hence, in this work, we report on the study of hydrogen storage properties of surface oxidized single-walled carbon nanotubes (SWCNT)–lithium borohydride (LiBH4) composites (SWLiB-A) prepared by ultrasonication assisted wet impregnation method and heat treated under air at 300 °C for 1 h. Further, a part of the oxidized sample was annealed under nitrogen atmosphere at 500 °C for 1 h to study the microstructural changes and the role of in situ formed hydroxyl phases on the hydrogen storage capacity of the composites. The physical, chemical and hydrogen adsorption/desorption properties of the composites annealed under air (SWLiB-A) and nitrogen (SWLiB-N) are analyzed. The prime advantages of this study is that, (i) hydrogen storage properties of the surface oxidized SWCNT@LiBH4 in air atmosphere is studied for the first time; (ii) effect of different adsorption temperatures and hydrogen pressure on the hydrogen adsorption properties of the composites are studied; (iii) formation of mixed phases such as LiB(OH)4, Li2CO3 and LiBO2 during oxidation and their role on the hydrogen uptake of the composites is investigated; (iv) effect of nitrogen annealing after surface oxidation was studied to understand the microstructural changes.
2. Experimental section
2.1. Materials
Single-walled carbon nanotubes (Type-I) of assay >90% having outer diameter of 1–2 nm with length ranges from 5–30 μm, lithium borohydride with purity ≥95.0% and diethyl ether (99.7%) were purchased from Sigma Aldrich. Isopropanol (extra pure AR, 99.5%) employed for SWCNT dispersion was procured from Siscon Research Laboratory (SRL), India. The chemicals obtained were used as received without further purification.2.2. Synthesis of SWCNT–LiBH4, SWLiB-A and SWLiB-N composites
A simple ultrasonic assisted wet impregnation method was employed to synthesize SWCNT–LiBH4 composites. In a typical process, SWCNT (5 mg mL−1) was dispersed well in isopropyl alcohol using bath sonication for one hour. The resultant, SWCNT suspension was placed on a hot plate to remove the solvent and then it was treated at 300 °C in air for 1 h to remove the impurities. Subsequently, LiBH4 (25 mg mL−1) was mixed in diethyl ether and sonicated for about half an hour. Then the SWCNT was added to it. After complete dispersion, the suspension was placed on a hot plate maintained at 60 °C to evaporate diethyl ether. The sample then was collected and placed in a furnace at 300 °C for 1 h in air for surface oxidation and the sample was named as SWLiB-A. After surface oxidation in air at 300 °C, a part of the sample was heat treated at 500 °C under nitrogen atmosphere for 1 h and it was named as SWLiB-N (Scheme 1).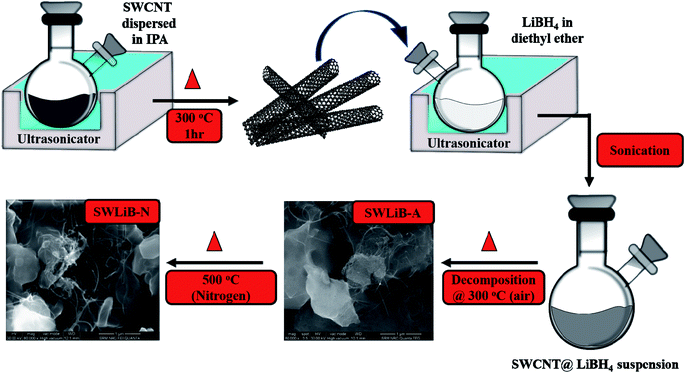 | ||
| Scheme 1 Schematic illustration of synthesis of SWLiB-A (air oxidized at 300 °C) and SWLiB-N (SWLiB-A treated in nitrogen at 500 °C). | ||
2.3. Characterization techniques
The structural properties of the composites were analyzed using PANanalytical X-Pert Pro X-ray diffractometer in the scanning range of 2θ = 10–90° with a constant step size of 0.017°. The functional groups present in the composites were examined using Agilent Carry 660 FTIR spectrometer employing KBr pellet technique in the range of 400–4000 cm−1. Raman spectra were recorded using RAMAN spectrometer (Horiba, LabRAM HR) with a laser beam wavelength of 532 nm. Moreover, X-ray photoelectron spectroscopy (XPS) was performed to find the oxidation states of the elements present on the surface, the corresponding binding energies and chemical composition of the composites using Thermo Scientific MULTILAB 2000 with monochromatic Al Kα as the X-ray source. The morphology and elemental composition of the composites were analyzed by employing FEI Quanta FEG 200-Field Emission Scanning Electron Microscope (FESEM) in combination with Energy Dispersive X-ray analysis (EDAX). The high-resolution transmission electron micrograph and corresponding selected area diffraction pattern (JEOL, 200 kV) studies were carried out to analyze the composites. Thermal stability of the composites was studied with the help of thermogravimetric analysis (TG-STA-7200, Hitachi, JAPAN) in the range of 30–1000 °C in nitrogen environment. Hydrogen adsorption and desorption studies were carried out with the help of custom-built hydrogen storage setup and thermal analyzer respectively.2.4. Hydrogen adsorption experiments
Hydrogen adsorption studies of the synthesized samples were carried out using custom built hydrogenation setup. In a typical process, the sample was placed in the hydrogenation chamber. The chamber was evacuated and then the samples were hydrogenated at three different temperatures as room temperature (RT), 100 °C and 150 °C at a constant hydrogen pressures of 5 and 10 bar in separate experiments. After 15 min of hydrogen adsorption, the hydrogen gas flow to the chamber was stopped to attain room temperature. The sample from the chamber was shifted to thermal analyzer for carrying out the hydrogen desorption studies employing sealed quartz bottle to prevent the adsorption of oxygen or moisture from the atmosphere. Then the hydrogen desorption studies were carried out in thermal analyzer under nitrogen environment with a nitrogen flow rate of 100 mL min−1.3. Results and discussion
3.1. X-ray diffraction analysis
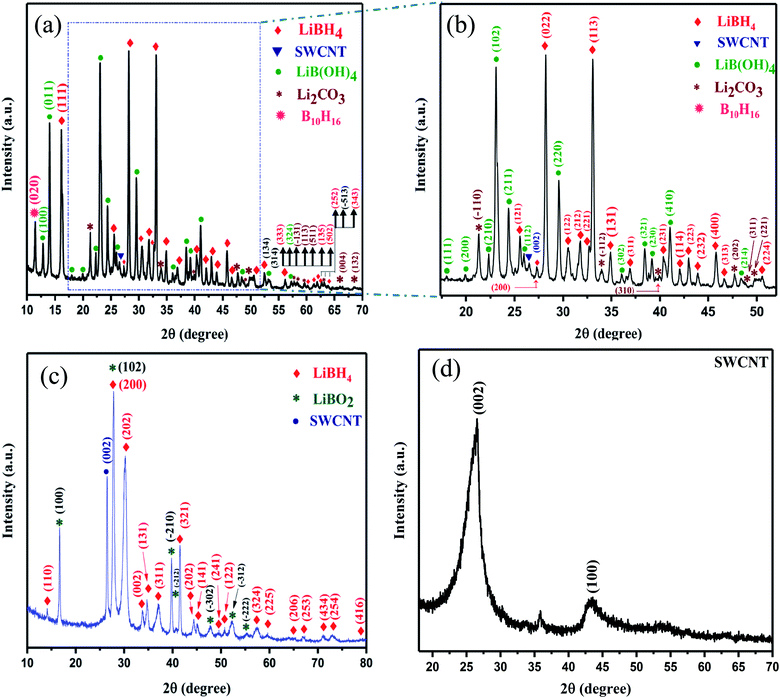
The X-ray diffraction (XRD) pattern of pristine single-walled carbon nanotubes (SWCNT) and SWCNT–LiBH4 composites heat treated under air at 300 °C (SWLiB-A) for 1 h and heat treated at 500 °C under nitrogen environment for 1 h (SWLiB-N) are depicted in Fig. 1(a)–(d) respectively. Fig. 1(a) and (b) shows the XRD pattern of SWLiB-A composite treated at 300 °C in air for 1 h which evidently shows the formation of mixed phases of lithium borohydride (LiBH4), lithium borate hydroxide (LiB(OH)4), borane (B10H16), SWCNT and lithium carbonate (Li2CO3) due to the surface oxidation of SWCNT–LiBH4 composites.39 The X-ray diffractogram of SWLiB-N composite is presented in Fig. 1(c) which shows the appearance of the lithium borate (LiBO2) phase and the absence of (LiB(OH)4) phase. The XRD peaks of lithium borohydride [Crystal Information File no. 2200380], lithium borate hydroxide [JCPDS Card no. 044-0419], SWCNT, borane [JCPDS card no. 086-1655], lithium carbonate [JCPDS card no. 022-1141] and lithium borate [JCPDS card no. 051-0517] are indexed respectively by filled diamond (♦), filled circle (•), filled inverted triangle (▼) and asterisk (*) symbols in Fig. 1(a)–(c). No trace of LiH or any other intermediates are found in these samples. The presence of broad peaks centered at 2θ = 26.5° and 44.5° are due to the (002) and (100) plane reflections respectively. The appearance of additional peak at 2θ = 35.5° in the XRD pattern of SWCNT is due to the presence of catalytical impurities in the procured SWCNT (Fig. 1(d)).403.2. Fourier transform infra-red (FTIR) and Raman spectroscopic analyses
The functional groups present in pristine SWCNT, SWCNT–LiBH4 (before heat treatment) and SWCNT–LiBH4 after heat treatment at 300 °C for 1 h under air atmosphere (SWLiB-A) were analyzed using FTIR spectroscopy and the spectra are presented in Fig. 2(a)–(c). The O–H stretching vibrations observed in the region 3505–3261 cm−1 and the frequency at 1634 cm−1 in all the spectra is due to the backbone C![[double bond, length as m-dash]](https://www.rsc.org/images/entities/char_e001.gif) C stretching vibration of SWCNT (Fig. 2(a)–(c)). The three bands centered at 2383, 2292 cm−1 and 2228 cm−1 in SWCNT–LiBH4 and SWLiB-A composites are due to asymmetric and symmetric stretching vibrations of B–H group (Fig. 2(b) and (c)).41–45 After heat treatment at 300 °C under air for 1 h (SWLiB-A) (Fig. 2(c)), the intensity of the B–H stretching vibrations in the region 2200–2400 is reduced significantly which confirms that the surface of SWCNT–LiBH4 gets oxidized. The bands observed at 1337 and 1447 cm−1 are (Fig. 2(c)) due to the stretching vibration of B–OH deformation mode and C–O bond because of oxidation of SWCNT–LiBH4 composites in air43,44 thus confirming the formation of mixed phase composites. The peaks observed in the region of 1290–1000 cm−1, 990–880 cm−1 and 850–600 cm−1 are due to B–H bending and B–OH stretching vibrations as well as the B–H rocking modes of LiBH4.42–44
C stretching vibration of SWCNT (Fig. 2(a)–(c)). The three bands centered at 2383, 2292 cm−1 and 2228 cm−1 in SWCNT–LiBH4 and SWLiB-A composites are due to asymmetric and symmetric stretching vibrations of B–H group (Fig. 2(b) and (c)).41–45 After heat treatment at 300 °C under air for 1 h (SWLiB-A) (Fig. 2(c)), the intensity of the B–H stretching vibrations in the region 2200–2400 is reduced significantly which confirms that the surface of SWCNT–LiBH4 gets oxidized. The bands observed at 1337 and 1447 cm−1 are (Fig. 2(c)) due to the stretching vibration of B–OH deformation mode and C–O bond because of oxidation of SWCNT–LiBH4 composites in air43,44 thus confirming the formation of mixed phase composites. The peaks observed in the region of 1290–1000 cm−1, 990–880 cm−1 and 850–600 cm−1 are due to B–H bending and B–OH stretching vibrations as well as the B–H rocking modes of LiBH4.42–44
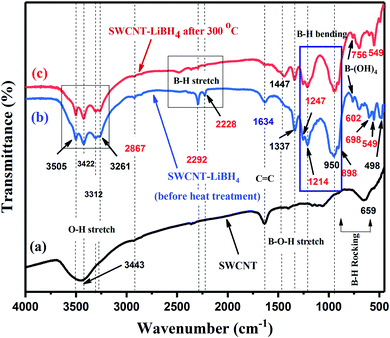 | ||
| Fig. 2 FTIR spectra of (a) pristine SWCNT, (b) SWCNT–LiBH4 composite (before heat treatment) and (c) SWCNT–LiBH4 composite heat treated at 300 °C in air (SWLiB-A). | ||
To investigate the structural changes in detail Raman spectroscopic analysis was carried out for LiBH4, pristine SWCNT and SWLiB-A (composite heat treated at 300 °C in air for 1 h) and SWLiB-N (composite treated at 500 °C in nitrogen environment for 1 h) respectively. The corresponding spectra are shown in Fig. 3(a)–(d). The vibrational frequencies observed in the region 300–488 cm−1 and 1090–1290 cm−1 correspond to B2g and Ag vibrational modes of LiBH4 as well as the B3g B–H deformation modes of LiBH4 (B–H bending).45–47 The B–H stretching modes observed at 2100 and 2213 cm−1 are due to vibration of symmetric and asymmetric modes of LiBH4 (Fig. 3(a)).43–46 The sharp vibrational bands in the region of 100–300 cm−1 correspond to the radial breathing modes (RBM) of SWCNT (Fig. 3(b)). The predominant bands at 1341 (D-band), 1588 (G-band) are due to the A1g symmetry related to the structural defects present in the SWCNT, translational vibrations of E2g phonon modes corresponds to in-plane vibrations of graphite like sp2 carbons in SWCNT. The peak located at 2675 cm−1 (2D-band) is aroused due to the second scattering process of SWCNT respectively (Fig. 3(b)). The Raman spectrum of SWLiB-A shows, the presence of RBM mode, Ag and B2g modes of LiBH4, D, G, and G’ bands of SWCNT and B–H bending and stretching vibrations which confirm the formation of the composites. Moreover, as compared to pristine SWCNT, the position of D and G′ bands are shifted towards lower wavenumber which is due to the confinement of SWCNT in the LiBH4. The peak observed at 2437 cm−1 is due to the surface oxidation in the SWCNT–LiBH4 composites. Raman spectrum of SWLiB-N composites reveals that the stretching vibration observed at 2437 cm−1 in SWLiB-A sample is vanished due to the removal of surface hydroxyl groups. The new band observed at 1937 cm−1 corresponds to B–O bond. Further, the detailed frequency assignment of Raman and FTIR bands are compared and presented in Table 1.
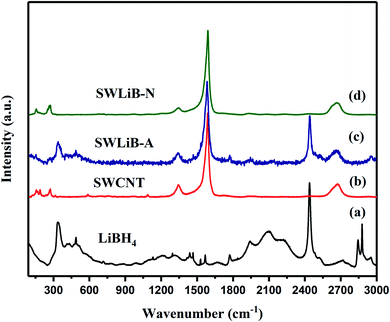 | ||
| Fig. 3 Raman spectra of (a) LiBH4, (b) pristine SWCNT, (c) SWCNT–LiBH4 composite treated at 300 °C under air (SWLiB-A) and (d) SWCNT–LiBH4 composite treated at 500 °C under nitrogen (SWLiB-N). | ||
| Frequency assignments | SWCNT | SWCNT–LIBH4 composite | SWLiB-A | Ref | |||
|---|---|---|---|---|---|---|---|
| Raman frequencies | Infra-red frequencies | Raman frequencies | Infra-red frequencies | Raman frequencies | Infra-red frequencies | ||
| OH stretching | — | 3443 | — | 3261, 3312, 3422, 3505,1639 | — | 3268, 3319, 3434, 3502, 1630 | Present work (PW) |
| 3000–3600 | 35, 37, and 38 | ||||||
| C=C stretching (G band) | 1588 | 1634 | 1583 | 1634 | 1590 | 1621 | PW |
| C–O stretching | — | — | 1950 | 1447 | 1447, 1920 | 1449 | PW |
| 1360–1480 | 37 | ||||||
| RBM mode | 150, 198, 282 | — | 161, 277 | — | 161, 267 | — | PW |
| D band | 1346 | — | 1344 | — | 1343 | — | PW |
| 2D band | 2679 | — | 2668 | — | 2668 | — | PW |
| B–H stretching vibrations | — | — | 2118, 2221, 2338 | 2292, 2214, 2383 | 2134, 2224, 2330 | 2292, 2357, 2486 | PW |
| 2000–2500 | 35–39 | ||||||
| B–H bending/deformation vibration | — | — | 1198 | 1214,1259, 956, 885 | 1203 | 1208, 1247, 937, 898 | PW |
| 1000–1290 | 35, 37–39 | ||||||
| B–H rocking vibration | — | — | — | 602 | — | 698 | PW |
| 600–700 | 37–39 | ||||||
| B–O–H stretching | — | — | — | 704, 763, 1337 | 1458 | 756, 1337 | PW |
| 735, 740–763 | 35–39 | ||||||
3.3. X-ray photoelectron spectroscopic analysis
X-ray photoelectron spectroscopy (XPS) analysis was carried out to investigate the surface chemical composition and the changes occurred due to surface oxidation in the air annealed sample (SWLiB-A) and in the nitrogen annealed sample (SWLiB-N). The core level Li1s, B1s, C1s and O1s peaks in the XPS spectra of SWLiB-A and SWLiB-N are presented in Fig. 4(a)–(d) and Fig. 4(e)–(h) respectively. The corresponding binding energy states of the constituent elements were analyzed by deconvoluting the high-resolution core level XPS spectra of the Li1s, B1s, C1s and O1s peaks. The peak centered at around 55.6 eV and 57.2 eV (Fig. 4(a) and (e)) in the deconvoluted Li 1s spectra of SWLiB-A and SWLiB-N composites, correspond to Li 1s state of oxidized lithium and pure LiBH4 respectively.48,49 But, in the case of SWLiB-N composites, the binding energy of Li 1s state is shifted towards higher binding energy side with a chemical shift of 1.6 eV as compared to SWLiB-A composite (Fig. 4(e)). The deconvoluted B1s spectrum of SWLiB-A comprises, two component peaks centered at 188.1 eV and 192.5 eV correspond to the substitutional boron (B1s of LiBH4) and borate hydroxide (B–(OH)4) group respectively (Fig. 4(b)), thus confirming the formation of mixed phases of lithium borate hydroxide and lithium carbonate as a result of surface oxidation. Moreover, in the case of SWLiB-N composites, the B 1s spectra corresponds to pure LiBH4 is only observed at a binding energy of 188.2 eV whereas the peak located at 192.5 eV corresponds to borate hydroxide (B–(OH)4) group completely vanishes (Fig. 4(f)).39,48 This confirms that the hydroxyl groups from the surface of the composites were removed due to annealing under nitrogen. The binding energies of Li1s (57.2 eV) and B1s (188.2 eV) in the SWLiB-N composite corresponds to LiBH4 which confirms that surface hydroxyl groups are removed and only LiBH4 and LiBO2 are present in the composites.39,48,49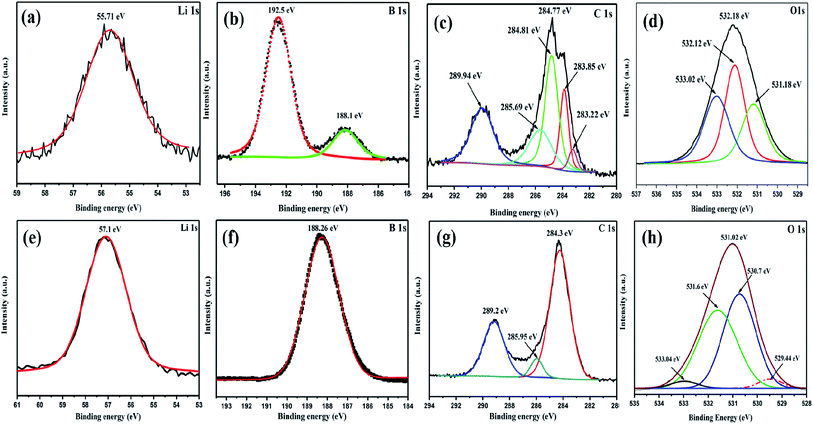 | ||
| Fig. 4 XPS spectra of (a–d) SWLiB-A (composite treated at 300 °C under air) and (e–h) SWLiB-N (composite treated at 500 °C under nitrogen). | ||
The C1s peak, on the other hand exhibits five component peaks at 284.8, 283.8, 283.2, 285.6 and 289.9 eV (Fig. 4(c)). The peak centered at 284.4 eV in SWLiB-A and SWLiB-N composites corresponds to the graphitic C–C/C![[double bond, length as m-dash]](https://www.rsc.org/images/entities/char_e001.gif) C bonds which indicates that most of the carbon atoms are in sp2 hybridized domains (Fig. 4(c) and (g)).48 The lower binding energy peaks located at 283.2 and 283.8 eV are assigned to the confinement of SWCNT in LiBH4 matrix. Moreover, the peaks at 285.6 eV and 289.9 eV are attributed to oxygenated carbon atoms (C–O/C
C bonds which indicates that most of the carbon atoms are in sp2 hybridized domains (Fig. 4(c) and (g)).48 The lower binding energy peaks located at 283.2 and 283.8 eV are assigned to the confinement of SWCNT in LiBH4 matrix. Moreover, the peaks at 285.6 eV and 289.9 eV are attributed to oxygenated carbon atoms (C–O/C![[double bond, length as m-dash]](https://www.rsc.org/images/entities/char_e001.gif) O) at the defect sites of SWCNTs and CO32− of lithium carbonate (Fig. 4(c) and (g)).39,48,49 Furthermore, the oxygen O1s spectra of SWLiB-A is deconvoluted into three peaks (Fig. 4(d)) and which are assigned to O
O) at the defect sites of SWCNTs and CO32− of lithium carbonate (Fig. 4(c) and (g)).39,48,49 Furthermore, the oxygen O1s spectra of SWLiB-A is deconvoluted into three peaks (Fig. 4(d)) and which are assigned to O![[double bond, length as m-dash]](https://www.rsc.org/images/entities/char_e001.gif) C (531.1 eV) of oxygenated carbons, B–OH bonds attributed to borate hydroxide (532.18 eV) and O–C
C (531.1 eV) of oxygenated carbons, B–OH bonds attributed to borate hydroxide (532.18 eV) and O–C![[double bond, length as m-dash]](https://www.rsc.org/images/entities/char_e001.gif) O from lithium carbonate (533.0 eV). But in the O1s spectrum of SWLiB-N composite, the B–OH bonds completely disappeared and the peak corresponds to B–O bonds becomes predominant. These results confirms that LiB(OH)4 phase was completely removed after nitrogen annealing leaving LiBH4 phase with traces of Li2CO3 and LiBO2 in SWLiB-N composites.
O from lithium carbonate (533.0 eV). But in the O1s spectrum of SWLiB-N composite, the B–OH bonds completely disappeared and the peak corresponds to B–O bonds becomes predominant. These results confirms that LiB(OH)4 phase was completely removed after nitrogen annealing leaving LiBH4 phase with traces of Li2CO3 and LiBO2 in SWLiB-N composites.
3.4. Field emission scanning electron and transmission electron microscope analysis
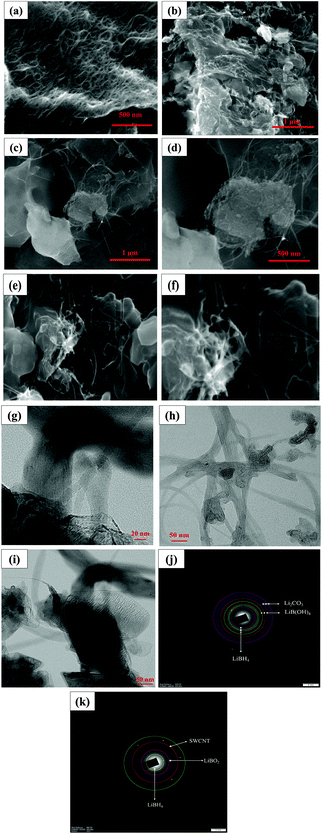
The morphology of the pristine SWCNT, SWCNT–LiBH4 composite before heat treatment, SWLiB-A (heat treated under air at 300 °C) and SWLiB-N (heat treated under nitrogen atmosphere at 500 °C) composites, analyzed using FESEM and TEM with the corresponding SAED patterns, are shown in Fig. 5(a)–(k). FESEM image of pristine SWCNT shows randomly aligned bundles of SWCNT (Fig. 5(a)). The morphological analysis of the SWCNT–LiBH4 before heat treatment reveals that the SWCNTs are fully confined into the sheet like LiBH4 matrix (Fig. 5(b)). SEM micrographs of SWLiB-A presented in Fig. 5(c) and (d) reveal that the tube surface of the SWCNT is fully covered by a sheet like structures and further confirm the confinement of SWCNT in oxidized LiBH4. To analyze, the confinement of SWCNT and the effect of surface oxidation in detail, HRTEM images and SAED pattern obtained for SWLiB-A composite (Fig. 5(g)–(j)) show that layer like islands are formed on the surface of SWCNT. The ring formation in the SAED pattern confirms the polycrystalline nature of the composites (Fig. 5(j)). The d-spacing calculated from SAED pattern of SWLiB-A composites compare well with the d-spacing calculated from XRD pattern. The results confirm that the surface of SWCNT–LiBH4 composites is oxidized. FESEM images of SWLiB-N composite, presented in Fig. 5(e) and (f), show that SWCNTs are confined in a porous LiBH4 matrix. This may be due to the removal of surface hydroxyl from the SWLiB-A composite during annealing under nitrogen atmosphere. SAED pattern of SWLiB-N shows the formation of ring pattern and confirms the polycrystalline nature of the composites. Further, the d-spacing calculated from the ring pattern matches well with the XRD pattern of SWLiB-N composites correspond to lithium borohydride and lithium borate. Presence of six bright spots in a SAED pattern belongs to the hexagonal structure of SWCNT (Fig. 5(k)).3.5. Thermogravimetric analysis
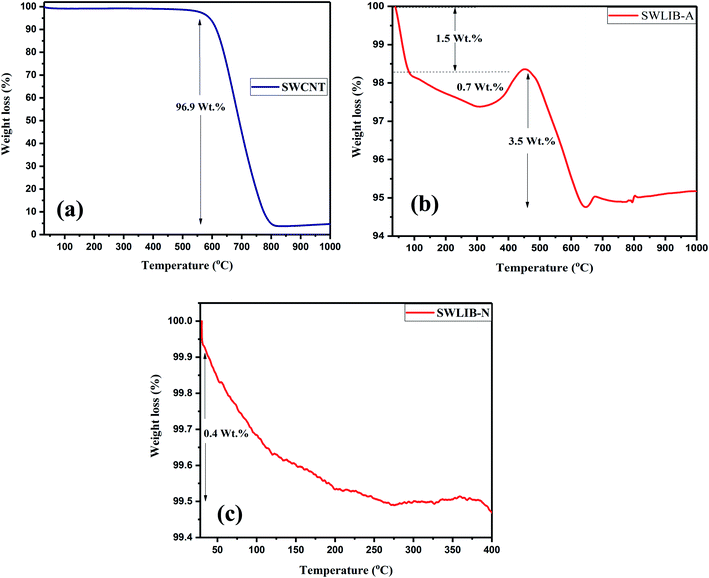
Thermogravimetric analysis was carried out to investigate the thermal stability of the pristine SWCNT and synthesized composites from room temperature to 1000 °C at the heating rate of 10 °C min under nitrogen environment with a constant nitrogen flow rate of 100 mL min−1. Fig. 6(a)–(c) show the thermogram of pristine SWCNT, SWLiB-A and SWLiB-N.The thermogram of SWCNT (Fig. 6(a)) shows a plateau in the range of RT to 560 °C without any weight loss thus confirming the high thermal stability of SWCNT. After 560 °C, the thermogram of SWCNT shows sudden weight loss of 96.9 wt% due to the oxidation of SWCNT. The thermogram of SWLiB-A composites given in Fig. 6(b) shows three stages of weight loss. The first and second stage of weight loss observed below 300 °C could be due to the evaporation of solvent or due to the evaporation of adsorbed moisture. The third stage of weight loss in the region 400–550 °C is due to the dehydrogenation of LiBH4 and weight loss after 560 °C is due to the oxidation of SWCNT. The thermogram of SWLiB-N composite (Fig. 6(c)) shows weight loss of about 0.4 wt% below 300 °C. There is no weight loss after 300 °C was observed in the SWLiB-N composite which confirms the highly stable nature of the composite.
3.6. Hydrogen desorption studies
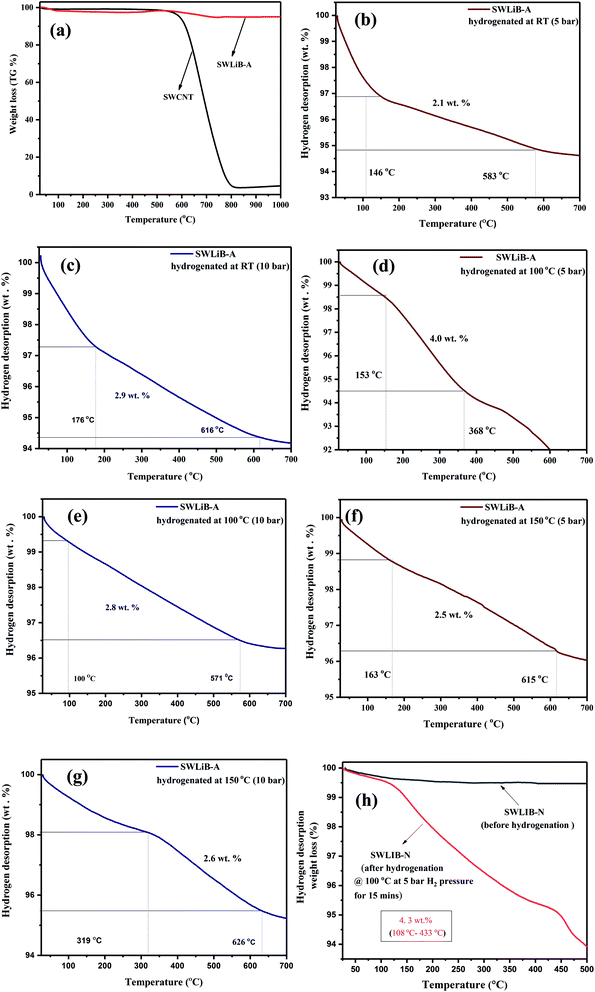
The hydrogen desorption thermograms of pristine SWCNT and SWLiB-A composites hydrogenated at RT, 100 °C and 150 °C under hydrogen gas pressure of 5 and 10 bar for a time span of 15 min are presented in Fig. 7(a)–(g). Fig. 7(h) depicts the hydrogen desorption curve of SWLiB-N composite hydrogenated at 100 °C under a constant hydrogen pressure of 5 bar for 15 min. Hydrogen desorption studies of the hydrogenated SWLiB-A and SWLiB-N composites were carried out using simultaneous thermal analyzer under nitrogen environment with a constant N2 flow rate of 100 mL min−1 at a heating rate of 10 °C min−1. Thermogravimetric spectra of the samples (SWLiB-A and SWLiB-N composites) before hydrogenation and after hydrogenation were also recorded under the same condition for comparison.Fig. 7(a) represents the thermogram of pristine SWCNT and SWLiB-A (composite heat treated at 300 °C in air). From the thermogram of pristine SWCNT, no significant weight loss is observed from RT to 560 °C which confirms the highly stable nature of SWCNT. The significant weight loss of 97% observed in the range of 590–800 °C is due to the decomposition of SWCNT (Fig. 7(a)).
The SWLiB-A composite shows weight loss in three steps. The weight loss observed from RT-110 °C is due to the decomposition of the solvent or due to the phase transformation of LiBH4 (∼1.5 wt%) whereas the decomposition of LiBH4 and removal of adsorbed water molecules from the ambient atmosphere (∼0.7 wt%) in the range of 120–356 °C respectively. The weight loss in the temperature range of 356 °C to 550 °C is due to the dehydrogenation of LiBH4 and after 550 °C is due to the decomposition of SWCNT (Fig. 7(a)).
The SWLiB-A composite hydrogenated at RT under 5 bar pressure shows a weight loss of 2.1 wt% in the range of 146–583 °C whereas the same sample hydrogenated at RT under 10 bar pressure shows a weight loss of 2.9 wt% in the 176–616 °C temperature range due to hydrogen desorption (Fig. 7(b) and (c)). The SWLiB-A composite hydrogenated at 100 °C under 5 and 10 bar pressures shows a weight loss of 4.0 wt% and 2.8 wt% due to dehydrogenation in the range of 153–368 °C and 100–571 °C respectively (Fig. 7(d) and (e)). The samples hydrogenated at 150 °C under 5 and 10 bar H2 pressure show hydrogen adsorption capacity of 2.5 wt% and 2.6 wt% from 163–615 °C and 319–626 °C respectively (Fig. 7(f) and (g)). It is inferred from the desorption spectra that the composite hydrogenated at 100 °C under 5 bar pressure shows a maximum weight loss of 4.0 wt% in the desorption range of 150–368 °C. The hydrogen adsorption study of SWLiB-N sample carried out at a hydrogen adsorption temperature of 100 °C under a constant hydrogen pressure of 5 bar and the dehydrogenation thermogram are shown in Fig. 7(h). From the desorption spectra, it is observed that, the SWLiB-N composites showed a weight loss of 4.3 wt% due to hydrogen desorption in the temperature range of 108–433 °C. Fig. 8 shows the histogram of hydrogen storage capacity of the SWLiB-A composite at different temperature and pressure.
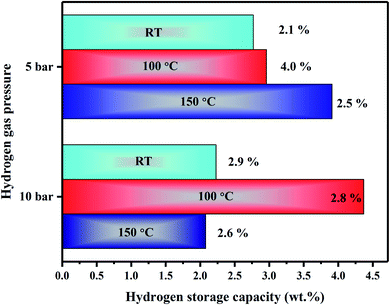 | ||
| Fig. 8 Histogram showing the hydrogen storage capacity of SWLiB-A composites hydrogenated at RT, 100 °C and 150 °C under 5 and 10 bar hydrogen pressure. | ||
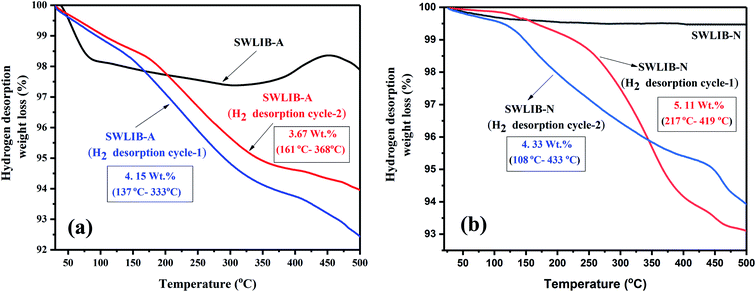
Dehydrogenation cyclic profile of the composite oxidized in air SWLiB-A and nitrogen annealed sample (SWLiB-N) is presented in Fig. 9. As can be seen from Fig. 9(a), SWLiB-A composite shows a hydrogen release of 3.7 wt% in the range of 161–368 °C (Cycle-1). After dehydrogenation, the sample was collected and rehydrogenated at 100 °C under 5 bar hydrogen pressure for about 15 min and found that it releases 4.1 wt% hydrogen upon dehydrogenation. From these results, it is observed that the onset decomposition temperature of SWLiB-A decreases with significant increase in the dehydrogenation rate. This could be attributed due to the confinement of LiBH4 in SWCNT, catalytic effect of in situ formed LiB(OH)4, Li2CO3 particles. Moreover, the interaction between the H+ in [OH]− of LiB(OH)4 and H− in [BH4]− increases the hydrogen desorption rate by reducing dehydrogenation temperature.43 As reported earlier, the development of complexes containing H+ and H− effectively destabilizes LiBH4 which resulted in an improved kinetics. Fig. 9(b) depicts the dehydrogenation cyclic profile of SWLiB-N composite which shows hydrogen release of 5.1 wt% during first cycle whereas in second cycle hydrogen release percentage is 4.3 wt%. The XRD pattern of SWLiB-N sample before hydrogenation, after hydrogenation and after dehydrogenation (after 2 cycles) is shown in Fig. 10. From the XRD pattern it is observed that after 2 cycles the formation B10H16 as an intermediate after dehydrogenation. The increase in the hydrogen desorption rate and good reversibility in mild condition (100 °C@5 bar H2 pressure) is due to the catalytic effect of in situ formed LiBO2 particles. The presence of Li+, positively charged B atoms and highly electronegative O atoms from LiBO2 significantly enhances the dehydrogenation and rehydrogenation of the composite.50
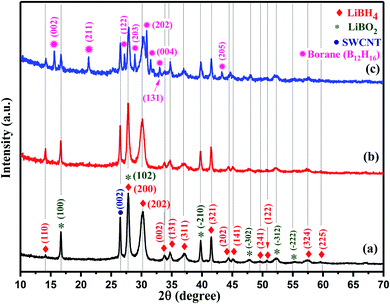 | ||
| Fig. 10 X-ray diffraction pattern of (a) SWLiB-N composite; (b) SWLiB-N after hydrogenation at 100 °C under 5 bar H2 pressure and (c) after dehydrogenation (2 cycles). | ||
The hydrogen storage capacity of lithium borohydride with different carbon additives such as fullerene (C60), MWCNTs, SWCNTs, graphene and activated charcoal are compared with that of the present work is given in Table 2. Over all, from this study, it is inferred that, the formation of hydroxide, carbonate or borate groups on the SWCNT–LiBH4 surface and the nano confinement of SWCNT in the host matrix aids the prevention of boron and lithium losses during dehydrogenation and decomposition of LiBH4. These oxide layers on the surface of SWCNT–LiBH4 act as a barrier against the loss of boron and lithium upon decomposition thus enhanced the hydrogen storage capacity of the composites. Moreover, H+ and H− coupling formed in SWLiB-A composite and LiBO2, Li2CO3 formation in SWLiB-N composite acts as a catalyst responsible for the reported storage and hydrogenation and dehydrogenation kinetics of the sample.
| Storage medium | Experimental conditions | H2 (wt%) and exp. conditions | Description | |
|---|---|---|---|---|
| Methodology | Atmosphere | |||
| LiBH4–C nanocomposite12 with fullerene, C60 as additive | Solvent assisted mixing (THF) | Argon | 13.0@530 °C rehydrogenation at 330 °C@100 bar H2 pressure for 5 h | Addition of C60 not only lowers dehydrogenation temperature it enhances reversibility of the composite through C–H bonds |
| LiBH4–MgH2@pre-milled MWCNTs13 | High-energy ball milling | Argon | 12.0 wt% | Lowered dehydrogenation temperature due to the catalytic effect of pre-milled MWCNTs |
| LiBH4@SWCNT27 | Ball milling | Argon | 13.4 wt%@400 °C | Increased structural defects and decreased nanotube length due to milling decreases dehydrogenation temperature. Nanoconfinement effects plays dominant role in improving dehydrogenation kinetics |
| LiBH4@MWCNT15 | Ball milling | Argon | 11 wt%@450 °C | |
| LiBH4/activated charcoal (AC)16 | Ball milling | Argon | 13.6 wt%@400 °C | Combination of catalytic and nanoconfinement effect resulted in an improved kinetics with lower dehydrogenation temperature and activation energy |
| LiBH4 catalyzed by graphene17 | Ball milling | Argon | 11.4 wt%@230 °C rehydrogenation@400 °C under 3 MPa H2 pressure for 10 h | Increased contact area between LiBH4 and graphene decreases dehydrogenation kinetics with low dehydrogenation enthalpy and increased hydrogen release rate |
| SWCNT@BH3 (ref. 52) | Drop casting (BH3 functionalization through decomposition of the SWCNT@LiBH4 film at 275 °C) | Open atmosphere | 1.5 wt% observed under continuous flow of H2 gas (3 L min−1) for 20 min at 50 °C substrate temperature and hold at this temperature for 100 min | The hydrogen absorption is mainly due to carbon |
2LiBH4![[thin space (1/6-em)]](https://www.rsc.org/images/entities/char_2009.gif) : :![[thin space (1/6-em)]](https://www.rsc.org/images/entities/char_2009.gif) MgH2 + 5% Ni (LBMN)51 MgH2 + 5% Ni (LBMN)51 |
Ball milling | Argon | — | Different milling time significantly affects the interaction between LiBH4![[thin space (1/6-em)]](https://www.rsc.org/images/entities/char_2009.gif) : :![[thin space (1/6-em)]](https://www.rsc.org/images/entities/char_2009.gif) MgH2 system and CNT which hinders its dehydrogenation kinetics. An induction time during hydrogen desorption as a result of dispersion of CNTs shows that addition of CNTs has no effect on thermodynamics of this system MgH2 system and CNT which hinders its dehydrogenation kinetics. An induction time during hydrogen desorption as a result of dispersion of CNTs shows that addition of CNTs has no effect on thermodynamics of this system |
2LiBH4![[thin space (1/6-em)]](https://www.rsc.org/images/entities/char_2009.gif) : :![[thin space (1/6-em)]](https://www.rsc.org/images/entities/char_2009.gif) MgH2 + Ni (95%) + 5% CNT (LBMNT)51 MgH2 + Ni (95%) + 5% CNT (LBMNT)51 |
Ball milling | Argon | — | |
| SWLiB-A (SWCNT@LiBH4 treated at 300 °C in air) [PW] | Ultrasonication assisted wet impregnation method | Air | 4.0 wt%@150–368 °C hydrogenated@100 °C under 5 bar H2 pressure | Confinement of LiBH4 in nano SWCNT and the formation of H+ and H− through the in situ formed LiB(OH)4, Li2CO3 particles catalyzes the composite thus resulted in improved kinetics |
| SWLiB-N (SWLiB-A treated at 500 °C in nitrogen) [PW] | Ultrasonication assisted wet impregnation method | Air and nitrogen | 4.3 wt%@108–433 °C hydrogenated@100 °C under 5 bar H2 pressure | The presence of positively charged Li, B and highly electronegative O atoms in LiBO2 and the Li2CO3 particles enhances the de/re-hydrogenation of the composites |
4. Conclusions
In summary, surface oxidized single-walled carbon nanotube-lithium borohydride composites (SWLiB-A) was synthesized by simple ultrasonication assisted wet impregnation method followed by surface modification of SWCNT–LiBH4 composite by oxidation under air annealing at 300 °C (SWLiB-A). Further, a part of the oxidized sample was annealed under nitrogen atmosphere at 500 °C for 1 h in order to study the microstructural changes and the role of in situ formed hydroxyl phases on the hydrogen storage capacity of the composites (SWLiB-N). The samples synthesized were studied using XRD, FTIR, Raman, XPS, FESEM, TEM with SAED and TGA analyses. Moreover, the hydrogen uptake capacity of the composites at different hydrogen adsorption temperatures and pressures was also investigated and found that the adsorption temperature and pressure play an important role in enhancing the storage capacity of the composites. The formation of lithium borate hydroxide and lithium carbonate on the surface of SWCNT–LiBH4 composite in addition to lithium borohydride as a result of surface oxidation in air was confirmed by XRD analysis. Whereas in the XRD pattern of SWLiB-N composites, the surface hydroxyl groups correspond to lithium borate hydroxide was completely vanished and only phases correspond to lithium borohydride, lithium borate and SWCNT was observed. The presence of vibrational frequencies correspond to LiBH4, LiB(OH)4, Li2CO3 and LiBO2 was confirmed by FTIR, Raman and XPS analysis thus confirming the formation of composites. The intensity of B–H vibrations in the FTIR spectra of SWLiB-A composites reduces significantly thus confirming the surface of SWCNT–LiBH4 composite was oxidized. Presence of lithium, boron, carbon and oxygen was confirmed by XPS analysis. Further, XPS analysis reveals that the binding energies correspond to B–OH in SWLiB-A was completely vanished upon nitrogen annealing (SWLiB-N) and also the binding energies of Li 1s and B 1s spectra of SWLiB-N composite correspond to pure LiBH4. Morphological analysis depicts that SWCNT was confined into the oxidized LiBH4 matrix in SWLiB-A whereas in SWLiB-N composite SWCNT was confined into the porous LiBH4 and LiBO2. The d-spacing values calculated from the SAED pattern of SWLiB-A confirms the presence of LiBH4, LiB(OH)4, and Li2CO3 and compares well with the XRD pattern. The hydrogenation studies of the composites carried out at different pressure and temperatures show that the composites hydrogenated at 100 °C at 5 bar H2 pressure has high hydrogen storage capacity of 4.0 wt% for SWLiB-A in the desorption range of 153–368 °C and 4.3 wt% for SWLiB-N composites in the desorption range of 108–433 °C respectively. Over all, from this study, it is inferred that, the formation of hydroxide, carbonate or borate groups on the SWCNT–LiBH4 surface and the nano confinement of SWCNT in the host matrix aids in the reduction of boron and lithium losses through the desorption of diborane. These oxide layers on the surface acts as a barrier for SWCNT–LiBH4 composite which resulted in an enhanced hydrogen storage capacity by reducing the loss of boron and lithium upon decomposition. Moreover, H+ and H− coupling formed in SWLiB-A composite as a result of in situ formed LiB(OH)4, and Li2CO3 phases and LiBO2 in SWLiB-N composite acts as a catalyst responsible for the improved hydrogenation and rehydrogenation kinetics of LiBH4. Thus, enhances the hydrogen storage capacity and de/re-hydrogenation kinetics of the SWCNT–LiBH4 composites at mild conditions (100 °C under 5 bar H2 pressure). Further, tuning the process parameters is expected to significantly enhance the hydrogen storage capacity and improved kinetics of the composites.Conflicts of interest
There is no conflict of interest.Acknowledgements
The authors thank the Department of Science and Technology-Science and Engineering Research Board (DST-SERB–SB/S2/CMP-073/2013), New Delhi for financial support to carry out the research work. Further, we acknowledge the “HRTEM Facility” at SRMIST setup with support from MNRE (Project No. 31/03/2014–15/PVSE-R&D), Government of India. The authors greatly acknowledge the support by Prof. John Thiruvadigal and Dr Preferencial Kala, Department of Physics and Nanotechnology, Nanotechnology Research Center (For FESEM analysis), Department of Biotechnology (FTIR spectroscopy support) and SRM Institute of Science and Technology, Kattankulathur-603203 for “micro-Raman Facility”.References
- L. Schlapbach and A. Züttel, Nature, 2001, 414, 353–358, DOI:10.1038/35104634.
- I.-P. Jain, Int. J. Hydrogen Energy, 2009, 34, 7368–7378, DOI:10.1016/j.ijhydene.2009.05.093.
- C. Liu, Y.-Y. Fan, M. Liu, H.-T. Cong, H.-M. Cheng and M.-S. Dresselhaus, Science, 1999, 286, 1127–1129, DOI:10.1126/science.286.5442.1127.
- J. Rothstein, Int. J. Hydrogen Energy, 1995, 20, 283–286, DOI:10.1016/0360-3199(93)E0008-9.
- M. Hirscher, Handbook of hydrogen storage: new materials for future energy storage, John Wiley & Sons, 2010, pp. 1–36, by Manfred Klell and, pp. 117–122, by Claudia Weidenthaler and M. Felderhoff Search PubMed.
- D.-J. Durbin and C. Malardier-Jugroot, Int. J. Hydrogen Energy, 2013, 38, 14595–14617, DOI:10.1016/j.ijhydene.2013.07.058.
- L. Zhou, Renewable Sustainable Energy Rev., 2005, 9, 395–408, DOI:10.1016/j.rser.2004.05.005.
- J. Yang, A. Sudik, C. Wolverton and D.-J. Siegel, Chem. Soc. Rev., 2010, 39, 656–675, 10.1039/b802882f.
- http://energy.gov/sites/prod/files/2015/05/f22/fcto_myrdd_storage.pdf .
- D. M. Schubet, in Boron Science – New Technologies and Applications, Boron Chemistry for Hydrogen Storage, CRC Press, 2012, pp. 385–415 Search PubMed.
- B. Sakintuna, F. Lamari - Darkrim and M. Hirscher, Int. J. Hydrogen Energy, 2007, 32, 1121–1140, DOI:10.1016/j.ijhydene.2006.11.022.
- P.-A. Ward, J.-A. Teprovich Jr, B. Peters, J. Wheeler, R.-N. Compton and R. Zidan, J. Phys. Chem. C, 2013, 117, 22569–22575, DOI:10.1021/jp4079103.
- I.-H. Cho, S. Gang, H. Lee, J.-H. Shim, M. Park and Y.-N. Choi, Int. J. Hydrogen Energy, 2016, 41, 22090–22096, DOI:10.1016/j.ijhydene.2016.09.141.
- J. Kostka, W. Lohstroh, M. Fichtner and H. Hahn, J. Phys. Chem. C, 2007, 111(37), 14026–14029, DOI:10.1021/jp073783k.
- Y.-T. Wang, C.-B. Wan, X.-H. Meng and X. Ju, J. Alloys Compd., 2015, 645, S112–S116, DOI:10.1016/j.jallcom.2014.12.264.
- H. Zhou, X.-H. Wang, H.-Z. Liu, S.-C. Gao and M. Yan, Rare Met., 2019, 38, 321–326, DOI:10.1007/s12598-018-1067-1.
- J. Xu, R. Meng, J. Cao, X. Gu, Z. Qi, W. Wang and Z. Chen, Int. J. Hydrogen Energy, 2013, 38, 2796–2803, DOI:10.1016/j.ijhydene.2012.12.046.
- J. Xu, J. Cao, X. Yu, Z. Zou, D.-L. Akins and H. Yang, J. Alloys Compd., 2010, 490, 88–92, DOI:10.1016/j.jallcom.2009.10.031.
- G. Xu, W. Zhang, Y. Zhang, X. Zhao, P. Wen and D. Ma, RSC Adv., 2018, 35, 19353–19361, DOI:10.1016/j.jallcom.2009.10.031.
- X.-B. Yu, Z. Wu, Q.-R. Chen, Z.-L. Li, B.-C. Weng and T.-S. Huang, Appl. Phys. Lett., 2007, 90, 034106, DOI:10.1063/1.2432240.
- Y. Zhang, W.-S. Zhang, A.-Q. Wang, L.-X. Sun, M.-Q. Fan, H.-L. Chu, J.-C. Sun and T. Zhang, Int. J. Hydrogen Energy, 2007, 32, 3976–3980, DOI:10.1016/j.ijhydene.2007.04.010.
- E. Hazrati, G. Brocks and G.-A. De Wijs, J. Phys. Chem. C, 2014, 118, 5102–5109, DOI:10.1021/jp410676b.
- S. Cahen, J.-B. Eymery, R. Janot and J.-M. Tarascon, J. Power Sources, 2009, 189, 902–908, DOI:10.1016/j.jpowsour.2009.01.002.
- C. Paduani and A.-M. Rappe, Int. J. Hydrogen Energy, 2017, 42, 3019–3026, DOI:10.1016/j.jpowsour.2009.01.002.
- F. Agresti, A. Khandelwal, G. Capurso, S.-L. Russo, A. Maddalena and G. Principi, Nanotechnology, 2010, 21, 065707, DOI:10.1088/0957-4484/21/6/065707.
- M. Au, A. Jurgensen and K. Zeigler, J. Phys. Chem. B, 2006, 110, 26482–26487, DOI:10.1021/jp065490h.
- Z.-Z. Fang, X.-D. Kang, H.-B. Dai, M.-J. Zhang, P. Wang and H.-M. Cheng, Scr. Mater., 2008, 58, 922–925, DOI:10.1016/j.scriptamat.2008.01.024.
- X. Liu, D. Peaslee, C.-Z. Jost and E.-H. Majzoub, J. Phys. Chem. C, 2010, 114, 14036–14041, DOI:10.1021/jp1055045.
- S. Thiangviriya and R. Utke, Int. J. Hydrogen Energy, 2015, 40, 4167–4174, DOI:10.1016/j.ijhydene.2015.01.144.
- W. Cai, J. Chen, L. Liu, Y. Yang and H. Wang, J. Mater. Chem. A, 2018, 6, 1171–1180, 10.1039/c7ta09376d.
- J. Shao, X. Xiao, X. Fan, X. Huang, B. Zhai, S. Li, H. Ge, Q. Wang and L. Chen, Nano Energy, 2015, 15, 244–255, DOI:10.1016/j.nanoen.2015.04.023.
- J. Shao, X. Xiao, X. Fan, L. Zhang, S. Li, H. Ge, Q. Wang and L. Chen, J. Phys. Chem. C, 2014, 118, 11252–11260, DOI:10.1021/jp503127m.
- R.-N. Muthu, S. Rajashabala and R. Kannan, Int. J. Hydrogen Energy, 2017, 42, 15586–15596, DOI:10.1016/j.ijhydene.2017.04.240.
- W. Cai, J. Hou, P. Tao and Y. Yang, J. Alloys Compd., 2018, 750, 443–450, DOI:10.1016/j.jallcom.2018.04.022.
- J. Zhu, H. Wang, W. Cai, J. Liu, L. Ouyang and M. Zhu, Int. J. Hydrogen Energy, 2017, 42, 15790–15798, DOI:10.1016/j.ijhydene.2017.03.150.
- J.-A. Puszkiel, M.-C. Riglos, F. Karimi, A. Santoru, C. Pistidda, T. Klassen, J.-B. von Colbe and M. Dornheim, Phys. Chem. Chem. Phys., 2017, 19, 7455–7460, 10.1039/c6cp08278e.
- R. Gosalawit-utke, S. Meethom, C. Pistidda, C. Milanese, D. Laipple, T. Saisopa, A. Marini, T. Klassen and M. Dornheim, Int. J. Hydrogen Energy, 2014, 39, 5019–5029, DOI:10.1016/j.ijhydene.2014.01.078.
- J. Huang, Y. Yan, L. Ouyang, H. Wang, J. Liu and M. Zhu, Dalton Trans., 2014, 43, 410–413, 10.1039/c3dt51989a.
- S. Kato, M. Bielmann, A. Borgschulte, V. Zakaznova-Herzog, A. Remhof, S.-I. Orimo and A. Züttel, Phys. Chem. Chem. Phys., 2010, 12, 10950–10955, 10.1039/c000299b.
- R. Das, S. Bee Abd Hamid, E. Ali, S. Ramakrishna and W. Yongzhi, Curr. Nanosci., 2014, 11, 23–35, DOI:10.2174/1573413710666140818210043.
- V. D’ Anna, A. Spyratou, M. Sharma and H. Hagemann, Spectrochim. Acta, Part A, 2014, 128, 902–906, DOI:10.1016/j.saa.2014.02.130.
- H. Benzidi, M. Garara, M. Lakhal, M. Abdalaoui, A. Benyoussef, A. El, M. Louilidi, M. Hamedoun and O. Mounkachi, Int. J. Hydrogen Energy, 2018, 43, 6625–6631, DOI:10.1016/j.ijhydene.2018.02.042.
- W. Cai, H. Wang, D. Sun, Q. Zhang, X. Yao and M. Zhu, RSC Adv., 2014, 4, 3082–3089, 10.1039/c3ra45847d.
- B.-M. Concha, M. Chatenet, C. Coutanceau and F. Hahn, Electrochem. Commun., 2009, 11, 223–226, DOI:10.1016/j.elecom.2008.11.018.
- K.-B. Harvey and N. R. Mcquaker, Can. J. Chem., 1971, 49, 3282–3286, DOI:10.1139/v71-546.
- P.-S. Miedema, P. Ngene, A. M. J. Van Der Eerden, D. Sokaras, T.-C. Weng, D. Nordlund, Y.-S. Au and F. M. F. De Groot, Phys. Chem. Chem. Phys., 2014, 16, 22651–22658, 10.1039/c4cp02918f.
- S. Gomes, H. Hagemann and K. Yvon, J. Alloys Compd., 2002, 346, 206–210, DOI:10.1016/S0925-8388(02)00668-0.
- C.-D. Wagner, W.-M. Riggs, L.-E. Davis, J.-F. Moulder and G.-E. Muilenberg, Handbook of X-ray Photoelectron Spectroscopy, Perkin-Elmer, Eden Prairie, MN, 1979, pp. 34–45 and pp. 212–242 Search PubMed.
- W. Haiping, L. Tiecheng, W. Xuemin, G. Fangfang, C. Linhong, Z. Hongliang, L. Chunhong, Y. Xiaohan, J. Xin and W. Weidong, Corros. Sci., 2011, 53, 1115–1119, DOI:10.1016/j.corsci.2010.12.009.
- L. Guo, Y. Li, Y. Ma, Y. Liu, D. Peng, L. Zhang and S. Han, Int. J. Hydrogen Energy, 2016, 42, 2215–2222, DOI:10.1016/j.ijhydene.2016.11.184.
- F. Cova, F.-C. Gennaria and P. Arneodo Larochette, RSC Adv., 2015, 5, 90014–90021, 10.1039/c5ra19504g.
- D. Silambarasan, V.-J. Surya, V. Vasu and K. Iyakutti, Int. J. Hydrogen Energy, 2011, 36, 3574–3579, DOI:10.1016/j.ijhydene.2010.12.028.
| This journal is © The Royal Society of Chemistry 2019 |

