
 Open Access Article
 This Open Access Article is licensed under a Creative Commons Attribution-Non Commercial 3.0 Unported Licence
Low pH constructed Co(II) and Ni(II) 1D coordination polymers based on Cα-substituted analogues of zoledronic acid: structural characterization, and spectroscopic and magnetic properties†
Tomasz
Rojek
 *a,
Waldemar
Goldeman
a,
Katarzyna
Ślepokura
b,
Marek
Duczmal
a,
Agnieszka
Wojciechowska
a and
Ewa
Matczak-Jon
a
*a,
Waldemar
Goldeman
a,
Katarzyna
Ślepokura
b,
Marek
Duczmal
a,
Agnieszka
Wojciechowska
a and
Ewa
Matczak-Jon
a
aDepartment of Chemistry, Wrocław University of Science and Technology, Wybrzeże Wyspiańskiego 27, 50-370 Wrocław, Poland. E-mail: ewa.matczak-jon@pwr.edu.pl
bFaculty of Chemistry, University of Wrocław, Joliot-Curie 14, 50-383 Wrocław, Poland
First published on 7th October 2019
Abstract
Three novel coordination compounds based on α,α-disubstituted analogues of zoledronic acid with a cyclopropane (cpp) or cyclobutane (cbt) ring on the Cα carbon, isomorphous [Co(H2cppZol)(H2O)]·H2O (1a), [Ni(H2cppZol)(H2O)]·H2O (1b) and [Co(H2cbtZol)(H2O)]·H2O (2a), were synthesized under hydrothermal conditions at low pH. Single-crystal X-ray diffraction analysis revealed that all the compounds had a 1D double zig–zag chain architecture with an 8 + 8 ring motif formed by alternately arranged symmetrical (–O–P–O–)2 bridges linking equivalent octahedral metal centres. Both the ligand coordination mode and chain architecture displayed by 1a, 1b and 2a are unique among 1D [M(H2L)(H2O)x]·yH2O coordination polymers based on nitrogen-containing bisphosphonates reported so far. All the compounds exhibit similar decomposition pathways upon heating with thermal stabilities decreasing in the order 1b > 1a > 2a. The IR spectra revealed that lattice water release above 227, 178 and 97 °C, respectively, does not change the chain architecture leaving them intact up to ca. 320, 280 and 240 °C. Magnetic behaviour investigations indicated that 1a, 2a and 1b exhibit weak alternating antiferromagnetic–ferromagnetic exchange interactions propagated between the magnetic centres through double (–O–P–O–)2 bridges. The boundary between antiferro- and ferromagnetic couplings for the Co–O⋯O–Co angle in 1a and 2a was estimated to be ca. 80°. This value is also applicable for recently reported [M3(HL)2(H2O)6]·6H2O (M = Co, Ni) complexes based on α,α-disubstituted analogues of zoledronic acid and can be used to the explain magnetic behaviour of 1b.
1. Introduction
Organophosphonic acids are a class of ligands widely known for their excellent affinity for metal ions. The propensity to coordinate and bridge various metal centres resulting from multiple O-donor atoms occurring in tetrahedral phosphonic/phosphonate group(s) allows them to form coordination compounds with diverse supramolecular architectures1 and promising applications in the field of catalysis,2 gas storage,3 biotechnology,4 photoluminescence5 or magnetism.6 Therefore, metal-organophosphonate solids belong to an important and extensively developed class of functional materials.Among a wide range of organophosphonate ligands, special attention has been concentrated on the family of H2O3P–C(R1)(R2)–PO3H2 bisphosphonic acids (BPs), which due to presence of geminal phosphonic groups attached to the carbon atom can capture a large number of metal ions simultaneously. Moreover, using various synthesis conditions and/or introducing donor-rich functional groups in R1 and/or R2 positions allows them to control both nuclearity and dimensionality of metal-bisphosphonate materials.7 This can be primarily realized by controlling the pH-dependent protonation state of phosphonate and other functional groups of ligand. In addition, other factors such as the nature and geometry of selected metal centre, steric strain imposed by R1/R2 substituents as well as an introduction of auxiliary ligands have significant impact on the architecture of desired compounds.8 To achieve pure phase materials, hydrothermal technique is commonly used in the synthesis of BPs-based coordination compounds. Therefore, careful determination of appropriate reaction conditions such as: metal-to-ligand stoichiometric ratio, temperature or reaction time also play a significant role.
To explore and expand the area of metal-BPs coordination compounds we have focused our research on new derivatives of zoledronic acid, H4Zol (Scheme 1). This compound is a member of N-containing bisphosphonates family (NBPs), currently considered to be the most potent agent in the treatment of bone diseases9 and successfully exploited as multidentate ligand suitable for a synthesis of various metal complexes.10 With the aim to determine how structural modifications of H4Zol imply topologies and architectures of coordination compounds formed with d-block metal ions, we synthesized a series of its derivatives with sterically demanding substituents on Cα atom, such as methyl groups (H4dmtZol), a cyclopropane (H4cppZol), cyclobutane (H4cbtZol) or cyclopentane (H4cptZol) ring.11 All the ligands were structurally characterized12,13 and examined for their ability to interact with Co(II) and Ni(II) under different pH conditions. Our recent studies have demonstrated that at pH ca. 4.0–5.0, both cations form one-dimensional coordination polymers with a general formula M3(HL)2(H2O)6·6H2O (M = Co(II), Ni(II), HL = HdmtZol3−, M = Co(II), HL = HcppZol3−, HcbtZol3−)12–14 or M3(HL)2(H2O)4·2H2O (M = Co(II), HL = HcptZol3−),13 featuring alternately arranged [M22(HL)(H2O)2]2 entities and {M1O6} octahedrons with crystallographically and spectroscopically distinct M2 and M1 centres. In contrast, less sterically hindered HZol3− ligand tends to form under similar conditions 2D and 3D coordination networks.15
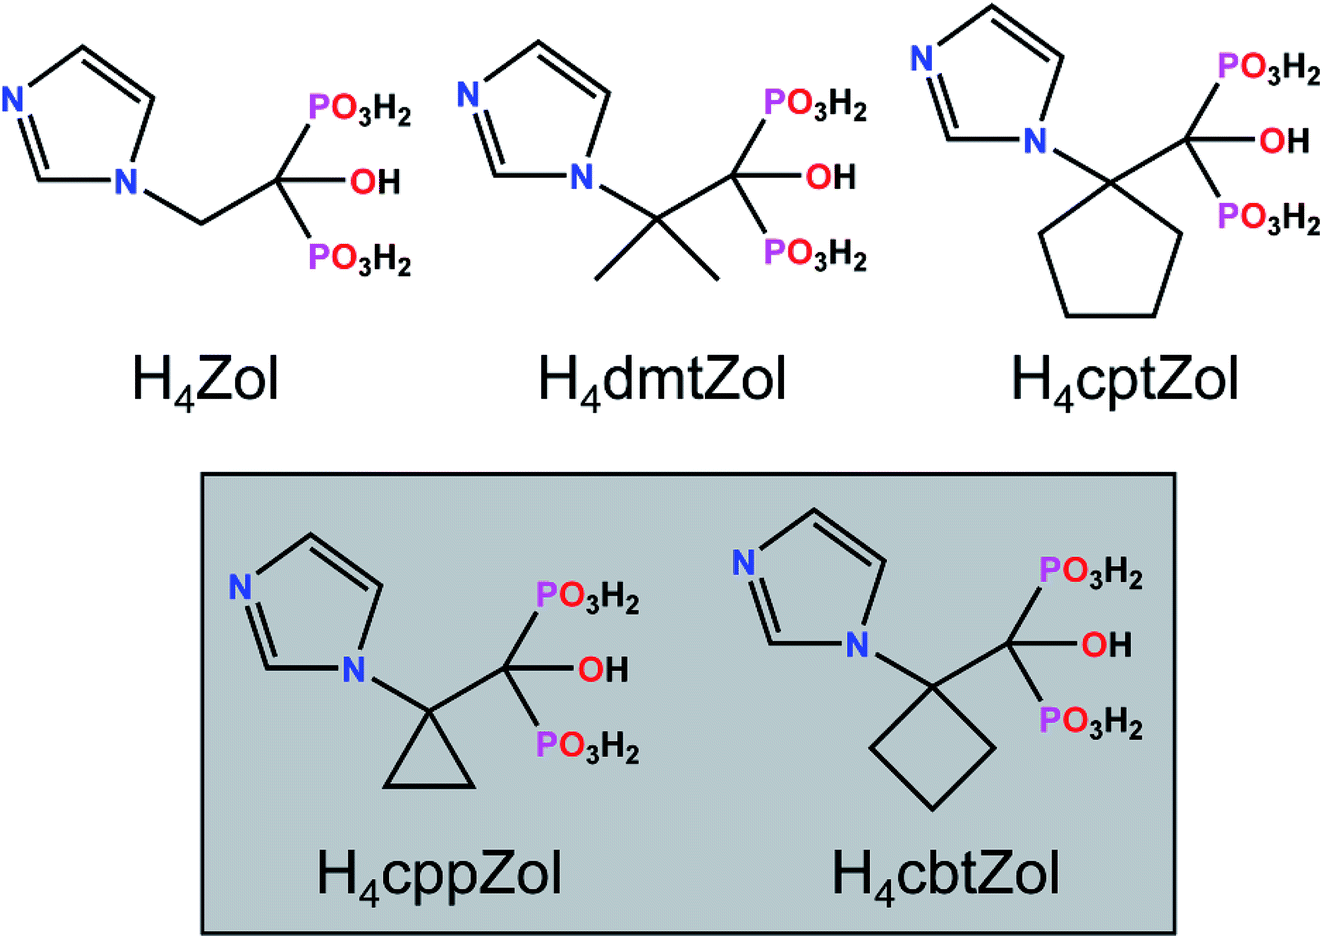 | ||
| Scheme 1 Zoledronic acid and its α,α-disubstituted analogues. | ||
In this article we show that carrying the reaction at lower pH affords diverse systems architecture. By reacting Co(II) or Ni(II) chlorides with H4cppZol (1) or H4cbtZol (2) (Scheme 1) under hydrothermal conditions at 2.5–3.5 pH range we synthesized a series of 1D coordination polymers: isomorphous [Co(H2cppZol)(H2O)]·H2O (1a), [Ni(H2cppZol)(H2O)]·H2O (1b) and [Co(H2cbtZol)(H2O)]·H2O (2a).
The search in the Cambridge Structural Database (CSD)16 has revealed almost twenty crystal structures of similar 1D [M(H2L)(H2O)x]·yH2O (x = 0–1, y = 0–3) coordination polymers based on various NBPs. (Table S1, ESI†). Among them, d-block metal complexes of the type [M(H2L)]·xH2O (x = 0–3; M = Cd(II), Zn(II), Mn(II), Co(II), Cu(II), H2L2− = 2-(4-pyridinyl)-1-hydroxyl-1,1-ethylidenediphosphonate;17 M = Mn(II), Cd(II), H2L2− = risedronate;18 M = Mn(II), Cu(II), H2L2− = pamidronate;19 M = Mn(II), H2L2− = alendronate,20 zoledronate21) and [M(H2L)(H2O)] (M = Fe(II), Co(II), Mn(II), H2L2− = risedronate22) have been found to reveal the ladder chain architecture. Commonly, in this type of structures, phosphonate μ2-O bridges link two equivalent metal centres into a four-membered (MO)2 dinuclear unit, whereas phosphonate O–P–O bridges connect adjacent dinuclear units to form eight-membered (M–O–P–O)2 rings resulting in double 1D infinite chain. It is to note, that formation of such 4 + 8 rings motif along the coordination chain is favoured regardless of varying geometries and nature of metal centres17–22 as well as subtle differences in ligands coordination modes (Fig. S1a–d, ESI†).22 The double zig–zag chain architecture is characteristic for Ca(II) complexes. The four-membered ring motif generated by μ2-O bridges between metal centres is propagated along double chains displayed by seven-coordinate [Ca(H2Pam)(H2O)]·H2O and [Ca(H2Zol)(H2O)] (Fig. S2a, ESI†)23. On the other hand, six-coordinate [Ca(H2Ale)]·H2O complex represents the structure, in which a combination of phosphonate O–P–O and μ2-O bridges between metal centres leads to 6 + 6 rings motif propagated along the coordination chain (Fig. S2b, ESI†).24
Herein, we report the structures of 1a, 1b and 2a determined by single-crystal X-ray diffraction and their detailed characterization with the use of TG-DTA, DSC, FT-IR, NIR-UV/Vis techniques and magnetic susceptibility measurements. Interestingly, both ligands coordination mode and chains architecture of the reported compounds are unique among NBPs-based [M(H2L)(H2O)x]·yH2O coordination polymers reported so far.
2. Experimental
2.1 Materials
All commercially available reagents and solvents were used as received without further purification. 1-Hydroxy-2-[1-(1H-imidazol-1-yl)cyclopropyl]ethylidene-1,1-diphosphonic acid (H4cppZol) and 1-hydroxy-2-[1-(1H-imidazol-1-yl)cyclobutyl] ethylidene-1,1-diphosphonic acid (H4cbtZol) were synthesized according to previously described procedure.11 Details of synthesis and purity confirmation of both ligands are reported in ref. 12 and 13.2.2 Synthesis of Co(H2cppZol)(H2O)·H2O (1a)
H4cppZol (0.10 mmol, 0.0298 g) and CoCl2·6H2O (0.05 mmol, 0.0119 g) were dissolved in water (5 ml). Then, the pH of the reaction mixture was adjusted to 2.5 by 1 M NaOH. The obtained clear and pink solution was sealed in a glass tube and heated at 100 °C for 72 h. After the reaction system had been cooled slowly to room temperature, pink crystals of 1a were isolated, washed with distilled water and dried at room temperature. Crystals were collected as a monophasic material based on the powder XRD (Fig. S3, ESI†). Yield 16.4 mg (41.6% based on H4cppZol). Elemental anal. found (calc.) for C7H14CoN2O9P2 (%): C, 21.70 (21.49); H, 3.31 (3.61); N, 7.09 (7.16). IR (ATR, cm−1): 3605 br & w, 3356 br & w, 3145 w, 3043 br & w, 2936 br & w, 1659 w, 1620 w, 1582 w, 1534 w, 1461 w, 1424 w, 1398 w, 1348 w, 1216 w, 1196 w, 1172 w, 1161 w, 1120 m, 1071 s, 1048 s, 1020 s, 1001 s, 977 m, 946 s, 901 m, 888 s, 874 s, 845 s, 804 m, 791 m, 770 m, 700 m, 655 s, 631 m, 614 s, 560 s, 544 s, 528 s, 488 s, 465 s, 449 s, 410 s.2.3 Synthesis of Ni(H2cppZol)(H2O)·H2O (1b)
H4cppZol (0.10 mmol, 0.0298 g) and NiCl2·6H2O (0.07 mmol, 0.0167 g) were dissolved in water (5 ml). Then, the pH of the reaction mixture was adjusted to 2.9 by 1 M NaOH. The obtained clear and green solution was sealed in a glass tube and heated at 100 °C for 72 h. After the reaction system had been cooled slowly to room temperature, green crystals of 1b were isolated, washed with distilled water and dried at room temperature. Crystals were collected as a monophasic material based on the powder XRD (Fig. S4, ESI†). Yield 11.6 mg (29.5% based on H4cppZol). Elemental anal. found (calc.) for C7H14NiN2O9P2 (%): C, 21.66 (21.51); H, 3.40 (3.62); N, 7.01 (7.17). IR (ATR, cm−1): 3606 br & w, 3350 br & w, 3146 w, 3042 br & w, 2933 br & w, 1644 w, 1620 w, 1582 w, 1533 w, 1460 w, 1426 w, 1401 w, 1347 w, 1218 w, 1195 w, 1175 w, 1162 w, 1125 m, 1070 s, 1048 s, 1020 s, 1000 s, 945 s, 890 s, 849 s, 808 m, 793 m, 772 m, 701 m, 654 s, 631 m, 615 s, 546 s, 529 s, 488 s, 468 s, 450 s, 415 s.2.4 Synthesis of Co(H2cbtZol)(H2O)·H2O (2a)
H4cbtZol (0.10 mmol, 0.0312 g) and CoCl2·6H2O (0.10 mmol, 0.0238 g) were dissolved in water (5 ml). Then, the pH of the reaction mixture was adjusted to 3.5 by 1 M NaOH. The obtained clear and pink solution was sealed in a glass tube and heated at 100 °C for 72 h. After the reaction system had been cooled slowly to room temperature, pink crystals of 2a were isolated, washed with distilled water and dried at room temperature. Crystals were collected as a monophasic material based on the powder XRD (Fig. S5, ESI†). Yield 21.3 mg (52.2% based on H4cbtZol). Elemental anal. found (calc.) for C8H16CoN2O9P2 (%): C, 23.74 (23.71); H, 3.61 (3.99); N, 6.80 (6.92). IR (ATR, cm−1): 3600 br & w, 3526 br & w, 3360 br & w, 3176 w, 3151 w, 3119 w, 3057 br & w, 3033 br & w, 3001 br & w, 2966 br & w, 1653 w, 1609 w, 1584 w, 1534 w, 1480 w, 1465 w, 1443 w, 1386 w, 1354 w, 1319 w, 1276 w, 1230 w, 1203 w, 1179 m, 1128 w, 1089 s, 1063 s, 1038 s, 1013 s, 986 s, 948 s, 872 s, 837 s, 786 m, 771 m, 741 m, 655 s, 629 m, 604 s, 537 s, 511 s, 467 s, 439 s.2.5 X-ray crystallography
Crystallographic measurements for 1a, 1b and 2a were performed on κ-geometry diffractometer Agilent Technologies Xcalibur R with a Ruby CCD camera and with graphite monochromatized MoKα radiation at 110, 100 and 80 K, respectively, using an Oxford Cryosystems cooler. Data collection, cell refinement, data reduction and analysis as well as analytical absorption correction were carried out with CrysAlisPro.25 The crystal structures of 1b and 2a were solved with direct methods using SHELXS-97 (ref. 26) and refined on F2 by a full-matrix least squares technique with SHELXL-2014 (ref. 27) with anisotropic thermal parameters for all the ordered non-H atoms. As complex 1a is isomorphous with 1b, the refinement was started by using the coordinates of heavy (non-H) atoms taken from 1b and further refined as described above.H atoms in 1a, 1b and 2a were found in difference Fourier maps and were refined isotropically. In the final refinement cycles, all C-bound H atoms, as well as N-bound H atoms in 1a and 1b, were repositioned in their calculated positions and refined using a rigid model, with C–H = 0.95–0.99 Å, N–H = 0.88 Å, and with Uiso(H) = 1.2Ueq(C, N). The H atoms of hydroxyl group in 1a, 1b and 2a, phosphonate group in 2a and all attached to water molecules were refined with the O–H bond lengths restrained to 0.840(2) Å and with Uiso(H) = 1.5Ueq(O). Then the AFIX 147 and AFIX 3 riding models were used to constrain phosphonate H atoms in 1a, 1b and 2a. Additionally, the H⋯H distances in the water molecules were restrained to 1.360(2) or 1.380(2) Å in 1a, 1b or 2a, respectively. N-bound H atom in 2a was refined with the N–H distance restrained to 0.880(2) Å and with Uiso(H) = 1.2Ueq(N). Then, it was constrained to ride on its parent N atom (AFIX 3 instruction).
Crystallographic data and structure refinement parameters are summarized in Table 1 and the crystallographic information files (CIFs) deposited at the Cambridge Crystallographic Data Centre (CCDC no. 1940766–1940768) and provided as ESI.† All figures were made using the DIAMOND program.28
| Compound | 1a | 1b | 2a |
|---|---|---|---|
| CCDC no. | 1940766 | 1940767 | 1940768 |
| Chemical formula | C7H14CoN2O9P2 | C7H14N2NiO9P2 | C8H16CoN2O9P2 |
| M r | 391.07 | 390.85 | 405.10 |
| Crystal system | Triclinic | Triclinic | Monoclinic |
| Space group |
P![[1 with combining macron]](https://www.rsc.org/images/entities/char_0031_0304.gif) |
P |
C2/c |
| a (Å) | 7.848(3) | 7.816(3) | 13.666(4) |
| b (Å) | 7.886(3) | 7.849(3) | 8.447(2) |
| c (Å) | 10.880(5) | 10.849(4) | 22.247(5) |
| α (°) | 90.97(3) | 91.03(3) | |
| β (°) | 93.60(3) | 93.26(3) | 94.45(3) |
| γ (°) | 114.95(3) | 114.92(3) | |
| V (Å3) | 608.6(5) | 602.0(4) | 2560.4(11) |
| T (K) | 110 | 100 | 80 |
| Z | 2 | 2 | 8 |
| D c (g cm−3) | 2.134 | 2.156 | 2.102 |
| μ (mm−1) | 1.73 | 1.93 | 1.65 |
| Crystal size (mm) | 0.12 × 0.04 × 0.04 | 0.12 × 0.01 × 0.01 | 0.27 × 0.06 × 0.02 |
| Diffractometer | Agilent Technologies, Xcalibur R, Ruby | Agilent Technologies, Xcalibur R, Ruby | Agilent Technologies, Xcalibur R, Ruby |
| Absorption correction | Analytical | Analytical | Analytical |
| T min, Tmax | 0.855, 0.941 | 0.873, 0.973 | 0.796, 0.969 |
| Radiation type | Mo Kα | Mo Kα | Mo Kα |
| Wavelength (Å) | 0.71073 | 0.71073 | 0.71073 |
| F(000) | 398 | 400 | 1656 |
| Refl. measured | 16![[thin space (1/6-em)]](https://www.rsc.org/images/entities/char_2009.gif) 719 719 |
5948 | 9127 |
| Refl. independent | 5098 | 3636 | 3029 |
| Refl. observed [I > 2σ(I)] | 3840 | 1815 | 2510 |
| No. of parameters | 192 | 192 | 200 |
| No. of restrains | 7 | 133 | 9 |
| R int | 0.038 | 0.062 | 0.027 |
| (sinθ/λ)max (Å−1) |
0.679 | 0.605 | 0.680 |
| R[F2> 2σ(F2)] | 0.033 | 0.042 | 0.032 |
| wR(F2) | 0.064 | 0.060 | 0.075 |
| S | 0.93 | 0.70 | 1.04 |
| Δρmax, Δρmin (e Å−3) | 0.51, −0.59 | 0.84, −0.75 | 0.49, −0.57 |
2.6 Powder X-ray diffraction analysis
PXRD data were collected on a Bruker D8-Advance diffractometer equipped with a VÅNTEC-1 detector (λCuKα = 1.5418 Å). The equipment was operated at 30 kV and 40 mA, and data were collected at room temperature in the range of 2θ = 5–50°.2.7 ATR FT-IR measurements
The ATR FT-IR (ATR is attenuated total reflectance) spectra were recorded on a Bruker Vertex 70v Fourier transform IR spectrometer equipped with a diamond ATR cell. The spectral data were collected at room temperature over the range 4000–400 cm−1 with a resolution of 4 cm−1. Instrument control and initial data processing were performed using OPUS software (v. 7.0 Bruker Optics, Ettlingen, Germany).2.8 Thermal analysis
Thermogravimetric analysis (TG-DTA) was carried out using a Setaram SETSYS 16/18 analyzer, operating under a nitrogen atmosphere, with a heating rate of 5 K min−1 in the range 303–1273 K (sample mass of 10.3, 8.6 and 11.0 mg for 1a, 1b and 2a, respectively). Differential Scanning Calorimetry (DSC) measurements were performed on a Setaram DSC 92 instrument. Samples (3.2–7.0 mg) were contained in alumina pans in the presence of air as the furnace atmosphere. Measurements were performed from ambient temperature up to 219, 314, 387, 457 and 600 °C for 1a, 284, 352, 529 and 600 °C for 1b and 175, 329, 525 and 600 °C for 2a with a heating rate of 5 K min−1.2.9 NIR-UV/Vis-spectroscopic studies
The NIR-UV/Vis diffuse-reflectance electronic spectra of 1a, 1b, 2a and ligands 1 and 2 were measured on a Cary 500 Scan spectrophotometer over the range 5000–50000 cm−1 with measure step of 10 cm−1 at room temperature. The spectra were recorded with identical parameters as a white reference sample. To obtain the band positions of components of d–d bands in the spectra of cobalt(II) (1a, 2a) and nickel(II) (1b) complexes the variable digital method29 was used with the following parameters: step = 20 cm−1, α = 400 and N = 40 (1a); step = 20 cm−1, α = 400 and N = 30 (2a); and step = 20 cm−1, α = 500, N = 40 (1b).
2.10 Magnetic measurements
Magnetic susceptibility in the temperature range from 1.7 to 300 K in a field of 100 mT (1a and 2a) or 500 mT (1b) and magnetization up to 5 T were measured with a Quantum Design SQUID magnetometer. Diamagnetic corrections (−202 × 10−6, −212 × 10−6 and −202 × 10−6 emu mol−1 for 1a, 2a and 1b, respectively) were calculated using Pascal's constants. The exchange Hamiltonian in the form H = −JS1S2 was used consistently throughout the paper. All values of magnetization and magnetic susceptibility are reported per mole of metal.3. Results and discussion
3.1 Syntheses of 1a, 1b and 2a
Compounds 1a, 1b and 2a were synthesized through hydrothermal reaction at 100 °C for 72 h. However, despite their similarity, obtaining pure phase, the best yield and the highest crystals quality required each reaction to proceed under specific conditions.Compounds 1a and 1b were synthesized with the use of H4cppZol and CoCl2·6H2O or NiCl2·6H2O salts. The highest yields and qualities of crystalline products were achieved in a narrow pH range 2.4–2.6 for 1a and 2.8–3.0 for 1b. The decrease in pH below the optimum value resulted in reduction of yield without product deterioration. The increase of pH up to ca. 3.5 lead to increase of the reaction yield accompanied by significant deterioration of 1a and 1b while in the pH range 3.5–4.0 minor amount of previously reported Co3(HcppZol)2(H2O)6·6H2O12 or unrecognized green amorphous solid were observed, respectively. Regardless of the reaction pH, the excess of ligand was desirable. It was found that optimum H4cppZol:Co(II)/Ni(II) molar ratios to obtain pure phases of 1a and 1b are 2–1.5:1 and 1.5:1, respectively. The use of stoichiometric amount of reagents or an excess of metal salt resulted in deterioration of crystals quality and reduction of reaction yield even if the most appropriate pH was reached.
The most favourable pH to obtain optimal crystallinity and reaction yield of 2a is ca. 3.0–4.0. Additionally, both stoichiometric amount of reagents or an excess of ligand (H4cbtZol:Co(II) molar ratio 1.5–1:1) can be used. At pH below 3.0, the decrease of yield without negative impact on product quality was observed while a mixture of 2a and unidentified, pink, amorphous impurities were obtained above pH 4.0.
The most appropriate for the synthesis of 1a, 1b and 2a are Co(II) and Ni(II) chloride salts. Additionally, 2a can be obtained when cobalt(II) chloride is replaced by sulphate salt. Attempts to prepare 1a, 1b and 2a by using Co(II)/Ni(II) acetates were unsuccessful.
3.2 Crystal structures of 1a, 1b and 2a
The isomorphous compounds 1a, 1b crystallize in triclinic P, and 2a in monoclinic C2/c space group as one-dimensional coordination polymers. Table 1 summarizes all crystal data and structure refinement parameters. Selected geometrical parameters and proposed hydrogen bonds are collected in Tables S2–S4 (ESI†).
The asymmetric units of 1a, 1b and 2a consist of one M1 centre (M1 = Co(II) in 1a and 2a or Ni(II) in 1b), one coordinated H2L2− ligand (H2L2− = H2cppZol2− in 1a and 1b or H2cbtZol2− in 2a), one coordinated and one lattice water molecule. In all the compounds, the central atom adopts slightly distorted octahedral geometry with equatorial sites occupied by O2, O7 O4i/iii and O1W atoms and axial sites filled by O6, and O1ii/iv atoms (Fig. 1 and S6, ESI†). The average equatorial and axial M1–O distances calculated based on data from Table S3 (ESI†), of 2.118 and 2.059 Å in 1a, 2.097 and 2.048 Å in 1b and 2.152 and 2.054 Å in 2a, result in tetragonality distortion T index defined as T = Rint/Rout (Rint and Rout are the average in-plane and out-of-plane M–O (M = Co, Ni) distances30) of 1.03, 1.02 and 1.05, respectively, thus indicating slight compression of octahedrons along the axial O2–M1–O4i/iii bond.
 | ||
| Fig. 1 The building unit and the atom-numbering scheme of (a) the representative compound 1a and (b) 2a. Lattice water molecules are omitted for clarity. Displacement ellipsoids for non-H atoms (except Co1) are drawn at 80% probability level. (c) Coordination environments of Co1 centre in 1a and 2a. Symmetry codes are given in Table S3 (ESI†). | ||
In all 1a, 1b and 2a, coordinated ligands contain protonated imidazole N atom, one fully deprotonated and one monoprotonated phosphonate group yielding the overall charge −2. The values of N1–C2–C1–O7 dihedral angles of 165.1(2)°, 165.3(4)° and −172.7(2)°, respectively, (Table S2, ESI†) clearly demonstrate the same ap conformation of coordinated H2cppZol2−/H2cbtZol2− ligands, recently demonstrated to be rare among NBP's and their anions within coordination compounds and salts.31 In such arrangement, each ligand exhibits a preference for chelating-bridging mode donating five oxygen atoms to coordinate three M1 (M1 = Co(II)/Ni(II)) ions. The phosphonate O2, O6 and hydroxyl O7 atoms coordinate one M1 centre in a tridentate fashion whereas phosphonate O1 and O4 are involved in monodentate binding of two symmetry related M1ii/iv and M1i/iii. The O5 and protonated O3 atoms remain uncoordinated (Fig. S7, ESI†). As a consequence, the pair of M1 and M1i/iii ions is connected through O4–P2–O6 phosphonate bridges from two equivalent ligands to form dinuclear [M1(H2L)(H2O)]2 unit with puckered, eight-membered (M1–O–P–O)2 ring and M1⋯M1i/iii distance within the ring of 4.850(3) Å in 1a, 4.797(3) Å in 1b and 4.822(2) Å in 2a. The O1–P1–O2 bridges extend dinuclear units into infinite zig–zag double chain running along [110] crystallographic direction in 1a and 1b or along b axis in 2a. As a result another eight-membered ring with M1⋯M1ii/iv distance of 4.841(3) Å in 1a and 1b and 4.859(2) Å in 2a is formed (Fig. S8, ESI†). The O7–H7⋯O6i/iii intermolecular hydrogen bond provides additional stabilization of coordination chain (Fig. 2a, S9a and S10a, ESI†). The chains are extended into 2D hydrogen bonded layer by means of N2–H2N⋯O5vii/x interaction (Fig. 2b, S9b and S10b, ESI†) and further connected into 3D supramolecular network through O1W–H1W⋯O6ix/xii and O1W–H2W⋯O2ix/xii hydrogen bonds between coordinated water molecule and phosphonate oxygen atoms with formation of R22(6) ring motif. Additional stabilization of the supramolecular architecture in 1a and 1b is provided by O2W–H3W⋯O5ix and O2W–H4W⋯O1ii interactions involving O2W lattice water molecules as hydrogen donors (Fig. 2c, S9c and S10c, ESI†).
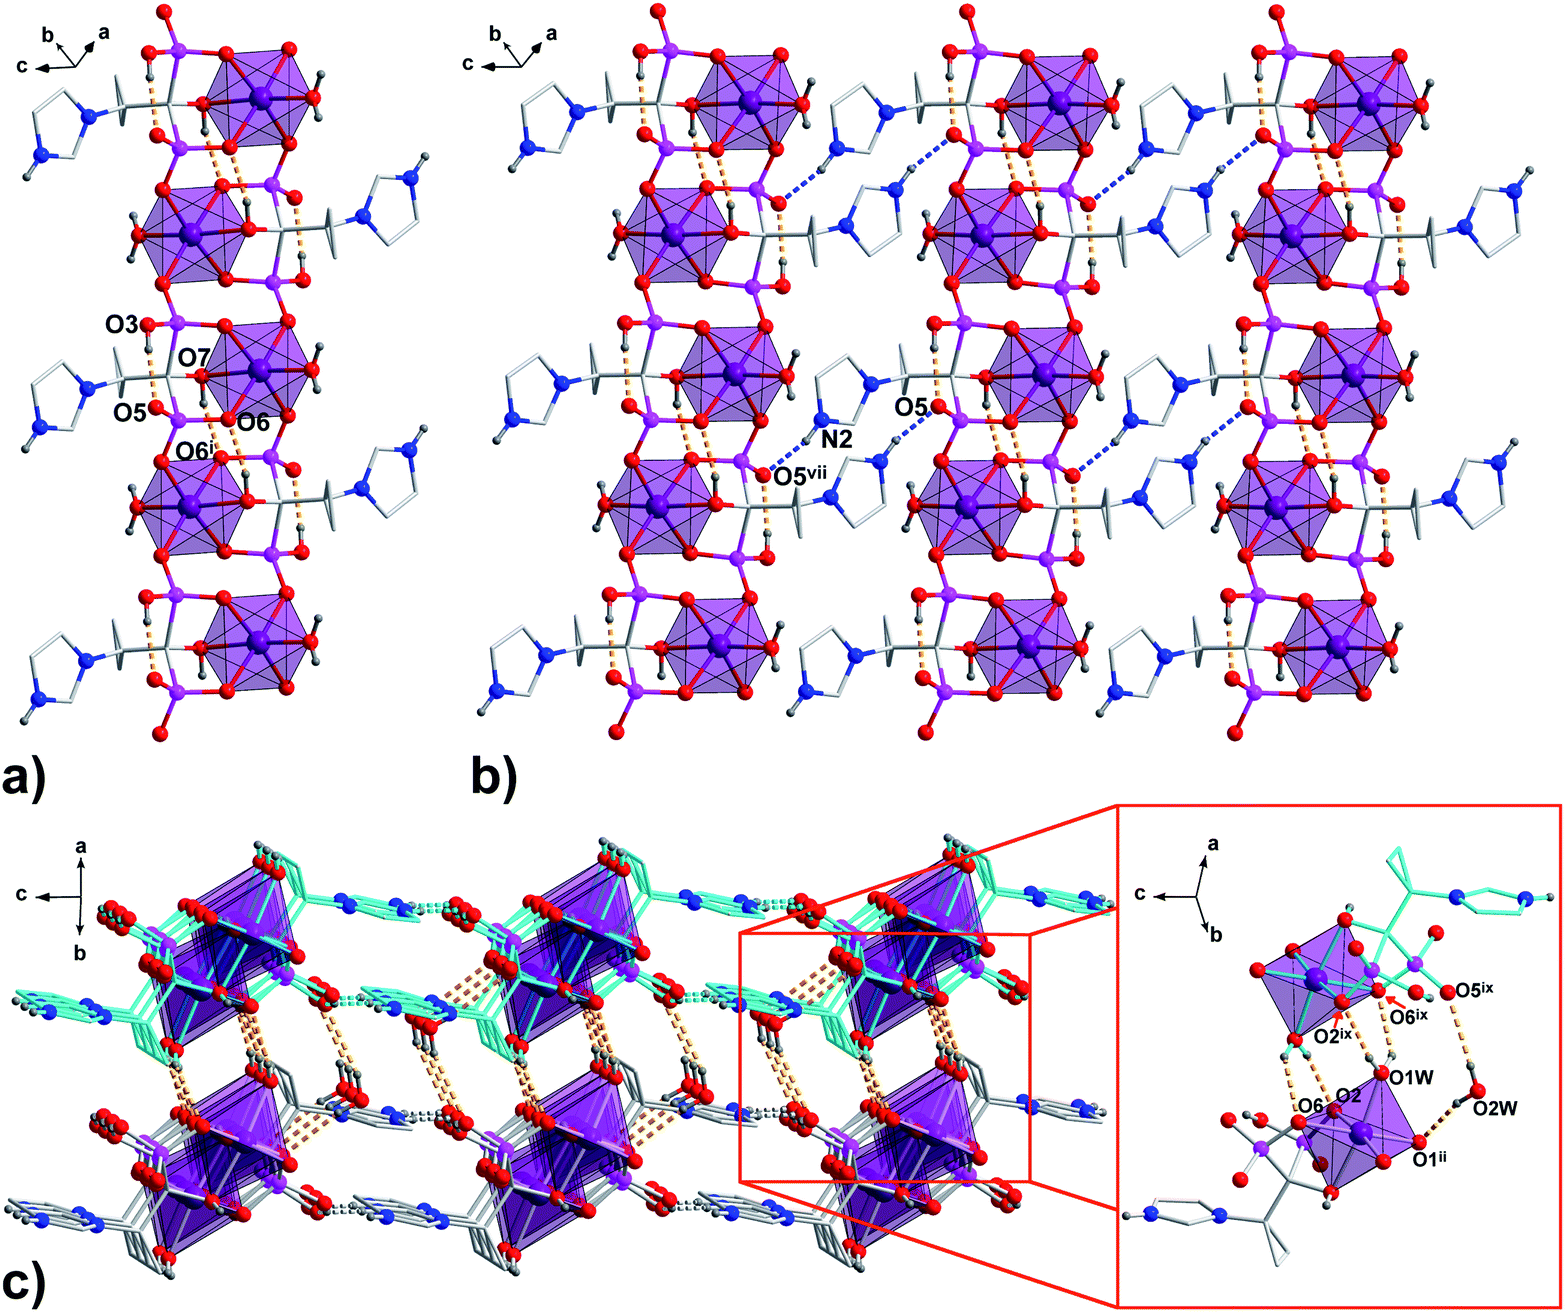 | ||
| Fig. 2 The packing diagram of the representative 1a. (a) 1D polymeric chain running along [110] crystallographic direction; (b) chains organized into 2D layer by N–H⋯O hydrogen bonds are shown as blue dashed lines; (c) 3D supramolecular network formed through connection of adjacent layers by O–H⋯O hydrogen bonds (orange dashed lines) between coordinated and lattice water molecules and phosphonate O-atoms. All H atoms not involved in the creation of hydrogen bonds and lattice water molecules (pictures a and b) are omitted for clarity. Symmetry codes are given in Table S4 (ESI†). | ||
Both ligands binding mode and resulting 8 + 8 rings motif propagated along 1D coordination chains are unique among structures of 1D [M(H2L)(H2O)x]·yH2O (x = 0–1, y = 0–3) coordination polymers based on NBP ligands reported so far (Table S1, ESI†). Somewhat similar behaviour is only noted for the [Zn(H2Ris)] complex.32 However, the fulfilment of both metal and ligand requirements to achieve optimal geometry and energetics leads to tetrahedral geometry maintained by Zn(II) and hydroxyl group of H2Ris2− remaining uncoordinated (Table S1, ESI†). As a result, eight-membered (Zn–O–P–O)2 dinuclear units being common with 1a, 1b and 2a are extended through twelve-membered rings into polymeric ladder-type structure (Fig. S11, ESI†).
3.3 IR characterization of 1a, 1b and 2a
The FT-IR spectra of the compounds 1a, 1b and 2a are presented in Fig. S12–S15 (ESI†). The bands assignment (Table S5, ESI†) is based on detailed analysis of the IR spectra of H4dmtZol, H4cppZol, H4cbtZol, H4cptZol ligands supported by DFT calculations (ref. 31, Fig. S16, S17 and Table S6, ESI†) and tentative assignments for Co(II)/Ni(II) coordination polymers reported previously.12–14The spectra of 1a, 1b and 2a exhibit many common features manifested in location and intensity of characteristic bands assigned to ligand skeleton and functional groups. Additionally, the range 3600–3200 cm−1 is dominated by broad features associated with ν(O–H), ν(PO–H) and ν(N–H) stretching vibrations, consistent with presence of extensive hydrogen bonding involving water molecules (coordinated and lattice), phosphonate and imidazole groups (Table S4, ESI†). A week sharp band at ca. 3150 cm−1 is contributed by ν(C–H) vibrations of imidazole ring. The symmetric and asymmetric C–H stretching vibrations of cyclopropane/cyclobutane CH2 groups give rise to a set of weak bands in the range 3050–2950 cm−1. The band at ca. 1650 cm−1 corresponds to H–O–H bending vibrations of coordinated and lattice water molecules. The stretching vibrations of imidazole C![[double bond, length as m-dash]](https://www.rsc.org/images/entities/char_e001.gif) C, NC and N–C bonds contribute weak bands observed at ca. 1580 and 1530 cm−1. The region gathering most of the bending vibrations attributed to imidazole, cyclopropane/cyclobutane rings as well as hydroxyl C–O–H is located between ca. 1500 and 1150 cm−1. Herein, noticeable differences in the spectra are associated with specific deformation vibrations of Cα substituents.
C, NC and N–C bonds contribute weak bands observed at ca. 1580 and 1530 cm−1. The region gathering most of the bending vibrations attributed to imidazole, cyclopropane/cyclobutane rings as well as hydroxyl C–O–H is located between ca. 1500 and 1150 cm−1. Herein, noticeable differences in the spectra are associated with specific deformation vibrations of Cα substituents.
The phosphonate groups stretching and bending vibrations absorb mainly below 1350 cm−1. Their detailed analysis supported by DFT calculations (see ref. 31 and Table S6, ESI†) have indicated that ν(P–O) vibrations are usually strongly mixed with δ(P–O–H) and stretching/deformation vibrations of imidazole ring and aliphatic substituents, thus making unambiguous interpretation of experimental IR spectra difficult. The bands near 1350 cm−1 are attributed to δ(P–O–H) vibrations. The ν(P–O) modes of P2 pendant O atom give rise to bands at ca. 1120 and 1030 cm−1. The bands at ca. 945 and 840 cm−1 can be considered as contributed by ν(P–O) vibrations involving Co(II)/Ni(II)-coordinated phosphonate O atoms. The ν(P–OH) vibrations of P1 group contribute bands at lower 790–770 cm−1 wavenumbers. The vibrations contributed mostly by stretching of the C–P bond also appear below 800 cm−1. The δ(O–P–O) deformation vibrations of phosphonate groups are observed around 500 cm−1.
3.4 Thermal stabilities of 1a, 1b and 2a
Thermal decomposition of 1a, 1b and 2a was investigated on crystalline samples by means of TG-DTA and DSC experiments conducted from room temperature up to 1000/600 °C under nitrogen and air atmosphere, respectively. Fig. 3 compiles TG curves in the temperature range 30–600 °C. Full set of experimental data is collected in Fig. S18–S23 (ESI†). | ||
| Fig. 3 TG curves recorded for 1a, 1b and 2a. | ||
The studied compounds exhibit similar decomposition pathways with thermal stabilities decreasing in the order 1b > 1a > 2a. The first step, taking place in the temperature ranges 236–271 °C (1b), 190–218 °C (1a) and 121–169 °C (2a), corresponds to release of lattice water molecule accompanied by weight loss of 4.62, 4.54, 5.18% (calcd 4.60, 4.61, 4.45%) with dehydration enthalpies  of 9.98, 9.12, and 30.7 kJ mol−1, respectively. The IR spectra of samples heated up to temperatures at which this process is completed clearly indicate that removal of lattice water has no negative impact on polymeric chains architecture (Fig. S24–S26, ESI†). On further heating up to 600 °C, compounds 1a and 2a behave similarly losing a total 24.4 and 27.9% weight in three distinct exothermic stages with maximum rates of reaction (Tmax) of 303, 367, 430 (1a) and 257, 436, 508 °C (2a). For 1b, only two exothermic processes accompanied by a total weight loss of 15.5% with Tmax of 340 and 470 °C occur. These processes correspond to collapse of coordination chains by breaking M–O bonds, initiated by release of coordinated water molecule, then followed by elimination of Cα-substituents and subsequent release of imidazole rings (Fig. S27–S29, ESI†). However, the IR spectrum shows that in 1b the last process is not completed even at 600 °C (Fig. S30, ESI†).
The last stage of thermal decomposition starts above ca. 700 °C and is characterized by intense 31.5% (1a), 37.7% (1b) and 30.3% (2a) weight losses that can be attributed to combustion of organic parts of ligands. The resultant decomposition products constitute 39.5, 41.1 and 36.7% of initial samples masses and contain likely Co2(P2O7) (1a, 2a) or Ni2(P2O7) (1b) (Fig. S31, ESI†). It is to note, that in contrast to previously analysed Co3(HL)2(H2O)6·6H2O12,13 and Co3(HL)2(H2O)4·2H2O,13 the products of 1a and 2a thermolysis are almost free from other residues (calcd 37.3, 36.03%). A support for such conclusion is provided by IR spectra revealing the absence of a weak band at ca. 1300 cm−1 (Fig. S32 and S33, ESI†).
3.5 NIR-UV/Vis spectroscopic characterization of 1a, 1b and 2a
In all 1a, 1b and 2a the donor oxygen atoms form the chromophore (M = Co(II)/Ni(II)) of pseudo-octahedral geometry compressed along the O4–M–O2 bond (Fig. 1 and S6, ESI†). It is to note, that the magnitude of compression increases with the increase of Cα substituent size (T = 1.03, 1.02 for 1a and 1b, T = 1.05 for 2a).
In the solid-state diffuse-reflectance electronic spectra of 1a and 2a (Fig. 4), the absorption in the 5000 cm−1 to 30000 cm−1 spectral range is attributed to the d–d transitions being characteristic for high-spin Co(II) ion (d7 configuration). The spectra are almost identical with a lot of slightly marked maxima of the broad absorption in the 18000–22000 cm−1 range, thus confirming that crystal-field symmetry is lower than Oh. Consistent with the increase of tetragonal compression of the  octahedron (2a > 1a), the maxima are better resolved in the spectrum of 2a.
 | ||
| Fig. 4 The NIR-Vis-UV diffuse-reflectance electronic spectra of 1a, 2a and H4cppZol, H4cbtZol ligands (Scheme 1) obtained at room temperature. | ||
In the compressed tetragonal crystal field of D4 symmetry, degenerate 4T1g(4F, Oh) level splits into 4A2 + 4E components where the 4A2 is the ground state.33–35 The next quartet 4T2g((4F), Oh) level consists of 4E + 4B2 states, while the 4A2g(4F, Oh) state is nondegenerate and transforms as 4B1.34,36 Likewise, the crystal field of D4 symmetry causes splitting of the last quartet 4T1g((4P), Oh) level into 4E and 4A2 states. As the absorption in 13500–25000 cm−1 spectral range is composed of multiple unresolved bands (Fig. 4), the spectra were deconvoluted with the use of variable digital filtering method29 in order to refine band splitting and obtain energies of its components (Fig. S34, ESI†). The obtained pairs of bands with maxima at 6830 cm−1, 8250 cm−1 (1a) and 6950 cm−1, 8050 cm−1 (2a) are generated by spin-allowed quartet–quartet 4A2 → 4E and 4A2 → 4B2 transitions (4E and 4B2 states from 4T2g(4F) in Oh).37 However, the energy values 6830 cm−1 (1a) and 6950 cm−1 (2a) obtained for the 4A2 → 4E transition are quite ambiguous because of presence of strong ligand bands in the region up to 7000 cm−1. The spin and symmetry forbidden transitions become possible by splitting of the 2Eg(2G, Oh) state into 2A1 + 2B1. Under filtration process the pairs of bands at 10210 cm−1/12510 cm−1 (1a) and 10330 cm−1/12430 cm−1 (2a) clearly appeared and can be assigned to the 4A2 → 2A1 and 4A2 → 2B1 transitions, respectively. The well seen bands found at 14010 cm−1 (1a) and 13890 cm−1 (2a) originate from the spin-allowed quartet–quartet 4A2 → 4B1 transition and are less intense as compared to other spin-allowed transitions. This assignment is drawn based on Wildner research explaining appearance of bands at 13350 cm−1 and 15200 cm−1 in the polarized (β polarization) electronic spectra of tetragonally distorted Co2+ octahedrons in NaCo2(SeO3)2OH37 and kieserite-type CoSO4·H2O and CoSeO4·H2O salts.38 The same approach has also been applied to explain the origin of similar bands in the electronic spectrum of [Co3(HcptZol)2(H2O)4]·2H2O.13
From the 2G term, the 2T1g(2G) and 2T2g(2G) states split into pairs of 2A2 + 2E and 2B2 + 2E levels. The energies of these transitions are rather close to energy of quartet 4B1 state, although they are situated between the bands correlated with quartet–quartet 4A2 → 4B1(4F) and 4A2 → 4E(4P) transitions. In the spectrum of 1a, one band arises at 16930 cm−1, while for 2a analogous band is splitting into two components with positions at 16330 cm−1 and 17170 cm−1 (Table 2, Fig. 4 and S34, ESI†). The successive, well seen bands with maxima at 18850cm−1 (1a) and 18650 cm−1 (2a) are correlated with spin-allowed transition to 4E state being one of the two components of parental 4T1g((4P), Oh) level. The second component, 4A2(4T1g, 4P) state, is expected higher. The energies of 4A2 → 4E and 4A2 → 4A2(4P) transitions correspond to 18850 cm−1/21650 cm−1 for 1a and 18650 cm−1/21490 cm−1 for 2a (Table 2, Fig. S34, ESI†). Indeed, a detailed filtration analysis of 19000–21000 cm−1 region has revealed the presence of extra bands between these pairs of bands, which can be correlated with the combined spin- and symmetry forbidden transitions. The 2T1g(2P) state involves the 2A2 and 2E levels, while the 2A1g state from the 2G term is nondegenerate and keeps its symbol (2A1). We tentatively assigned the energy of 4A2 → 2A2(2T1g, 2P) transition as 20310 cm−1 for 1a and 20350 cm−1 for 2a. Neither corresponding band has been found in the spectra for the 4A2 → 2A1(2A1g, 2G) or 4A2 → 2E(2T1g, 2P) transitions (Fig. S34, ESI†).
| Cobalt(II) complexes (d7 configuration) | Nickel(II) complex (d8 configuration) | |||||||||||
|---|---|---|---|---|---|---|---|---|---|---|---|---|
| Assignment | 1a | 2a | Assignment | 1b | ||||||||
| O h | D 4 | Spect. | Filter | Calcd | Spect. | Filter | Calcd | O h | D 4 | Spect. | Filter | Calcd. |
| a Spect. – the energy found form the experimental spectra; filter – the energy found from the filtering process (filter parameters: (1a) step = 20 cm−1, α = 400 and N = 40; (2a) step = 20 cm−1, α = 400 and N = 30; (1b) step = 20 cm−1, α = 300 and N = 30); calcd – calculated energy; − not observed; the spin-allowed transitions are marked in bold. | ||||||||||||
| 4T1g(4F) | 4A2 | 0 | — | 0 | 0 | — | 0 | 3 A 2g ( 3 F) | 3 B 1 | — | — | 0 |
| 4E | — | 2001 | — | — | 1966 | |||||||
| 4 T 2g ( 4 F) | 4 E | 6830 | 6830 | 6734 | 6950 | 6950 | 6629 | 3 T 2g ( 3 F) | 3 B 2 | 7000 | 6990 | 6590 |
| 4B 2 | 8250 | 8250 | 8226 | 8050 | 8050 | 8190 | 3 E(1) | 8500 | 8370 | 8310 | ||
| 2Eg(2G) | 2A1 | — | 10210 |
11309 |
— | 10330 |
11275 |
|||||
| Ligand | 11300 |
11350 |
— | 11300 |
11330 |
— | Ligand | 11230 |
11430 |
— | ||
| 2B1 | — | 12510 |
12444 |
— | 12430 |
12266 |
3 T 1g ( 3 F) | 3 A 2 | 13040 |
12![[thin space (1/6-em)]](https://www.rsc.org/images/entities/b_char_2009.gif) 890 890
|
12860
|
|
| 4 A 2g ( 4 F) | 4 B 1 |
14200
|
14010
|
14059
|
14020
|
13890
|
13908
|
3 E(2) | 13040 |
12890
|
12955
|
|
| 2T1g(2G) | 2A2 | — | — | 15539 |
— | 15419 |
||||||
| 2T2g(2G) | 2B2 | 16950 |
16930 |
16852 |
16780 |
16330 |
16623 |
1Eg (1D) | 1A1 | 14660 |
14770 |
14470 |
| 2T2g(2G) | 2E | — | — | 17440 |
— | 17170 |
17326 |
1B1 | 14660 |
14770 |
14570 |
|
| 2T1g(2G) | 2E | — | — | 17924 |
— | 17743 |
1A1g(1G) | 1 | 20600 |
20490 |
20860 |
|
| 4 T 1g ( 4 P) | 4 E |
19150
|
18850
|
18685
|
18880
|
18650
|
18620
|
1T2g(1D) | 1B2 | — | — | 22250 |
| 2T1g(2P) | 2A2 | 20510 |
20310 |
20461 |
20410 |
20350 |
20310 |
1E | 23100 |
23190 |
23250 |
|
| 2A1g(2G) | 2A1 | — | — | 21280 |
21048 |
|||||||
| 4 T 1g ( 4 P) | 4 A 2 |
21310
|
21650
|
21741
|
21340
|
21490
|
21520
|
3 T 1g ( 3 P) | 3 A 2 |
24200
|
24290
|
24230
|
| 2T1g(2P) | 2E2 | — | — | 21760 |
— | — | 21616 |
3 E(3) |
24200
|
24290
|
24320
|
|
| 2T2g(2G) | 2E | — | — | 24189 |
— | — | 24562 |
|||||
| 2T1g(2G) | 2E | 24500 |
24830 |
24811 |
24750 |
24810 |
24710 |
1T1g(1G) | 1A2 | — | 25170 |
25215 |
| 2T2g(2G) | 2B2 | — | — | 24902 |
— | — | 26035 |
1E | — | — | 27310 |
|
| 2T1g(2G) | 2A2 | 26220 |
26270 |
26226 |
— | 26370 |
26331 |
|||||
Further, in the region between 22000 cm−1 and the charge transfer absorption edge, a weak spectral feature at 30000 cm−1 is present (Fig. 4) that can only be attributed to the spin-forbidden transitions. An assignment of feature attributed to the components of remaining spin-forbidden 4A2 → 2E + 2B2(2T2g,2G, Oh) and 4A2 → 2E + 2A2(2T1g, 2G, Oh) transitions is ambiguous. Finally, weak bands observed at 24830 cm−1/26270 cm−1 in the spectrum of 1a and at 24810 cm−1/26370 cm−1 in the spectrum of 2a are caused by spin-forbidden transitions from the ground state to higher doublet 2T1g(2G, Oh) state.
The diffuse-reflectance spectrum of 1b shows three main regions of absorption: 5800–10000 cm−1, 10500–17000 cm−1 and 18800–28700 cm−1, which are characteristic for the three spin-allowed: I-st (3A2g → 3T2g(3F, Oh)), II-nd (3A2g → 3T1g(3F, Oh)) and III-rd (3A2g → 3T1g(3P, Oh)) d–d transitions for nickel(II) ion of d8 configuration in a pseudooctahedral crystal field (Fig. 5). These broad bands are slightly asymmetric and exhibit pairs of maxima at ca. 7000 cm−1 and 8500 cm−1 (I-st d–d), 11230 cm−1 and 13040 cm−1 (II-nd d–d) as well as 20600 cm−1 and 24200 cm−1 (III-rd d–d). Moreover, the spectrum presents sharp feature at 14660 cm−1 as well as a shoulder on the low energetic branch of III-r d d–d at ca. 20600 cm−1.
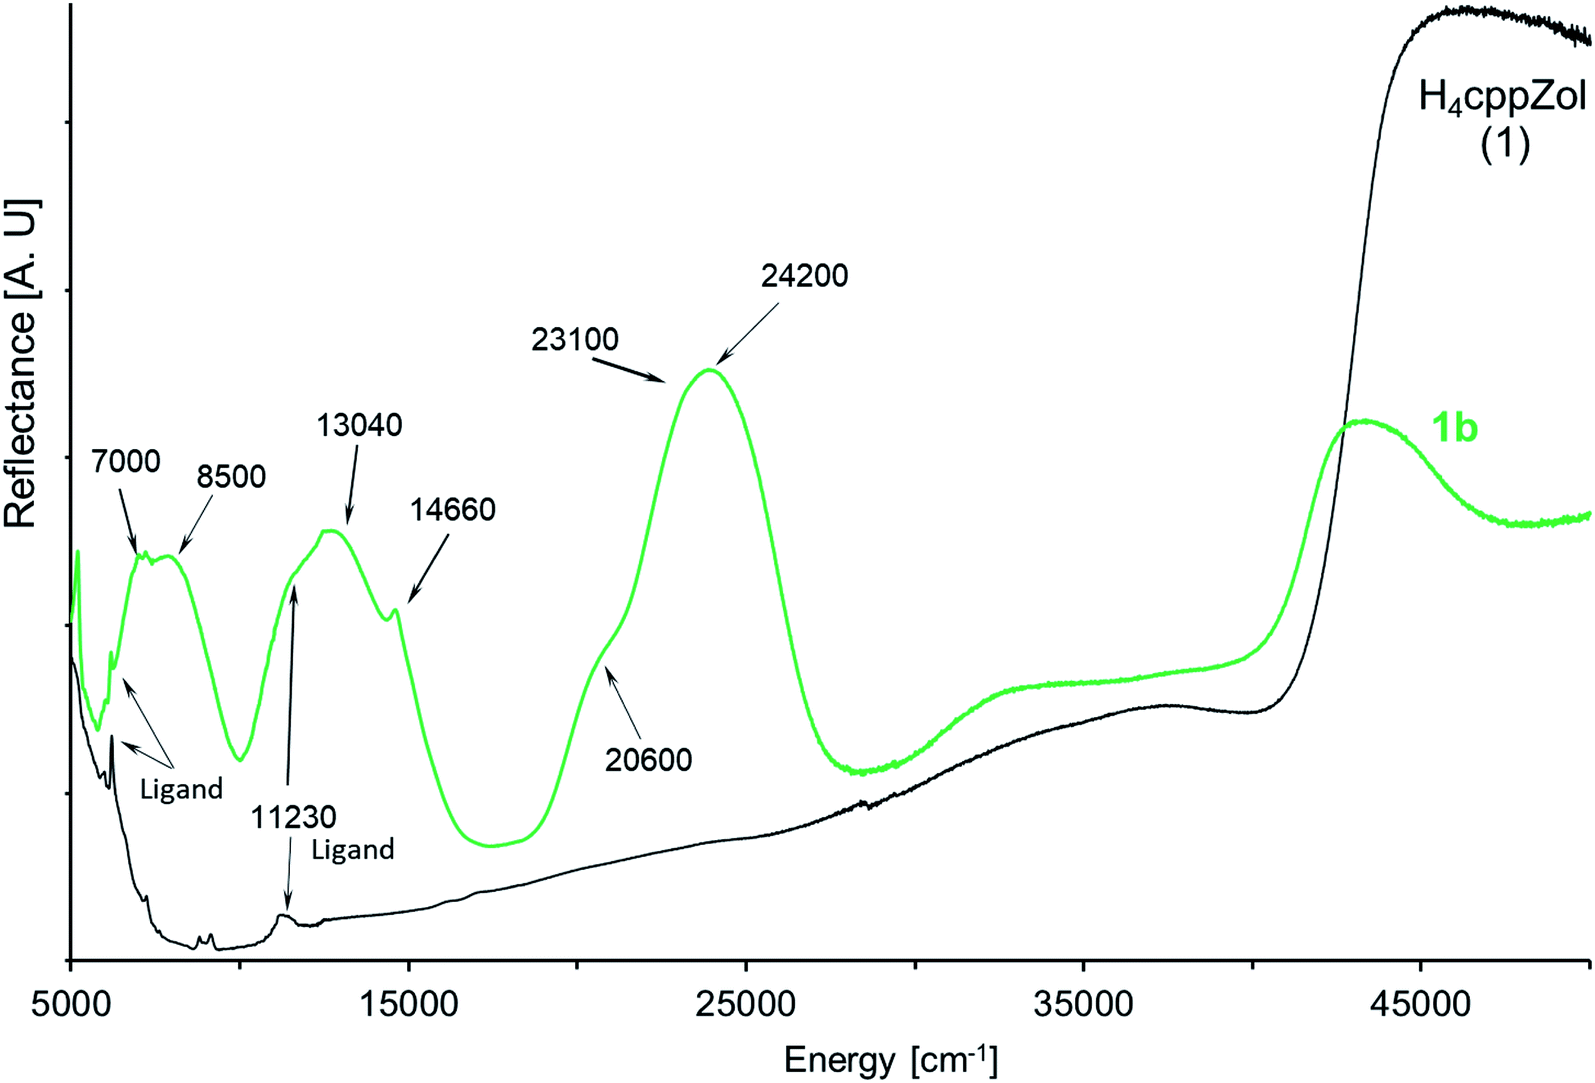 | ||
| Fig. 5 The NIR-Vis-UV diffuse-reflectance electronic spectra of 1b and related H4cppZol ligand (Scheme 1) obtained at room temperature. | ||
Generally, the bands corresponding to d–d transitions are red-shifted with respect to related bands in the spectrum of recently reported [Ni3(HdmtZol)2(H2O)6]·6H2O.14 This indicates that energies of d–d transitions are lower. Indeed, smaller tetragonal compression around Ni(II) (T = 1.02) leads to noticeably lower asymmetry of d–d bands compared with those recorded for Ni(II) complex based on HdmtZol3− ligand (T = 1.04).
The filtering process has revealed splitting of I-st and III-rd d–d bands into two components (Fig. S35, ESI†), which justifies an analysis based on the model assuming slightly compressed tetragonal D4 symmetry with 3B1 state as a ground term.33,39 The tetragonal crystal filed causes splitting of each spin allowed d–d band as follows: 3T2g(3F, Oh) state splits into 3B2 and 3E(1), 3T1g(3F, Oh) splits into 3E(2) + 3A2 states and third state 3T1g(3P, Oh) consists of 3E(3) and 3A2 levels. According to the energy level diagram,33,39 the spin and symmetry–forbidden transitions also become possible by splitting of the 1Eg and 1T2g states (both from 1D term, Oh) into 1B1 + 1A1 and 1B2 + 1E levels, respectively. The 1A1g state from 1G term is nondegenerate and stays the same (1A1), while successive 1T1g state from the 1G term consists of 1E and 1A2 levels.
The 3B1 → 3B2 and 3B1 → 3E(1) transitions with energies found under filtration process to be ca. 6990 cm−1 and 8370 cm−1 are assigned as components of the I-st d–d band. These experimental energies stay in good agreement with the calculated ones (Table 2). The calculated energies obtained for 3B1 → 3A2 and 3B1 → 3E(2) transitions (II-nd d–d) equal 12860 and 12955 cm−1. However, due to a very small difference in energy values of ca. ∼100 cm−1, even the filter does not revel splitting but only a shoulder effect. The sharp feature at 14770 cm−1 arises from 1Eg in Oh and is composed of 1A1 + 1B1 in D4. The splitting of this band corresponding to spin-forbidden transition is very difficult to observe in diffuse-reflectance spectrum, however, is confirmed by calculations giving the values of energies of 14470 cm−1 and 14570 cm−1 for 1A1 and 1B1 states, respectively. The experimental energy of subsequent spin-forbidden transition, 3B1 → 1A1(1A1g, 1G) at 20490 cm−1, corresponds well with calculated value of 20860 cm−1. The 3B1 → 1B2 + 1E transitions, being the components of 1T2g(1D, Oh) state, are usually situated between the II-nd and III-rd d–d bands. A single band is found in filtering process at 23190 cm−1 with low energetic shoulder at 22230 cm−1, while calculated energies of these states are 22250 cm−1 and 23250 cm−1. The III-rd d–d band observed with maximum at 24290 cm−1 seems to remain unsplitted. Its position is confirmed by close values of calculated energies of 24230 cm−1 and 24320 cm−1 obtained for 3B1 → 3A2 and 3B1 → 3E(3) transitions. Finally, the bands of higher energetic transitions of forbidden nature, namely, 3B1 → 1A2(1T1g(G), Oh) and 3B1 → 1E(1T1g(G), Oh) are expected over 25000 cm−1. Their energies were calculated as 25215 cm−1 and 27310 cm−1, however, they are not observed in the spectrum even as an effect of filtration (Fig. S35, ESI†).
The observed and calculated energy levels alongside with corresponding assignments are collected in Table 2. The agreement between the observed and calculated values is relatively satisfying. For cobalt(II) compounds (1a and 2a), the tetragonal crystal field parameters Dq, Dt and Ds as well as the Racah parameters B and C were calculated using the energies of quartet–quartet transitions. The following sets were obtained: Dq = 583 cm−1, Dt = −168 cm−1, Ds = 568 cm−1, B = 890 cm−1, C/B = 4.12 (1a) and Dq = 572 cm−1, Dt = −177 cm−1, Ds = 537 cm−1, B = 888 cm−1, C/B = 4.08 (2a). The Dt is dependent on the splitting of the first quartet state of the octahedral 4T2g(4F) and its negative sing calculated for both 1a and 2a is in agreement with the compressed geometry of {CoO6} polyhedrons in NaCo2(SeO3)(OH)37 and [Co3(HcptZol)2(H2O)4] coordination unit.13 For nickel(II) complex 1b, the values of Dq, Ds, Dt and Racah parameter B were calculated using the energies of six-triplet states. The following values were obtained: Dq = 659 cm−1 (exp. energy 699 cm−1 for 3B1 → 3B2 transition, Table 2), Ds = 307 cm−1, Dt = −196 cm−1 and B = 932 cm−1.
3.6 Magnetic properties of 1a, 1b and 2a
The magnetic susceptibilities of 1a, 2a, and 1b show Curie–Weiss behaviour above ca. 50 K with the Weiss constants θ = −12.4, −8.3, and −2.1 K, and magnetic moments of 5.32 (2.75), 5.23 (2.70), and 3.34 (2.30) μB, respectively. The expected values for g factors corresponding to the respective moments for free Co(II) (1a, 2a) or Ni(II) (1b) ions are given in brackets. Full results of magnetic measurements and calculations are presented in Fig. S36–S39 (ESI†). The magnetic behaviours of 1a and 2a are very similar, therefore Fig. 6 presents the temperature dependence of the effective magnetic moments (μeff) only for 1a and 1b. The magnetic susceptibilities of both compounds increase monotonically as the temperature is decreased up to 1.7 K. Upon cooling, the effective magnetic moment of Co(II) complex 1a slightly decreases from 300 to 100 K and then decreases faster, reaching a value of 4.1 μB at ∼2 K. An effective moment of the nickel complex 1b slowly decreases below room temperature, reaches a shallow minimum at 55 K, then passes through a pronounced maximum at 5 K and drops sharply below this temperature.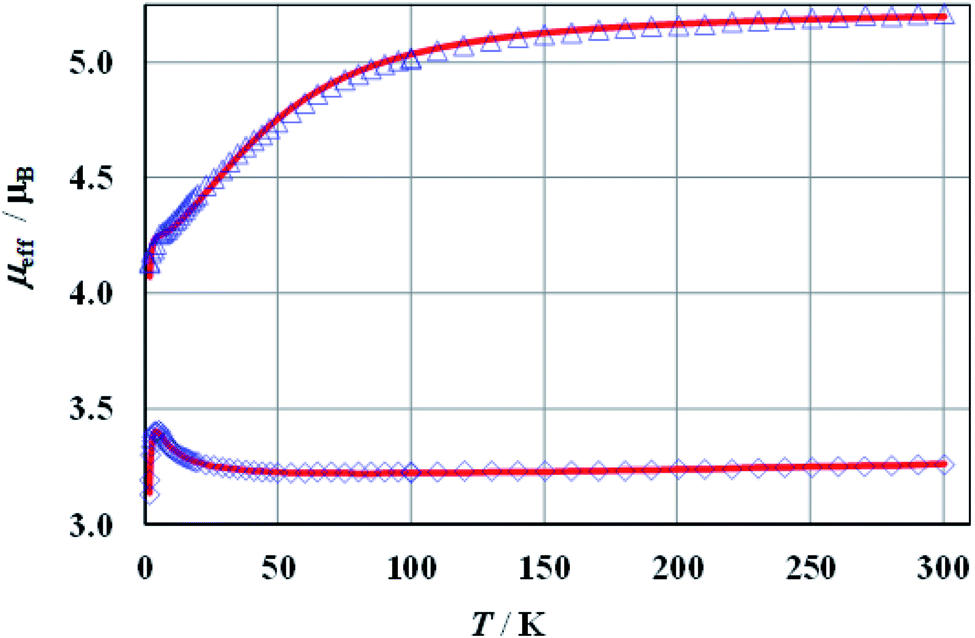 | ||
| Fig. 6 Effective magnetic moment of 1a at B = 100 mT (triangles) and 1b at B = 500 mT (diamonds). The solid lines represent the theoretical fits (see the text). | ||
The crystals structures of all the compounds comprise zig–zag chains, in which metal centres are alternately linked by double, symmetrical (–O1–P1–O2–)2 and (–O4–P2–O6–)2 bridges (Fig. S8†). Therefore, the magnetic susceptibility of 1a, 2a and 1b was analyzed in the framework of an alternating-exchange spin-chain.
Using the Hamiltonian:
| H = –J1∑S2iS2i+1 − J2∑S2i+1S2i+2 | (1) |
Cortés40 has derived the exact expression for magnetic susceptibility of J1J2 alternating chain with Heisenberg-type exchange between the classical spins:
| χalt = Nβ2g2S(S + 1)/3kBT·Falt | (2) |
| Falt = (1 + u1 + u2 + u1u2)/(1 − u1u2) | (3) |
If the antiferromagnetic coupling is weak or its character is ferromagnetic, the influence of zero-field splitting (zfs) must be taken into account in an analysis of the magnetic behaviour at low temperatures. The bulk susceptibility of 1a, 2a and 1b was calculated in the full temperature range by the combination of zfs and the alternating chain41–43 as:
| χ = χzfsFalt + TIP. | (4) |
According to Boca,44 the zfs contribution can be represented by χzfs = (χ‖ + 2χ⊥)/3 where:
| χ‖ = (Nβ2g‖2/4kBT)(1 + 9d2) / (1 + d2), | (5a) |
| χ⊥ = (Nβ2g⊥2/kBT) [1 + 3kBT/4D·(1 – d2)]/(1 + d2), | (5b) |
| χ‖ = (Nβ2g‖2/kBT)2d/(1 + 2d), | (6a) |
| χ⊥ = (Nβ2g⊥2/kBT)2kBT/D·(1 – d)/(1 + 2d) | (6b) |
The best agreement between theory and experiment was obtained for J1 = −0.72, −1.07, −2.47 cm−1, J2 = 0.33, 0.42, 0.67 cm−1, D = 58.2, 51.4, −1.86 cm−1, g = 2.69, 2.67, 2.25, and R (defined as Σ[(χT)exp – (χT)calc]2/Σ[(χT)exp]2) equal to 6.2 × 10⁻⁵, 5.6 × 10⁻⁵, 7.8 × 10⁻⁶, for 1a, 2a and 1b, respectively. During the calculations, the temperature independent paramagnetism (TIP) was fixed at 60 × 10−6 emu per Co. Good fit of calculated and experimental values of magnetic susceptibility of 1b at temperatures above 100 K could be achieved with a TIP value of 201 × 10−6 emu per Ni. The susceptibility curves resulting from the above parameters (depicted as μeff(T) and χ−1(T)) are shown in Fig. 6 and S36–S38 (ESI†). Since it is not possible to calculate field dependent magnetization within the above model, we have tried to ignore weak exchange interactions, treating the system as a set of isolated Co(II) ions and leaving the rest of the parameters unchanged. The M(B) dependences calculated for various external fields are drawn in Fig. S39 (ESI†) as a solid line and fit the experimental data pretty well.
The magnetic susceptibility of cobalt compounds calculated in the zero magnetic field using formulas 2–5 does not depend on the sign of the D parameter. In strong magnetic fields (above ∼0.5 T) a significant difference between the magnetization calculated for D and −D is observed (Fig. S39, ESI†) with a clear indication of positive values. This corresponds to the compressed tetragonal bipyramid around the cobalt centres (Fig. 1) and is consistent with the results of the analysis of the electronic spectra of 1a and 2a. It is also possible to fit the temperature dependence of magnetic susceptibility using both positive and negative values of parameter D for the nickel compound (1b). However, in this case the set of selected parameters with negative D (which again corresponds to the compressed bipyramid) better describes the behaviour of magnetization as a function of the magnetic field (Fig S39, ESI†).
Although coordination compounds containing various metal centres connected by –O–P–O– bridges are quite common and the magnetic properties of many of them have been investigated,15b,17b,18,20,22,45–49 a question still arises about the nature of magnetic exchange couplings through –O–P–O– bridges. Correlations of exchange integrals with M–O–P–O dihedral angles (related to deviation of the phosphonate group from the mean M–O⋯O–M plane)45,46 or with the angle between the O–P–O plane and the M–O axis,47 supported by the DFT calculations,46,48a suggest that the most important structural parameter controlling the exchange coupling is the M–O⋯O–M dihedral angle over the O–P–O bridge. The antiferromagnetic coupling decreases with the increase of the M–O⋯O–M angle and the coupling can become ferromagnetic in the case of larger angles.46,48,49 The J values calculated for 1a, 2a and 2b can readily be rationalized in terms of magnetostructural correlations outlined above. For both 1a and 2a, the boundary between ferro- and antiferromagnetic couplings estimated by this method for Co–O⋯O–Co angle is ca. 80°, and as seen in Fig. S40 and Table S7 (ESI†), the same observation seems to be applicable for 1D Co3(HL)2(H2O)6·6H2O polymers featuring chains of linear symmetric Co2 Co1 Co2 trimers (HL = HdmtZol3−, HcppZol3−, HcbtZol3−, Scheme 1).12,13 Moreover, the same value can also be used to explain magnetic behaviour of 1b and recently reported Ni3(HdmtZol)2(H2O)6·6H2O complex.14
4. Conclusions
Three Co(II) and Ni(II) 1D coordination polymers based on zoledronic acid analogues with a cyclopropane (cpp) or cyclobutane (cbt) ring on the Cα carbon, namely [Co(H2cppZol)(H2O)]·H2O (1a), [Ni(H2cppZol)(H2O)]·H2O (1b) and [Co(H2cbtZol)(H2O)]·H2O (2a), were synthesized under hydrothermal conditions and characterized by means of single-crystal X-ray diffraction, spectroscopic and thermal techniques. The studied compounds exhibit 1D double zig–zag chains architecture with the 8 + 8 rings motif formed by alternately arranged symmetrical (−O–P–O–)2 bridges linking equivalent octahedral Co(II)/Ni(II) centres.All the compounds exhibit similar decomposition pathways upon heating with thermal stabilities decreasing in the order 1b > 1a > 2a. The IR spectra revealed that lattice water release does not change chains architecture leaving them intact up to ca. 320, 280 and 240 °C, respectively. A good correlation between calculated energies of d–d transitions and experimental NIR-UV/VIS spectra was obtained with the assumption that metal centres of 1a, 1b and 2a adopt pseudo-octahedral compressed geometry.
Variable temperature magnetic susceptibility measurements analyzed in the framework of an alternating-exchange spin-chain revealed the occurrence of weak alternating antiferromagnetic–ferromagnetic exchange interactions propagated between the magnetic centres along double (–O–P–O–)2 bridges with J1 = −0.72, −1.07, −2.47 cm−1 and J2 = 0.33, 0.42, 0.67 cm−1 for 1a, 1b and 2a respectively. The boundary between antiferro- and ferromagnetic couplings for Co–O⋯O–Co angle was established to be ca. 80°. This value can also be used to explain magnetic behaviour of 1b and is applicable for recently reported M3(HL)2(H2O)6·6H2O (M = Co, Ni) complexes based on α,α-disubstituted analogues of zoledronic acid.
Conflicts of interest
There are no conflicts to declare.Acknowledgements
Financial support by a statutory activity subsidy from the Polish Ministry of Science and Higher Education for the Department of Chemistry of Wroclaw University of Science and Technology is gratefully acknowledged.References
- J. Goura and V. Chandrasekhar, Chem. Rev., 2015, 115, 6854 CrossRef CAS.
- (a) P. Bhanja and A. Bhaumik, ChemCatChem, 2016, 8, 1607 CrossRef CAS; (b) C.-Y. Gao, J. Ai, H.-R. Tian, D. Wu and Z.-M. Sun, Chem. Commun., 2017, 53, 1293 RSC; (c) Y.-P. Zhu, T.-Z. Ren and Z.-Y. Yuan, Catal. Sci. Technol., 2015, 5, 4258 RSC.
- K. J. Gagnon, H. P. Perry and A. Clearfield, Chem. Rev., 2012, 112, 1034 CrossRef CAS PubMed.
- (a) S. M. Lane, J. Monot, M. Petit, B. Bujoli and D. R. Talham, Colloids Surf., B, 2007, 58, 34 CrossRef CAS; (b) B. Bujoli, P. Janvier and M. Petit, in Metal Phosphonate Chemistry: From Synthesis to Applications, ed. A. Clearfield and K. Demadis, Royal Society of Chemistry, Cambridge, 2012, vol. 13, p. 420 Search PubMed.
- G. B. Hix, in Metal Phosphonate Chemistry: From Synthesis to Applications, ed. A. Clearfield and K. Demadis, Royal Society of Chemistry, Cambridge, 2012, vol. 16p. 525 Search PubMed.
- (a) H. Xu, H. Zhou, L. Feng, Q. Wang, R. Chen, W. Huang and X. Wu, Dalton Trans., 2018, 47, 11226 RSC; (b) M. S. M. Abdelbaky, Z. Amghouz, D. Martínez Blanco, S. García-Granda and J. R. García, J. Solid State Chem., 2017, 248, 61 CrossRef CAS; (c) S.-S. Bao and L.-M. Zheng, Coord. Chem. Rev., 2016, 319, 63 CrossRef CAS.
- E. Matczak-Jon and V. Videnova-Adrabińska, Coord. Chem. Rev., 2005, 249, 2458 CrossRef CAS.
- (a) D.-K. Cao, X.-J. Xie, Y.-Z. Li and L.-M. Zheng, Dalton Trans., 2008, 0, 5008 RSC; (b) X.-L. Zhang, K. Cheng, F. Wang and J. Zhang, Dalton Trans., 2014, 43, 285 RSC.
- (a) F. H. Ebetino, A.-M. L. Hogan, S. Sun, M. K. Tsoumpra, X. Duan, J. T. Triffitt, A. A. Kwaasi, J. E. Dunford, B. L. Barnett, U. Oppermann, M. W. Lundy, A. Boyde, B. A. Kashemirov, C. E. McKenna and R. G. G. Russell, Bone, 2011, 49, 20 CrossRef CAS; (b) R. G. G. Russell, Bone, 2011, 49, 2 CrossRef CAS; (c) M. Mc Clung, S. T. Harris, P. D. Miller, D. C. Bauer, K. S. Davison, L. Dian, D. A. Hanley, D. L. Kendler, C. K. Yuen and E. M. Lewiecki, Am. J. Med., 2013, 126, 13 CrossRef CAS; (d) S. E. Papapoulos, Nat. Rev. Rheumatol., 2013, 9, 263 CrossRef CAS; (e) L. Michou and J. P. Brown, Drug Des., Dev. Ther., 2011, 5, 225 CAS; (f) H. Fleisch, Bisphosphonates in bone disease: from the laboratory to the patient, Academic Press, San Diego, 2000 Search PubMed; (g) J. E. Brown and R. E Coleman, Breast Cancer Res., 2002, 4, 24 CrossRef CAS; (h) S. Ahmad, G. Kuraganti and D. Steenkamp, Am. J. Med., 2015, 128, 239 CrossRef CAS.
- (a) Q.-J. Niu, Y.-Q. Zheng, H.-L. Zhu and W. Xu, Transition Met. Chem., 2014, 41, 365 CrossRef; (b) E. Freire, M. Quintero, D. Vega and R. Baggio, Inorg. Chim. Acta, 2013, 394, 229 CrossRef CAS; (c) Q.-J. Niu, Y.-Q. Zheng, L.-X. Zhou and H.-L. Zhu, J. Solid State Chem., 2015, 227, 212 CrossRef CAS.
- (a) W. Goldeman and T. Rojek, PL Pat. application, 408 018 A1, 2014; (b) W. Goldeman and T. Rojek, PL Pat. application, 408 029 A1, 2014.
- T. Rojek, W. Goldeman, K. Ślepokura, M. Duczmal, A. Wojciechowska and E. Matczak-Jon, Dalton Trans., 2017, 46, 6900 RSC.
- T. Rojek, W. Goldeman, K. Ślepokura, M. Duczmal, A. Wojciechowska and E. Matczak-Jon, New J. Chem., 2018, 42, 7830 RSC.
- T. Rojek, W. Goldeman, K. Ślepokura, M. Duczmal, A. Wojciechowska and E. Matczak-Jon, Polyhedron, 2018, 141, 44 CrossRef CAS.
- (a) D. K. Cao, Y. Z. Li and L. M. Zheng, Inorg. Chem., 2007, 46, 7571 CrossRef CAS; (b) D. K. Cao, M. J. Liu, J. Huang, S. S. Bao and L. M. Zheng, Inorg. Chem., 2011, 50, 2278 CrossRef CAS PubMed.
- C. R. Groom, I. J. Bruno, M. P. Lightfoot and S. C. Ward, Acta Crystallogr., Sect. B: Struct. Sci., Cryst. Eng. Mater., 2016, 72, 171 CrossRef CAS.
- (a) W.-Y. Yin, W.-S. Cai, Y.-S. Ma, X.-Y. Tang and R.-X. Yuan, J. Mol. Eng. Mater., 2014, 2, 1440003 CrossRef; (b) Y.-S. Ma, W.-Y. Yin, W.-S. Cai, P.-Z. Zhu, X.-Y. Tang, R.-X. Yuan and S. Roy, RSC Adv., 2013, 3, 18430 RSC.
- (a) Y. Ma, R. Yuan and L. Zheng, Inorg. Chem. Commun., 2009, 12, 860 CrossRef CAS; (b) K.-R. Ma, L. Cao, M.-H. Cong, Y.-H. Kan and R.-Q. Li, J. Mol. Struct., 2017, 1139, 67 CrossRef CAS.
- (a) Y. Gong, W. Tang, W. Hou, Z. Zha and C. Hu, Inorg. Chem., 2006, 45, 4987 CrossRef CAS PubMed; (b) G. Li, Y. Fan, T. Zhang, T. Ge and H. Hou, J. Coord. Chem., 2008, 61, 540 CrossRef CAS.
- Z.-C. Zhang, S.-S. Bao and L.-M. Zheng, Inorg. Chem. Commun., 2007, 10, 1063 CrossRef CAS.
- D.-K. Cao, M.-J. Liu, J. Huang, S.-S. Bao and L.-M. Zheng, Inorg. Chem., 2011, 50, 2278 CrossRef CAS.
- (a) K.-R. Ma, Y. Zhang, Y.-H. Kan, X.-J. Yang and M.-H. Cong, Synth. Met., 2013, 182, 40 CrossRef CAS; (b) Z.-C. Zhang, S. Gao and L.-M. Zheng, Dalton Trans., 2007, 0, 4681 RSC; (c) J. Zhao, J. Wu, J. Hu, H. Hou and Y. Fan, Inorg. Chim. Acta, 2010, 363, 662 CrossRef CAS.
- D. Liu, S. A. Kramer, R. C. Huxford-Phillips, S. Wang, J. Della Rocca and W. Lin, Chem. Commun., 2012, 48, 2668 RSC.
- E. Alvarez, A. G. Marquez, T. Devic, N. Steunou, C. Serre, C. Bonhomme, C. Gervais, I. Izquierdo-Barba, M. Vallet-Regi, D. Laurencin, F. Maurif and P. Horcajada, CrystEngComm, 2013, 15, 9899 RSC.
- (a) CrysAlisPro, Agilent Technologies, Yarnton, U. K., 2012; (b) CrysAlisPro, Rigaku Oxford Diffraction, Yarnton, U. K., 2015, 2018.
- G. M. Sheldrick, Acta Crystallogr., Sect. A: Found. Crystallogr., 2008, 64, 112 CrossRef CAS.
- G. M. Sheldrick, Acta Crystallogr., Sect. C: Struct. Chem., 2015, 71, 3 Search PubMed.
- K. Brandenburg and K. Putz, DIAMOND, Ver. 3.2, Crystal and Molecular Structure Visualization, University of Bonn, Germany, 2006 Search PubMed.
- (a) J. Myrczek, Spectrosc. Lett., 1990, 23, 1027 CrossRef CAS; (b) A. Wojciechowska, Z. Staszak, W. Bronowska, A. Pietraszko and M. Cieślak-Golonka, Polyhedron, 2001, 20, 2063 CrossRef CAS; (c) A. Wojciechowska, A. Gągor, M. Duczmal, Z. Staszak and A. Ożarowski, Inorg. Chem., 2013, 52, 4360 CrossRef CAS; (d) A. Wojciechowska, M. Daszkiewicz, Z. Staszak, A. Trusz-Zdybek, A. Bieńko and A. Ożarowski, Inorg. Chem., 2011, 50, 11532 CrossRef CAS.
- B. Murphy, M. Aljabri, A. M. Ahmed, G. Murphy, B. J. Hathaway, M. E. Light, T. Geilbrich and M. B. Hursthousec, Dalton Trans., 2006, 357 RSC.
- T. Rojek, W. Goldeman, K. Ślepokura, W. Zierkiewicz and E. Matczak-Jon, CrystEngComm, 2019, 21, 4340 RSC.
- X. Huang, Z. Liu, C. Huang and Y. Wang, Acta Crystallogr., Sect. E: Crystallogr. Commun., 2010, 66, m59 CrossRef CAS.
- A. B. P. Lever, Inorganic Electronic Spectroscopy, Elsevier, New York, 1984 Search PubMed.
- J. Titiš, J. Hudák, J. Kožišek, A. Krutošiková, J. Moncol, D. Tarabová and R. Boča, Inorg. Chim. Acta, 2012, 388, 106 CrossRef.
- (a) H. Souissi and S. Kammoun, Mater. Sci. Appl., 2011, 2, 1121 CAS; (b) J. Titiš and R. Boča, Inorg. Chem., 2011, 50, 11838 CrossRef; (c) P. Diaz-Gallifa, O. Fabelo, J. Pasán, L. Canadillas-Delgado, F. Lloret, M. Julve and C. Ruiz-Pérez, Inorg. Chem., 2014, 53, 6299 CrossRef CAS; (d) M. Gerloch and M. R. Manning, Inorg. Chem., 1981, 20, 1051 CrossRef CAS.
- J. L. Pascual, Phys. Rev. B: Condens. Matter Mater. Phys., 2003, 67, 115112 CrossRef.
- M. Wildner, J. Solid State Chem., 1995, 115, 360 CrossRef CAS.
- M. Wildner, Phys. Chem. Miner., 1996, 23, 489 CrossRef CAS.
- (a) L. Y. Martin, C. R. Sperati and D. H. Busch, J. Am. Chem. Soc., 1977, 99, 2968 CrossRef CAS; (b) J. C. Donini, B. R. Hollebone, G. London, A. B. P. Lever and J. C. Hempel, Inorg. Chem., 1975, 14, 455 CrossRef CAS; (c) J. R. Perumareddi, J. Phys. Chem., 1972, 76, 3401 CrossRef CAS.
- R. Cortés, M. Drillon, X. Solans, L. Lezama and T. Rojo, Inorg. Chem., 1997, 36, 677 CrossRef.
- C. G. Barraclough, A. K. Gregson and S. Mitra, J. Chem. Phys., 1974, 60, 962 CrossRef CAS.
- F. S. Delgado, N. Kerbellec, C. Ruiz-Pérez, J. Cano, F. Lloret and M. Julve, Inorg. Chem., 2006, 45, 1012 CrossRef CAS.
- F. Lloret, M. Julve, J. Cano, R. Ruiz-García and E. Pardo, Inorg. Chim. Acta, 2008, 361, 3432 CrossRef CAS.
- R. Boča, Struct. Bonding, 2006, 117, 1 CrossRef.
- B. K. Tripuramallu, S. Mukherjee and S. K. Das, Cryst. Growth Des., 2012, 12, 5579 CrossRef CAS.
- J. Huang, P.-Y. Liu, H. Zhu, S.-S. Bao, L.-M. Zheng and J. Ma, ChemPlusChem, 2012, 77, 1087 CrossRef CAS.
- N. Marino, O. F. Ikotun, M. Julve, F. Lloret, J. Cano and R. P. Doyle, Inorg. Chem., 2011, 50, 378 CrossRef CAS.
- (a) T. T. Wang, M. Ren, S.-S. Bao, B. Liu, L. Pi, Z.-S. Cai, Z.-H. Zheng, Z.-L. Xu and L.-M. Zheng, Inorg. Chem., 2014, 53, 3117 CrossRef CAS; (b) T. T. Wang, M. Ren, S.-S. Bao, Z.-S. Cai, B. Liu, Z.-H. Zheng, Z.-L. Xu and L.-M. Zheng, Dalton Trans., 2015, 44, 4271 RSC.
- (a) H. C. Yao, Y. Z. Li, S. Gao, Y. Song, L. M. Zheng and X. Q. Xin, J. Solid State Chem., 2004, 177, 4557 CrossRef CAS; (b) B. Żurowska, A. Brzuszkiewicz and J. Ochocki, Polyhedron, 2008, 27, 1721 CrossRef.
Footnote |
| † Electronic supplementary information (ESI) available. CCDC 1940766–1940768. For ESI and crystallographic data in CIF or other electronic format see DOI: 10.1039/c9ra05673d |
| This journal is © The Royal Society of Chemistry 2019 |