
 Open Access Article
 This Open Access Article is licensed under a Creative Commons Attribution-Non Commercial 3.0 Unported Licence
Qualitative and quantitative differences between common control banding tools for nanomaterials in workplaces
Xiangjing Gaoa,
Hua Zoua,
Zanrong Zhoua,
Weiming Yuana,
Changjian Quana,
Meibian Zhang *a and
Shichuan Tang*b
*a and
Shichuan Tang*b
aZhejiang Provincial Center for Disease Control and Prevention, Hangzhou 310051, Zhejiang, China. E-mail: mbzhang@cdc.zj.cn; Tel: +86-571-87115227
bBeijing Municipal Institute of Labour Protection, Beijing 100054, China. E-mail: tsc3496@sina.com
First published on 25th October 2019
Abstract
A number of control banding (CB) tools have been developed specifically for managing the risk of exposure to engineered nanomaterials. However, data on the methodological differences between common CB tools for nanomaterials in workplaces are rare. A comparative study with different CB tools, such as Nanosafer, Stoffenmanager-Nano, Nanotool, Precautionary Matrix, ECguidance, IVAM Guidance, ISO, and ANSES, was performed to investigate their qualitative and quantitative differences in real exposure scenarios. These tools were developed for different purposes, with different application domains, methodological principles, and criteria. Multi-criteria analysis showed that there was a diverse distribution of these eight CB tools across different evaluation indicators. The total evaluation scores for Nanotool, Stoffenmanager-Nano, and Nanosafer were higher than the other tools. Quantitative comparisons demonstrated that ANSES, ECguidance, and IVAM Guidance tools were better in terms of information availability. Nanotool, Stoffenmanager-Nano, and ECguidance were better in terms of the sensitivity of outputs to changes in exposure parameters. The Nanotool, ANSES, and ECguidance tools were better in terms of accuracy of hazard outcomes evaluated with toxicological data. The Stoffenmanager-Nano, Nanotool, and Nanosafer tools' exposure scores for seven scenarios had a good correlation with measurement data. The Nanotool and Stoffenmanager-Nano tools had much higher comprehensive advantages based on quantitative and qualitative assessment. More comparative studies evaluating different tools are required, using more types of nanomaterials in real exposure scenarios.
1. Introduction
Nanoparticles are increasingly being produced and handled in workplaces.1 Therefore, a large population of workers experience potentially high health risks, and exposure to nanoparticles is an emerging concern in the field of occupational health. Currently, the pace of health risk assessment does not match the pace of development of new nanomaterials, owing to a scarcity of toxicology and exposure data, and the uncertainty surrounding the hazardous risks they pose.2A number of control banding (CB) tools have been developed as pragmatic tools for managing the risks from exposure to a wide variety of potentially hazardous substances in the absence of firm toxicological and/or detailed exposure information.3 These tools offer simplified guidance based on the combination of a substance's hazard and its potential exposure to minimize occupational risks. In principle, CB tools generally use limited physicochemical and task/scenario information to place the substance of interest into a hazard and exposure band and to classify the substance into risk categories with recommended control measures.4,5
Control banding tools lay a foundation for the risk assessment of novel substances in workplaces, such as nanomaterials. Many CB tools, such as Nanosafer, Stoffenmanager-Nano, Nanotool, Precautionary Matrix, ECguidance, IVAM Guidance, ISO, and ANSES, have been developed specifically to manage the potential risk from occupational exposure to nanomaterials.6 Typically, these CB strategies, which are constituted of hazard and exposure bands,7 were used to derive the risk band or associated engineering control band for a given occupational scenario for nanomaterials. The CB tools have been promoted by governments or international organizations. For example, the Stoffenmanager-Nano has been recommended for evaluating the safety of purposely produced insoluble particles. Nanotool has been used to assess the health risks of metal nanoparticles such as copper, nickel, and silver, as well as carbon nanotubes.3
The different CB tools for nanomaterials have some similarities and differences in their methodologies. Thus far, little guidance has been reported for choosing the most suitable CB tool for a given application because different tools might give very different results. It is therefore strongly desirable to strengthen the theoretical framework for assessing and minimizing the potential risks from occupational exposure to nanomaterials, which is dependent, to some extent, on an understanding of the similarities and differences in the methodologies between the different CB tools for nanomaterials. At present, there are few comparative studies on the quantitative and qualitative differences between the different banding methodologies for nanomaterials. Sánchez et al.4 and Brouwer6 compared CB tools in terms of scope, parameters, and classification. The authors found that different approaches to estimate hazard and exposure bands can result in different outcomes and preventive recommendations, and the outputs should be interpreted carefully. Dunn et al.7 provided a detailed overview of the eight CB tools and the review was further updated by Liguori et al.8 However, the hypotheses from these studies lacked the support of real exposure scenarios. Therefore, it is necessary to carry out comparative studies between different CB tools under real nanomaterial exposure scenarios to understand their methodological differences, as well as to improve the theoretical framework for occupational health risk assessment of nanomaterials in workplaces.
The aim of this study was to assess the above mentioned eight common CB tools and to investigate their qualitative and quantitative differences in real exposure scenarios involving nano-Fe2O3, nano-Al2O3, and nano-CaCO3. The following five CB tool aspects were investigated: (1) nano-relevance; (2) amount and availability of information required; (3) sensitivity of outputs to changes in hazard and exposure parameters; (4) accuracy of outcomes of hazards evaluated with toxicological data; and (5) accuracy of exposure classification evaluated with measurement data.
2. Materials and methods
2.1 Description of nanomaterial exposure scenarios
Three typical factories producing nano-Fe2O3, nano-Al2O3, and nano-CaCO3 were selected for field investigation. They are small-scale enterprises or enterprises in the trial production stage, and are located in eastern and central China. A total of seven exposure scenarios involving nanomaterials, e.g. packaging, screening and feeding for nano-Fe2O3, packaging and separation for nano-Al2O3, and packaging and drying for nano-CaCO3, were screened for performing the comparative study across different CB tools.The nano-Fe2O3 was produced by chemical synthesis and is used as a dye for automobile surface paints. During the production of nano-Fe2O3, there were three processes that can generate potential exposure to airborne nano-Fe2O3: (1) powder screening: a portion of the α-Fe2O3·nH2O product was manually spread onto a flat plate; (2) material feeding: the α-Fe2O3 material was manually fed into a semi-open container for washing; and (3) α-Fe2O3 or α-Fe2O3·nH2O packaging. A local exhaust ventilation (LEV) system was installed in the packaging area; only general ventilation was installed for the powder screening area; and the feeding process did not have any ventilation measures.
The nano-Al2O3 was produced using a gas-phase method in a pilot factory and is used as a catalyst and as a surface protector. Two processes that can generate nanomaterial aerosols were selected for the exposure scenarios, e.g. the separation of HCL gas and nano-Al2O3 particles via air-blowing in a separator, and automatic packaging. The packaging process was performed in a relatively closed environment. The separation process was performed in a workplace with general ventilation.
The nano-CaCO3, used for cable coating, was produced by chemical synthesis in a nano-CaCO3 manufacturing factory. The processes of drying of wet product and packaging were selected as the exposure scenarios. There were no control measures for the two processes.
2.2 Air monitoring for exposure to nanomaterials
The total particle number concentration (TNC), as a sensitive exposure indicator, was determined for airborne nanoparticles using a P-Trak ultrafine particle counter (Model 8525, TSI, USA). The counter is a portable condensation particle counter (CPC) calibrated by the manufacturer, and was set to zero prior to sampling. It counts particles enlarged in a saturated vapor environment using optical sensing.The size distribution by number for airborne nanoparticles was determined using a scanning mobility particle sizer (SMPS, Model 3034, TSI, USA). The SMPS contains a differential mobility analyzer (DMA) and a CPC that can determine the particle size distribution based on electrical-mobility diameters. The instrument was calibrated using the manufacturer's instructions.
The sampling/testing protocol was as follows:9,10 (1) background measurements: outdoor background particles from the atmosphere were characterized; and (2) activity-based measurements: the instruments' inlets were positioned close to the breathing zone of workers potentially exposed to nanomaterials at the sampling locations. The sampling period covered a complete duration of the activity. The TNCs were corrected using background concentrations to get the concentration ratios (CR) (sampling location vs. background), which reflect the degree of nanoparticles released from the particle generation source.
The risk ratio (RR),11 which is defined as the ratio between the risk level of a particular nanomaterial (obtained through the given CB tool) and the maximum risk level for that tool, was used for comparing assessment results obtained from different tools. For example, in Nanosafer the risk level of nano-Al2O3 at the separation sampling location is 4, while the maximum risk level for the tool is 5. Hence the RR of nano-Al2O3 using Nanosafer is 0.8 (4/5). RRs represent the relative risk levels and are therefore comparable across different tools. Similarly, the exposure band ratio is defined as the ratio between the exposure band and the maximum exposure level for the tool and the hazard band ratio is defined as the ratio between the hazard band and the maximum hazard level for the tool. Both of them were used for comparing the sensitivity of exposure classifications and the reliability of hazard classifications.
2.3 Methodology for CB tool modelling
(2) The Stoffenmanager-Nano (http://nano.stoffenmanager.nl/)15 was developed by a consortium led by the Organization for Applied Scientific Research based in the Netherlands.16,17 It follows a stepwise binary decision tree, which provides five hazard bands. The exposure band gets a score with four value ranges (<0.002; 0.002–0.2; 0.2–20; >20). The hazard and exposure banding system are combined in a two-dimensional decision matrix, ranked from I to III.
(3) The Nanotool (http://www.controlbanding.net/)18 was developed by Paik and Zalk et al. at the Lawrence Livermore National Laboratory, USA.19,20 It assigns the hazard and exposure bands using a points scoring system ranging from 0 to 10 for a single factor, and then combining them to get the risk band, which is equally divided into four bands.21,22
(4)The Precautionary Matrix (https://www.bag.admin.ch/bag/en/home/gesund-leben/umwelt-und-gesundheit/chemikalien/nanotechnologie/sicherer-umgang-mit-nanomaterialien/vorsorgeraster-nanomaterialien-webanwendung.html) was developed by the Swiss Federal Office of Public Health and the Federal Office for the Environment in 2008,23 and was revised in 2010.24,25 Unlike other tools, it combines hazard and exposure potential in a single score which is subdivided into two bands to determine the precautionary need. For the purposes of calculating the precautionary need, the input parameters are scored from 1 to 9 (e.g. low = 1, medium = 5, high = 9).26
(5) The ECguidance developed by the European Commission is meant to assist employers, health and safety practitioners, and workers in fulfilling their regulatory obligations.27 It follows a stepwise binary decision tree, which allocates 4 bands for the hazard and the exposure rankings, and 4 control level bands.
(6) The IVAM Guidance was developed to provide a guidance for working safely with engineered nano-materials and end-products (http://www.industox.nl/Guidanceonsafehandlingnanomats%26products.pdf).28 It follows a stepwise binary decision tree, which allocates 3 bands for the hazard ranking and the exposure ranking, and 3 control level bands. The control level bands are classified into three control levels A, B, C with A the lowest to C the highest, with corresponding advice for control measures for each control level.
(7) The ISO control banding (http://www.iso.org/iso/catalogue_detail.htm?csnumber=53375)29 is specifically designed for inhalation control, focusing on nano-objects such as nanoparticles, nanopowders, nanofibers, nanotubes, nanowires, as well as aggregates and agglomerates. The guidance is based on a stepwise binary decision tree driven by information. It applies 5 hazard bands, 4 exposure bands, and 5 control bands.
(8) The ANSES tool was developed by the French Agency for Food, Environmental and Occupational Health & Safety (https://www.anses.fr/en/content/anses-proposes-innovative-approach-prevention-occupational-risks-nanomaterials) for conducting risk assessment of work with manufactured nanomaterials in industrial settings.30,31 It applies 5 hazard bands, 4 exposure bands (emission potential), and 5 control bands for risk. The control levels are derived by combinations of the hazard and exposure bands in a two-dimensional decision matrix, ranking from lower CL1 to higher CL5 associated with general recommendations.
2.4 The comparative study across different CB tools
The comparative study across different CB tools consisted of two parts: a qualitative and a quantitative comparison. Analysis of the key information and multi-criteria analysis were performed for comparing the qualitative differences. Quantitative comparisons between the different CB tools were performed in terms of nano-relevance, availability of information required by tools, sensitivity of tool output to changes in hazard and exposure, and reliability of tool hazard bands and exposure bands.4 The associations between the different tools were tested using correlation analysis. Finally, the consistency of qualitative and quantitative comparisons was evaluated.A multi-criteria qualitative analysis was subsequently established based on this analysis of key information11,32 and included the following steps: determination of evaluation indicators, assignment of indicator values and weights, expert consultation, interview with key informants, and comprehensive analysis. The evaluation indicators were determined based on the literature review and expert consultation, in which 20 experts in the field of health management or occupational health were asked for advice on evaluating the indicators in two rounds. The nine selected indicators are shown in Table 1. Rather than using different quantification scores, most of the consulted experts (85%) considered it appropriate to divide each indicator into low, medium, and high levels, which were assigned 1, 2, and 3 points, respectively. The practicability, accuracy, sensitivity, reliability of exposure ranking, and operability indicators were only divided into 2 levels (high and low) because the medium level was difficult to define. To assign indicator weights, 85% of experts agreed that the weight of the six indicators should be equivalent, meaning that each indicator was equally important. The rationality of the framework for qualitative comparisons was further discussed by 10 additional core expert practitioners.
| Criteria (Indicators) | Scores (levels) | ||
|---|---|---|---|
| 1 (Low) | 2 (Medium) | 3 (High) | |
| Evaluated substance (the tool that evaluates more types of substances is more useful.) | Powders | Powders, liquids | Powders, liquids, and solid materials |
| Validation (the tool is validated by documents containing independent data and may be more accurate.) | No | The tool is validated by a few documents | The tool is validated by adequate documents with independent data |
| Accuracy of nano-relevance (the tool with high consistence between the nano-relevance assessment and the particle size.) | The results of nano-relevance is not accuracy | — | The results of nano-relevance is accuracy |
| Reliability of hazard ranking the tool based on experimental or epidemiological data is more reliable.) | The results of hazard ranking is not based on experimental or epidemiological data | The results of hazard ranking is partly based on experimental or epidemiological data | The results of hazard ranking is based on experimental or epidemiological data |
| Reliability of exposure ranking (the tool with better correlation between the exposure assessment or the exposure concentration is reliable.) | No correlation between the exposure assessment and the exposure concentration | — | The exposure assessment has a correlation with the exposure concentration |
| Sensitivity (the tool with high variability to input parameters is sensitive) | No sensitivity | — | The tool is sensitive to the variation of input parameters |
| Guidance (the tool provides explanatory guidance that helps implementation.) | No guidance available | Guidance manuals are available, but lack examples of applications | Guidance manuals are available and give many examples of applications |
| Practicability (the tool that provides a control strategy to reduce health risks is more practical) | No control strategy is available | — | Control strategy is available with classification |
| Operability (the tool is convenient to use.) | Complicated to use | — | Easy to use |
A radar diagram was drawn to directly reflect the level distribution of the eight tools for each evaluation indicator. Table 1 shows the scoring system used for the multi-criteria analysis. The total scores of each tool in the nine evaluation indicators (e.g. evaluated substance, validation, accuracy of nano-relevance, reliability of hazard ranking, reliability of exposure ranking, sensitivity, guidance, practicability, and operability) were calculated to determine whether there was a comprehensive advantage for each tool.
(a) Nano-relevance assessment. Among the eight CB tools, the Stoffenmanager-Nano, Nanosafer, Nanotool, and Precautionary matrix required nano-related information (such as the size, diameter, shape) to assess whether or not the material was nano-relevant. In addition, the ECguidance, IVAM Guidance, ISO, and ANSES tools also provided nano-relevant results based on user subjective judgments. In this study, the accuracy of nano-relevance results obtained from the CB tools was evaluated using the airborne nanoparticles' size distributions determined by SMPS.
(b) Availability of information required. The tools required different information to estimate hazard and exposure scores. The ratios of the number of available information and acquired information for hazard and exposure was used to evaluate the availability of information for each tool. Hazard information was obtained from the Safety Data Sheets (SDS) and open literature for each nanomaterial. Information on exposure was provided by the three nanomaterial manufacturing enterprises or obtained from the field investigation.
(c) Sensitivity of tool output to changes in hazard and exposure. The tools' sensitivity to changes in hazard characteristics and exposure determinants were evaluated by using nano-Fe2O3, nano-Al2O3, and nano-CaCO3 with different characteristics. Table 2 shows the hazard input data for the nano-Fe2O3, nano-Al2O3, and nano-CaCO3 required by the different tools. The hazards were generally determined from the physicochemical characteristics and toxicity of materials by the eight tools.
| CB Tools | Information requested | Materials | ||
|---|---|---|---|---|
| Fe2O3 | Al2O3 | CaCO3 | ||
| a The occupational exposure limits (respirable 8 h TWA recommended by the NIOSH) of Fe2O3, Al2O3, and CaCO3 are 5, 4, and 5, respectively; “—” represents “unable to fill due to lack of information”. | ||||
| Nanosafer | Is the material named with any of the following words: Nano, dot, cluster, ultrafine, et al.? | Yes | Yes | Yes |
| Is the material chemically surface-modified (coated / functionalized)? | No | No | No | |
| Is the shape of the primary particles known? | No | No | No | |
| Shortest dimension (nm) | 10.4 | 10 | — | |
| Shortest dimension (nm) | 24.33 | 26.58 | — | |
| Longest dimension (nm) | 67.3 | 32.78 | — | |
| What is the surface area of the powder material? M2 g−1 | Assumed 150 | Assumed 150 | Assumed 150 | |
| Is there any information on the size of the primary particles? | — | — | No | |
| Is the specific surface area known? | — | — | No | |
| What is the relative density (specific gravity) of the material? (g cm−3) | 5.24 | 3.97 | 2.8 | |
| What is the solubility of the material in water? | Insoluble (<1 g L−1) | Insoluble (<1 g L−1) | Soluble (>1 g L−1) | |
| What is the respirable dustiness index (choose dustiness level if you do not have test results) | 937.5 mg kg−1 | 937.5 mg kg−1 | 937.5 mg kg−1 | |
| Exposure limit for respirable dust (mg m−3)a | 5 | 4 | 5 | |
| Carcinogenic effect | No | May cause cancer | No | |
| Acute toxicity | Yes | Yes | No | |
| Severity of acute effects | STOT SE2 | STOT SE2 | STOT SE3 | |
| Sensitization | No | Skin Sens.1 | No | |
| Mutagenicity/genotoxicity | No | Muta.2 | No | |
| Irritant/corrosiveness | Eye irrit.2; eye dam. 1 skin irrit. 2 | Eye irrit.2; skin irrit. 2 | Eye irrit.2; eye dam. 1 skin irrit. 2 | |
| Carcinogenicity | No | Carc. 2 | No | |
| Developmental/reproductive toxicity | No | Repr.2 | No | |
| Likelihood of chronic effect | STOT RE 2 | STOT RE 2 | STOT RE 1 | |
| Stoffenmanager nano | Product appearance | Powder | Powder | Powder |
| Dustiness | Very high | Very high | High | |
| Moisture content | Dry product (<5% moisture content) | Dry product (<5% moisture content) | Dry product (<5% moisture content) | |
| Do you know the exact concentration of the nano component in the product? | No | No | No | |
| Concentration | Pure product (100%) | Pure product (100%) | Pure product (100%) | |
| Does the product contain fibers/fiber like particles? | No | No | No | |
| Inhalation hazard | Unknown | Unknown | Unknown | |
| Does it concern one of the following OECD components? | Fe | Al2O3 | Other MNOs | |
| Is the parent material classified with one or more of the following R-phrases: R40, R42, R43, R45, R46, R49, R68? | — | — | No | |
| Is the primary particle diameter larger than 50 nm? | No | No | No | |
| Nanotool-Parent material | Lowest occupational exposure limit (mg m−3)a | 5 | 4 | 5 |
| Carcinogen | No | Yes | No | |
| Reproductive hazard | Unknown | Yes | No | |
| Mutagen | No | Yes | No | |
| Dermal hazard | No | No | No | |
| Asthmagen | No | No | No | |
| Nanotool-Nanoscale material | Surface reactivity | Unknown | Unknown | Unknown |
| Particle shape | Compact or spherical | Compact or spherical | Compact or spherical | |
| Particle diameter | 11–40 nm | 11–40 nm | 11–40 nm | |
| Solubility | Insoluble | Insoluble | Soluble | |
| Carcinogen | Unknown | Unknown | Unknown | |
| Reproductive hazard | Unknown | Unknown | Unknown | |
| Mutagen | Unknown | Unknown | Unknown | |
| Dermal hazard | Unknown | Unknown | Unknown | |
| Asthmagen | Unknown | Unknown | Unknown | |
| Precautionary matrix-Nanorelevant | Size of primary particle | 1–500 nm | 1–500 nm | 1–500 nm |
| Do the primary particles form agglomerates >500 nm? | Yes | Yes | Yes | |
| In the body does deagglomeration of agglomerates (or aggregates) to primary particles or agglomerates <500 nm occur? | Yes | Yes | Yes | |
| Under the respective environmental conditions does deagglomeration of agglomerates (or aggregates) to primary particles or agglomerates <500 nm occur? | Yes | Yes | Yes | |
| Precautionary matrix-Potential effect | Redox activity of the nanomaterial | Medium | Medium | Low |
| Catalytic activity of the nanomaterial | Medium | Low | Low | |
| Oxygen radical formation potential of the nanomaterial | Unknown | Unknown | Unknown | |
| Induction potential for inflammatory reactions of the nanomaterial | Unknown | Unknown | Unknown | |
| Stability (half-life) of the primary particles present in the nanomaterial in the body | Unknown | Unknown | Unknown | |
| Stability (half-life) of the primary particles present in the nanomaterial under environmental conditions | Unknown | Unknown | Unknown | |
| ECguidance | Chemical formula/Chemical structure | Fe | Al | Ca |
| Appearance | Powder | Powder | Powder | |
| Physical hazard classification of the bulk form | Unknown | Unknown | Unknown | |
| Health hazard classification of the bulk form | Acute Tox. 4 | Acute Tox. 4, Carc. 2, Muta.2 | No | |
| Environmental classification of the bulk form | Aquatic Acute 2 | Aquatic Acute 2 | Unknown | |
| Geometry/Shape, rigidity | Nanoparticle | Nanoparticle | Nanoparticle | |
| Surface composition | No modified | No modified | No modified | |
| Water solubility | Insoluble (<100 mg l−1) | Insoluble (<100 mg l−1) | Soluble (>100 mg l−1) | |
| Dustiness | High | High | High | |
| ISO | OEL dust | A | A | A |
| Acute toxicity | B | B | A | |
| LD50 oral route | A | A | A | |
| LD50 dermal route | Unknown | Unknown | Unknown | |
| LD50 inhalation 4H | Unknown | Unknown | Unknown | |
| Severity of acute effects | B | B | B | |
| Sensitization | No | C | No | |
| Mutagenicity/Genotoxicity | No | E, Muta. 2 | No | |
| Irritant/Corrosiveness | C | A | C | |
| Carcinogenicity | A | C | A | |
| Developmental/Reproductive toxicity | Unknown | D | Unknown | |
| Likelihood of chronic effect | C | C | C | |
| IH/Occupational health experience | Unknown | Unknown | Unknown | |
| IVAM guidance | CAS number | 1309-37-1 | 1344-28-1 | 1317-65-3 |
| Size distribution of the primary particles in the material or product (in nm) | <40 nm | <40 nm | <40 nm | |
| Does the material or product involve fibrous particles | No | No | No | |
| Has the nanomaterial (or its mother material) been classified as CMR substance? | No | Yes | No | |
| Water solubility | No | No | Yes | |
| Density (in kg/dm3) | 5.24 g cm−3 | 3.97 g cm−3 | 2.8 g cm−3 | |
| Physical state of the nanomaterial | Solid | Solid | Solid | |
| ANSES Preliminary question | Does the product contain nanomaterials? | Yes | Yes | Yes |
| Is the nanosubstance already classified by a relevant authority? | No | No | No | |
| Is it a bio persistent fiber? | No | No | No | |
| Is there a preliminary HB for the bulk material or most toxic analogous? | Yes | Yes | Yes | |
| ANSES Bulk material | Substance dissolution time >1 h | Yes | Yes | No |
| Evidence of higher reactivity than bulk/ analogous material? | — | — | No | |
| ANSES Parent material | Acute toxicity | Yes | Yes | No |
| Severity of acute effects | STOT SE2 | STOT SE2 | STOT SE3 | |
| Sensitization | No | Skin Sens.1 | No | |
| Mutagenicity/Genotoxicity | No | Muta. 2 | No | |
| Irritant/Corrosiveness | Eye irrit.2; eye dam. 1 skin irrit. 2 | Eye irrit.2; skin irrit. 2 | Eye irrit.2; eye dam. 1 skin irrit. 2 | |
| Carcinogenicity | No | Carc. 2 | No | |
| Developmental/Reproductive toxicity | Unknown | Repr.2 | Unknown | |
| Likelihood of chronic effect | STOT RE 2 | STOT RE 2 | STOT RE 1 | |
Physicochemical characteristics were presented as diameter, dustiness, and solubility in Nanosafer; as dustiness, moisture content and concentration in Stoffenmanager-Nano; as shape, diameter, and solubility in Nanotool; as solubility and dustiness in the ECguidance, the IVAM Guidance and ANSES. The toxicity data used in Nanosafer, ECguidance, ISO, and ANSES are similar, and were based on the Globally Harmonized System of Classification and Labeling of Chemicals (GHS). For Nanotool, the toxicity data covered reproductive hazard, mutagenicity, dermal hazard and asthma-inducing potential of the parent material and the nanoscale material. In the IVAM Guidance, only carcinogenicity, mutagenicity and reproductive toxicity were considered. There was no toxicity parameter in Stoffenmanager-Nano. The output hazard sensitivity of the CB tools was investigated by varying the following: dustiness, solubility, carcinogenicity, and mutagenicity.
Table 3 shows a summary of the exposure input data for all the tools and scenarios. Exposure was determined by the substance emission potential, the activity emission potential, and exposure control. The substance emission potential is determined by physical form and dustiness. All the three substances are powders and had high dustiness. The activity emission was implemented as a description of energy in Nanosafer, as a task characterization in Stoffenmanager-Nano, and as the amount of material used in Nanotool. For ECguidance, ISO and IVAM Guidance, the activity emission referred to the amount of materials used and the process description. In ANSES, the activity emission was indicated by the process description. The Nanosafer had three energy level categories (high, moderate and low) for activity emission. In Stoffenmanager-Nano, the classification “handling of products with a relatively high speed/force, which leads to dispersion of dust” is equivalent to high energy and “handling of products with medium speed/force” as moderate energy. For Nanotool there was no energy or activity parameter but there was an “amount handled” parameter, with an amount >100 mg as the highest level. For ISO, “amount of powders >1 kg” is equivalent to high energy, “amount of powders >0.1 g” is equivalent to moderate energy and “amount of powders <0.1 g” is equivalent to low energy. For the ECguidance, IVAM Guidance, and ANSES, the amount handled was not an exposure band parameter. In the ECguidance, “handling of dry powders” was classified as high energy and “dry blending of material into a matrix” was classified as medium high energy. In the IVAM Guidance, “filling/packaging of end product, handling of free nanoparticles” was classified as high energy, “weighing or adding nanomaterials” was classified as medium energy, and “working with a fully contained production process” was classified as low energy.
| CB tools | Information requested | Materials | ||
|---|---|---|---|---|
| Fe2O3 Packaging, screening and feeding | Al2O3 Packaging and separation | CaCO3 Packaging and drying | ||
| All tools | Substance emission potential/physical form | Powder | Powder | Powder |
| Activity emission potential/amount handled | 20 kg | Packaging-20 kg; Separation-0.05 kg | Packaging-50 kg; Drying-20 kg | |
| Task duration | Packaging-60 min; Screening-50 min; Feeding-20 min | Packaging-40 min; Separation-15 min | Packaging-90 min; drying-20 min | |
| Task frequency | Daily | Daily | Daily | |
| Volume of the working room | 9600 m3 | 2380 m3 | Assumed 10![[thin space (1/6-em)]](https://www.rsc.org/images/entities/char_2009.gif) 000 m3 000 m3 |
|
| Nanosafer | Energy level | Moderate | Packaging-moderate | Packaging-high |
| Separation-very low | Drying-moderate | |||
| Activity level in the work room | Packaging-high | Packaging-high | Packaging-high | |
| Screening-moderate | Separation-low quiet | Drying-low quiet | ||
| Feeding-low quiet | ||||
| Air exchanges | Packaging-10 n h−1; Screening-2.5 n h−1; feeding-0.5 n h−1 | 0.5 n/h | 0.5 n h−1 | |
| Stoffenmanager nano | Task characterization | Handling of products with medium speed which leads to some dispersion of dust | Packaging-handling of products with medium speed which leads to some dispersion of dust; | Packaging-handing of products with a relative high speed/force, which leads to dispersion of dust; drying-handling of products with medium speed which leads to some dispersion of dust |
| Separation-handing of product in small amounts or in situations where only low quantities of products are likely to be released | ||||
| Is the task being carried out in the breathing zone of an employee (distance head-product <1 meter) | Yes | Yes | Yes | |
| Is there more than one employee carrying out the same task simultaneously | Yes | Yes | Yes | |
| Is the working room being cleaned daily? | Yes | Yes | Yes | |
| Are inspections and maintenance of machines/ancillary equipment being done at least monthly to ensure good condition and proper functioning and performance? | No | No | No | |
| Volume of the working room | >1000 m3 | >1000 m3 | >1000 m3 | |
| Ventilation of the working room | Mechanical and or natural ventilation | Mechanical and or natural ventilation | Mechanical and or natural ventilation | |
| Local control measures | Packaging-containment of source with local exhaust ventilation; screening-use of a product that limits the emission; | Packaging-containment of source | No control measures at the source | |
| Feeding-no control measures at the source | Separation-no control measures at the source | |||
| Is the employee situated in a cabin | No | No | No | |
| Is personal protective equipment applied? | No | No | No | |
| Nanotool | Activity classification | Handling nanoparticles in powder form | Handling nanoparticles in powder form | Handling nanoparticles in powder form |
| Current engineering control | Packaging-Fume hood or local exhaust ventilation | Packaging-containment | General ventilation | |
| Screening and feeding – General ventilation | Separation-general ventilation | |||
| Number of employees with similar exposure | 1–5 | 1–5 | 1–5 | |
| Frequency of operation (annual) | Daily | Daily | Daily | |
| Precautionary matrix | Carrier material | Solid matrix, stable under relevant process conditions or conditions of use, nanomaterial mobile | Solid matrix, stable under relevant process conditions or conditions of use, nanomaterial mobile | Solid matrix, stable under relevant process conditions or conditions of use, nanomaterial mobile |
| Amount of nanomaterials reaching the environment from wastewater, exhaust gases, solid waste per year | 5–500 kg | 5–500 kg | 5–500 kg | |
| Amount of nanomaterials with which a worker comes into contact in the “worst case” | >120 mg | >120 mg | >120 mg | |
| Frequency with which a worker handles the nanomaterial | Daily | Daily | Daily | |
| ECguidance | Activity | Packaging–packaging of end product; feeding-filling; screening-transferring | Packaging–packaging of end product; separation-sampling for quality control | Packaging–packaging of end product; drying-transferring |
| Amount | 20 kg | Packaging-20 kg; Separation-0.05 kg | Packaging-50 kg; Drying-20 kg | |
| Dust emission | Yes | Packaging-yes; separation – No | Yes | |
| Number of workers | Packaging-2; Feeding-2; Screening-2 | Packaging-1; separation-1 | Packaging-2; drying-1 | |
| The potential routes of human exposure | Inhalation | Inhalation | Inhalation | |
| ISO | The form of substance (powder, solid, suspension in a liquid) | Powder | Powder | Powder |
| Amount | >1 kg | Packaging – >1 kg; separation – >0.1g | >1 kg | |
| Potential of dust generation dustiness/process dependent | High | Packaging-high; separation – low | Packaging-high; drying-low | |
| IVAM guidance | Activity | Packaging–packaging of end product; feeding-filling; screening-transferring | Packaging–packaging of end product; separation – sampling for quality control | Packaging–packaging of end product; drying-transferring |
| Used amount | 20 kg | Packaging-20 kg; Separation-0.05 kg | Packaging-50 kg; Drying-20 kg | |
| Emission of dust/mist/haze possible | Yes | Packaging-yes; separation – No | Yes | |
| Amount of workers exposed | Packaging-2; Feeding-2; Screening-2 | Packaging-1; separation-1 | Packaging-2; Drying-1 | |
| ANSES | Physical form | Powder | Powder | Powder |
| Natural tendency of the material | High or moderate dustiness | Packaging-high or moderate dustiness | High or moderate dustiness | |
| Process operation | Manual operation | Manual operation | Manual operation | |
ANSES took only substance emission potential (physical form and dustiness) into account for estimating the exposure band. Nanosafer and Stoffenmanager-Nano took exposure controls into account for estimating the exposure band. The difference was that number of air exchanges was only required by Nanosafer. Stoffenmanager-Nano had different categories for general ventilation and control at the source (containment, local exhaust). The sensitivity of the tools to exposure was investigated by varying the following: (i) the activity emission: high, moderate and low; and (ii) the exposure control: no ventilation (0.5 air exchanges h-1), general mechanical ventilation (2.5 air exchanges h-1) and containment (10 air exchanges h-1).
We compared the output of Nanotool with the exposure band for short-term in the near field (Nanosafer) and the exposure during the task (Stoffenmanager-Nano). For the purpose of comparison, results were presented with a score ranking from 0–100. The score for Nanosafer, which was lower than 1, was multiplied by ten. As for the Stoffenmanager-Nano, the score for intrinsic emission multiplier was the product of dustiness, moisture content, and weight fraction, and was also multiplied by ten.
(d) Comparison of hazard estimates with known toxicity data. The hazard classification of the three materials given by the CB tools were quantitative compared to their inherent toxicity classified by GHS. The toxicity data of the parent and nanoscale materials were obtained from various institutions, including the National Institute for Occupational Safety and Health (NIOSH), US National Library of Medicine, and the European Chemicals Agency.
The Al2O3 is classified as a class 2 carcinogen that can induce DNA damage, whereas the Fe2O3 and CaCO3 have not been reported.40,41 The median lethal dose through oral in rat (LD50) for Al2O3 was 2000 mg kg−1, while the values (through oral or dermal in rat) for Fe2O3 and CaCO3 were 5000–10000 and 20000 mg kg−1, respectively.42 Furthermore, the Fe2O3 might have a chronic aquatic toxicity, as many studies showed that the short-term toxicity of Fe2O3 to aquatic algae EC50 was 100 mg L−1. While no studies indicated there was a short-term toxicity for Al2O3 or CaCO3 to aquatic algae.42 Based on the above comparisons of toxicity data, the order of inherent toxicity was: Al2O3 > Fe2O3 > CaCO3.
(e) Comparison of exposure estimates with measurement data. The exposure scores or exposure band ratios obtained from Nanotool, Nanosafer, Stoffenmanager-Nano, ECguidance, IVAM Guidance, ANSES, and ISO for the three nanomaterials were compared with their measured exposure concentrations in workplaces.
(f) Comprehensive evaluation of quantitative results. According to the results of quantitative comparisons, each of the quantitative evaluation indicators were divided into low, medium, and high levels, which were allocated 1, 2, and 3 points, respectively. For the Precautionary Matrix, the sensitivity/accuracy of hazard and exposure was assigned 0, because it combines hazard and exposure potential in a single score.
3. Statistical analysis
One-way analysis of variance (ANOVA) was used to analyze the RRs across different CB tools (using the LSD comparison method when variances were equal, or the Dunnett T3 comparison method when variances were heterogeneous). The Spearman correlation analysis (abnormal distribution) was utilized to analyze the correlation of RRs.4. Results
4.1 Qualitative comparisons
| Tool | Time of establishment | Scope | Substance evaluated | Assessment method | Aim of evaluation | Number of risk bands |
|---|---|---|---|---|---|---|
| Nanosafer12,14 | 2010 | Small and medium-sized enterprises | Powders | A combination of score-based approach and binary grouping principles for hazard, score-based approach for exposure | Precautionary risk assessment | 5 |
| Stoffenmanager-nano33 | 2012 | Employers, employees | Powders, liquids | Decision tree for hazard and score-based approach for exposure | Prioritization for health risks and implementation of control measures | 3 |
| Nanotool12,13 | 2008 | Nanotechnology researchers | Powders, liquids, and solid materials | Score-based approach for hazard and exposure | Risk assessment and management | 4 |
| Precautionary matrix14,15 | 2011 | Employees, consumers, and the environment | Powders, liquids, and solid materials | Score-based approach | Source identification and risk reduction | 2 |
| ECguidance27 | 2010 | All types of enterprises | Powders | Decision tree | Selection of exposure control | 4 |
| ISO29 | 2014 | Enterprises, research institutes or businesses engaged in the manufacturing and processing of nanomaterials | Powders, liquids, and solid materials | Decision tree | Controlling the risks associated with occupational exposure to nano-objects | 5 |
| IVAM guidance34 | 2011 | Workers | Powders, liquids, and solid materials | Decision tree | Design of appropriate control measures for nanomaterials in workplaces | 3 |
| ANSES19,20 | 2010 | Employers and employees | Powders, liquids, solid nanomaterials, and nano-products | Decision tree | Selection of exposure control | 5 |
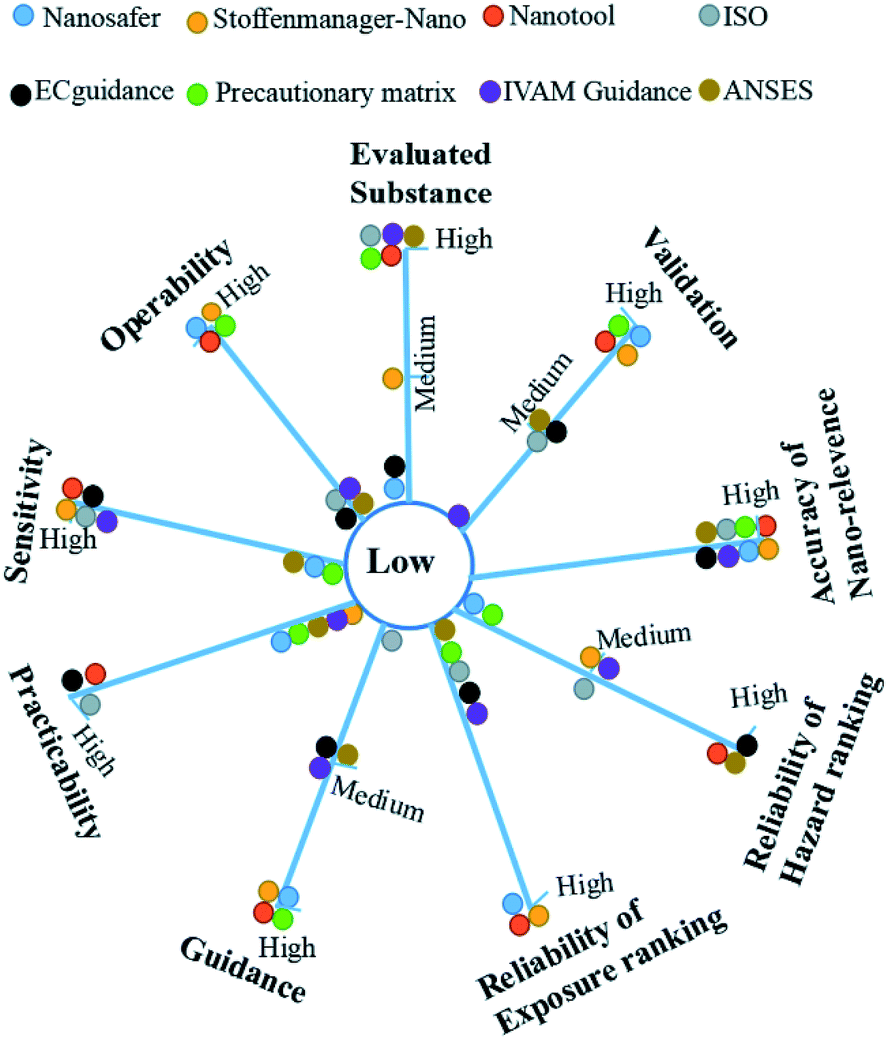 | ||
| Fig. 1 A radar diagram of the qualitative differences between different CB tools. There was a diverse distribution of the CB tools across the different evaluation indicators. The total scores for Nanotool, Stoffenmanager-Nano, Nanosafer, and ECguidance were 19, 17, 15 and 15 respectively, which were higher than other tools. | ||
4.2 Quantitative comparisons between different CB tools
Therefore, the mode sizes of the three materials in all exposure scenarios were less than 100 nm, indicating that the particles in air were airborne nanoparticles. The nano-relevant measurement results supported the evaluation results of the four CB tools that answered “Yes” for three substances in all exposure scenarios. In addition, the measurement results were also in agreement with other four tools including ECguidance, ISO, IVAM Guidance, and ANSES, which only require nano-relevant information based on users' subjective judgment.
| CB tools | Al2O3 (n, (%)) | Fe2O3 (n, (%)) | CaCO3 (n, (%)) | Average (%) | |||
|---|---|---|---|---|---|---|---|
| Hazard | Exposure | Hazard | Exposure | Hazard | Exposure | ||
| Nanosafer | 15 (86.67) | 12 (91.67) | 15 (80.00) | 12 (91.67) | 15 (73.33) | 12 (91.67) | 85.84 |
| Stoffenmanager nano | 10 (80.00) | 14 (100.00) | 10 (80.00) | 14 (100.00) | 10 (80.00) | 14 (100.00) | 90.00 |
| Nanotool | 15 (53.33) | 5 (100.00) | 15 (53.33) | 5 (100.00) | 15 (66.67) | 5 (100.00) | 78.89 |
| Precautionary matrix | 10 (60.00) | 5 (100.00) | 10 (60.00) | 5 (100.00) | 10 (60.00) | 5 (100.00) | 80.00 |
| ECguidance | 9 (88.89) | 6 (100.00) | 9 (88.89) | 6 (100.00) | 9 (77.78) | 6 (100.00) | 92.59 |
| ISO | 13 (76.92) | 4 (100.00) | 13 (69.23) | 4 (100.00) | 13 (69.23) | 4 (100.00) | 85.90 |
| IVAM guidance | 7 (100.00) | 7 (100.00) | 7 (100.00) | 7 (100.00) | 7 (100.00) | 7 (100.00) | 100.00 |
| ANSES | 14 (100.00) | 3 (100.00) | 14 (100.00) | 3 (100.00) | 14 (100.00) | 3 (100.00) | 100.00 |
| Average (%) | 80.12 | 98.96 | 79.16 | 98.96 | 78.30 | 98.96 | — |
Furthermore, the ratio of available hazard information requested by the Precautionary Matrix, ISO, and Nanotool was lower than 70%, while in the Nanosafer, ECguidance, Stoffenmanager-Nano, and ANSES tools, the ratio of available information required for estimating the hazard was greater than 80%. The exposure parameters requested by the tools were easier to get than the hazard information. Table 5 shows that the ratios of available exposure information were higher than the hazard information. In general, the order of the average ratio of information available was: IVAM Guidance = ANSES > ECguidance > Stoffenmanager-Nano > ISO > Nanosafer > Precautionary Matrix > Nanotool.
 | ||
| Fig. 2 Sensitivity of tool hazard band ratio output to changes in hazard input. The Nanotool, ECguidance, and ANSES tools' hazard band ratio outputs for the three materials increased with increasing inherent toxicity as the input parameter. | ||
Fig. 2 shows the sensitivity of the tools' exposure band ratio to changes in exposure input. When the input exposure control measures were increased in the three Fe2O3 scenarios, the output exposure band ratio achieved from Nanotool also increased. The output exposure band ratio of the Stoffenmanager-Nano, IVAM Guidance, and ECguidance tools were relatively sensitive to changes in the exposure input and the exposure control measure. The exposure band ratios from Nanosafer, ISO, and ANSES remained the same even if the input parameters were changed.
In the nano-Al2O3 scenarios, both the activity emission and the level of exposure control measures were increased, leading to increases in the exposure band ratios from all tools except for ANSES.
In the nano-CaCO3 scenarios, the activity emission was increased and the changes in exposure band ratio outputs from Nanotool, ISO, ECguidance, and IVAM Guidance were consistent with the change of input.
As mentioned above, the order of inherent toxicities for three substances was: Al2O3 > Fe2O3 > CaCO3, which was the same result achieved by Nanotool, ECguidance and ANSES, suggesting that the three CB tools were able to obtain relatively accurate results in hazard classification.
| CB tools | Scenarios | CR | Exposure score | Exposure band ratio | Risk band ratio | Preventive measures |
|---|---|---|---|---|---|---|
| Nanosafer | CaCO3 packaging | 7.46 | 24.28 | 1 | 1 | The work should be conducted under strict dust release control, such as in a fume-hood, separate enclosure etc. air-supplied respirators or highly efficient filter masks (PP3 or higher quality) maybe used as a supplement and must be readily available in case of accidents. Expert advice is recommended. |
| CaCO3 drying | 4.66 | 22.96 | 1 | 1 | ||
| Fe2O3 feeding | 4.43 | 0.8359 | 1 | 1 | ||
| Fe2O3 screening | 3.43 | 0.4907 | 1 | 1 | ||
| Al2O3 packaging | 2.26 | 13.12 | 1 | 1 | ||
| Fe2O3 packaging | 1.93 | 0.1636 | 1 | 1 | ||
| Al2O3 separation | 1.79 | 0.0058 | 0.2 | 0.8 | High toxicity suspected and/or high exposure potential. The work should be performed during use of highly efficient local exhaust ventilation, fume-hood, glove-box etc. Use of respiratory protection equipment (PP3 or higher quality) may be relevant depending on the work situation. Make sure to have the personal respiratory protection equipment (PP3 or higher quality) available in case of accidents. | |
| Average of risk band ratio | — | — | — | 0.97 | — | |
| Nanotool | CaCO3 packaging | 7.46 | 80 | 0.75 | 0.75 | Containment |
| CaCO3 drying | 4.66 | 75 | 0.5 | 0.5 | Fume hood or local exhaust ventilation | |
| Fe2O3 feeding | 4.43 | 80 | 0.75 | 1 | Seek specialist advice | |
| Fe2O3 screening | 3.43 | 75 | 0.5 | 0.75 | Containment | |
| Al2O3 packaging | 2.26 | 75 | 0.5 | 0.75 | ||
| Fe2O3 packaging | 1.93 | 70 | 0.5 | 0.75 | ||
| Al2O3 separation | 1.79 | 70 | 0.5 | 0.75 | Fume hood or local exhaust ventilation | |
| Average of risk band ratio | — | — | — | 0.75 | — | |
| Stoffenmanager-Nano | CaCO3 packaging | 7.46 | 75.025 | 1 | 1 | Enclosure of the source in combination with local exhaust ventilation |
| CaCO3 drying | 4.66 | 25.025 | 1 | 1 | — | |
| Fe2O3 feeding | 4.43 | 25.025 | 1 | 1 | ||
| Fe2O3 screening | 3.43 | 7.525 | 0.67 | 1 | ||
| Al2O3 packaging | 2.26 | 7.525 | 1 | 1 | ||
| Fe2O3 packaging | 1.93 | 0.775 | 1 | 1 | ||
| Al2O3 separation | 1.79 | 0.0775 | 0.33 | 1 | ||
| Average of risk band ratio | — | — | — | 1 | ||
| ECguidance | CaCO3 packaging | 7.46 | — | 1 | 0.5 | Specific prevention measures should be implemented. Engineering control measures such as local exhaust ventilation might suffice in minimizing the exposure and associated risk. |
| CaCO3 drying | 4.66 | — | 0.75 | 0.5 | ||
| Fe2O3 feeding | 4.43 | — | 0.75 | 0.5 | ||
| Fe2O3 screening | 3.43 | — | 1 | 0.75 | Closed systems or containment must be used and their efficiency ensured by checking regularly their performance | |
| Al2O3 packaging | 2.26 | — | 1 | 1 | It is essential that measures specifically designed for the processes in question are adopted. | |
| Fe2O3 packaging | 1.93 | — | 1 | 0.75 | Closed systems or containment must be used and their efficiency ensured by checking regularly their performance | |
| Al2O3 separation | 1.79 | — | 0.75 | 0.75 | ||
| Average of risk band ratio | — | — | — | 0.68 | — | |
| ISO | CaCO3 packaging | 7.46 | — | 1 | 0.6 | Enclosed ventilation: Ventilated booth, fume hood, closed reactor with regular opening |
| CaCO3 drying | 4.66 | — | 0.75 | 0.8 | Full containment: Glove box/bags, continuously closed systems | |
| Fe2O3 feeding | 4.43 | — | 1 | 0.8 | ||
| Fe2O3 screening | 3.43 | — | 1 | 0.8 | ||
| Al2O3 packaging | 2.26 | — | 1 | 1 | Full containment and review by a specialist | |
| Fe2O3 packaging | 1.93 | — | 1 | 0.8 | Full containment: Glove box/bags, continuously closed systems | |
| Al2O3 separation | 1.79 | — | 0.5 | 0.8 | ||
| Average of risk band ratio | — | — | — | 0.8 | — | |
| IVAM Guidance | CaCO3 packaging | 7.46 | — | 1 | 1 | The occupational hygienic strategy will be strictly applied and all protective measures that are both technically and organizationally feasible will be implemented. |
| CaCO3 drying | 4.66 | — | 0.67 | 0.67 | According to the occupational hygienic strategy, the technical and organizational control measures are evaluated on their economic feasibility. Control measures will be based on this evaluation. | |
| Fe2O3 feeding | 4.43 | — | 0.67 | 0.67 | ||
| Fe2O3 screening | 3.43 | — | 1 | 1 | The occupational hygienic strategy will be strictly applied and all protective measures that are both technically and organizationally feasible will be implemented. | |
| Al2O3 packaging | 2.26 | — | 1 | 1 | ||
| Fe2O3 packaging | 1.93 | — | 1 | 1 | ||
| Al2O3 separation | 1.79 | — | 0.33 | 0.33 | Apply sufficient (room) ventilation, if needed local exhaust ventilation and/or containment of the emission source and use appropriate personal protective equipment. | |
| Average of risk band ratio | — | — | — | 0.81 | — | |
| ANSES | CaCO3 packaging | 7.46 | — | 1 | 0.8 | Full containment: Continuously closed system |
| CaCO3 drying | 4.66 | — | 1 | 0.8 | ||
| Fe2O3 feeding | 4.43 | — | 1 | 1 | Full containment and review by a specialist required | |
| Fe2O3 screening | 3.43 | — | 1 | 1 | ||
| Al2O3 packaging | 2.26 | — | 1 | 1 | ||
| Fe2O3 packaging | 1.93 | — | 1 | 1 | ||
| Al2O3 separation | 1.79 | — | 1 | 1 | ||
| Average of risk band ratio | — | — | — | 0.94 | — | |
| Precautionary matrix | CaCO3 packaging | 7.46 | — | — | 0.5 | The nanospecific action can be rated as low if without further clarification. |
| CaCO3 drying | 4.66 | — | — | 0.5 | ||
| Fe2O3 feeding | 4.43 | — | — | 1 | Nanospecific action is needed. Existing measures should be reviewed, further clarification undertaken and, if necessary, measures to reduce the risk associated with manufacturing, use and disposal implemented in the interests of precaution. | |
| Fe2O3 screening | 3.43 | — | — | 1 | ||
| Al2O3 packaging | 2.26 | — | — | 1 | ||
| Fe2O3 packaging | 1.93 | — | — | 1 | ||
| Al2O3 separation | 1.79 | — | — | 1 | ||
| Average of risk band ratio | — | — | — | 0.86 | — |
| CB tools Evaluation indicators | Nanosafer | Stoffenmanager-Nano | Nanotool | Precautionary matrix | ECguidance | ISO | IVAM Guidance | ANSES |
|---|---|---|---|---|---|---|---|---|
| Nano-relevance | 2 | 2 | 2 | 2 | 2 | 2 | 2 | 2 |
| Sensitivity of hazard | 1 | 2 | 3 | 0 | 3 | 2 | 2 | 1 |
| Sensitivity of exposure | 2 | 2 | 3 | 0 | 2 | 2 | 2 | 0 |
| Reliability of hazard ranking | 1 | 2 | 3 | 0 | 3 | 2 | 2 | 3 |
| Reliability of exposure ranking | 2 | 2 | 2 | 0 | 1 | 1 | 1 | 1 |
| Total score | 8 | 10 | 13 | 2 | 11 | 9 | 9 | 7 |
5. Discussion
Qualitative analysis of key information for the different CB tools showed that the scope, the substance evaluated, the methodological principles, and the aim of the various CB tools were quite different, suggesting that different tools could produce different estimates for the same substance or scenario. This result also reminds users of the necessity for the careful selection of evaluation CB tools. The results obtained from our key information analysis were consistent with the research of Brouwer6 and Ligouri et al.8 However, the two studies did not make a systematic qualitative comparison between these CB tools. In this study, a multi-criteria analysis was used to evaluate the qualitative differences between the different CB tools. The results showed that there is a wide distribution of the CB tools across the nine evaluation indicators, indicating that our methodology can provide a good qualitative assessment of different CB tools. In addition, the total qualitative scores for Nanotool, Nanosafer, and Stoffenmanager-Nano were higher than the other five tools evaluated in this study. Therefore, these three tools may be more appropriate for the qualitative risk assessment of nanomaterials in workplaces due to their comparative advantages in the evaluation indicators, especially in the validation, reliability of exposure ranking, and operability. Both qualitative and quantitative comparison results showed that the judgment for nano-relevance in the eight CB tools was accurate for the three substances regardless of whether particle size or nanomaterial information was used for verification. This indicates that the eight CB tools can accurately determine the nano-relevance of the evaluated substances as a prerequisite, before proceeding smoothly to the next step of evaluation.Different CB tools estimate the hazards and exposure associated with nanomaterials using different parameters. In this study, quantitative differences in availability of information across different CB tools showed that Nanosafer, the Precautionary Matrix, ECguidance, ISO, ANSES, and Nanotool needed more hazard information for substances than exposure information, and the hazard information required by the CB tools were often not available. For example, the information on mutagenicity, carcinogenicity, dermal hazard, reproductive toxicology, deagglomeration, and redox activity for the three substances required by ISO, ANSES, and Nanotool were difficult to obtain, especially for non-professional occupational health managers. This limitation should remind users that the lack of information easily leads to the different tools producing different estimates for the same substance.35–37 In contrast, the exposure parameters requested by the CB tools were generally classified as basic information that can be expected to be recorded, such as the amounts used, dustiness, room volume, and frequency and activity duration. These were readily available from occupational health surveys. These results regarding the availability of information were consistent with previous studies.4,8
In this study, the quantitative comparisons in the sensitivity of the output to changes in hazard input showed that the hazard band ratios given by Nanotool, ECguidance and ANSES changed with the input parameters, indicating that these three tools are more sensitive to the changes in input. The hazard band ratios given by Stoffenmanager-Nano, IVAM Guidance, and ISO changed with the input parameters in two out of three substances. The hazard band ratios given by Nanosafer remained the same, indicating that it was the least sensitive CB tool. These results are consistent with the study of Sanchez Jiménez et al.,4 which demonstrated that the Nanotool was more sensitive to the changes of input in nine substances, Stoffenmanager-Nano was a relatively sensitive tool, and Nanosafer was the least sensitive tool.
In terms of the sensitivity of output to changes in exposure input, the results showed that Nanotool was sensitive to activity emission and exposure control measures, which is similar to the results of the study by Sanchez Jiménez et al.4 Sanchez Jiménez et al. also reported that Nanosafer and Stoffenmanager-Nano were sensitive to activity emission, but these two tools did not show sensitivity to activity emission in this study. As noted by Dunn et al., the CB tools differ considerably in the grading standard for the amount of nanomaterial handled.7 The inconsistency between the two studies may be related to the total amount of nanomaterial handled which is a key factor affecting the exposure banding in Nanosafer. The amount of each nanomaterial was more than 1 kg (equivalent to high energy in Nanosafer) in this study, while the amount of nanomaterials handled was 1 mg, 100 mg and 1 kg for each nanomaterial respectively (equivalent to low, medium, and high energy respectively) in Sanchez Jiménez et al. However, in Stoffenmanager-Nano, the amount of nanomaterial handled is not an input parameter but a description of the energy put into the process. The Stoffenmanager-Nano classified “handling of products with a relative high speed/force, which leads to dispersion of dust” as high exposure and “handling of products with medium speed/force” as moderate energy. This partitioning may result in the same output for different amounts handled.
The quantitative accuracy comparisons and the qualitative assessments in hazard classification showed that the hazard band ratio given by Nanotool, ECguidance, and ANSES were consistent with the order of inherent toxicity. While Stoffenmanager-Nano, ISO, and IVAM Guidance were consistent with the inherent toxicity to some extent. Interestingly, the article of Sanchez Jiménez et al. provided that the Nanotool classification followed approximately the experimental hazard assessment, and Stoffenmanager-Nano ranked the nanomaterials in the same order as the experimental results,38 which are partially consistent with our results. It is possible that the differences in evaluated nanomaterials and their information availability led to the inconsistency in the results of the two studies. For example, in Stoffenmanager-Nano, the potential hazard level is assessed based on how it relates to the properties (i.e. size, shape and solubility) and the toxicological data available, together with the properties of the parent material.16,39 When the substance is described as having unknown inhalation effects but being one of the OECD-listed (Organization for Economic Cooperation and Development) nanomaterials such as Al2O3 and Fe2O3, the hazard score will be very high. In contrast, CaCO3 was not an OECD-listed nanomaterial and was described as “harmful if swallowed or inhaled, and may cause respiratory irritation”, so it was given a relatively low score. In this study, the evaluated substances were given the same band in Nanosafer which is similar with the results of Sanchez Jiménez et al. This may be related to the classification rules of Nanosafer and the evaluated nanomaterials. Nanosafer estimated the hazard based on occupational exposure limits (OEL) and toxicity data used in GHS or R-phase, but only when the OEL is lower than 1 mg m−1,3 the hazard score will increase 0.06. Otherwise there will be no change in the hazard output. Therefore, when the OELs of evaluated nanomaterials are all lower than 1 mg m−3 or all higher than 1 mg m−1,3 the substances will be classified in the same band in Nanosafer.
The qualitative assessments of accuracy in exposure classification were supported by the quantitative comparisons. Fig. 1 showed that the reliability of exposure rankings for Stoffenmanager-Nano, Nanotool, and Nanosafer was high. The quantitative comparison showed that the classification of Stoffenmanager-Nano, Nanotool, and Nanosafer correlated with the particle number concentration ratios. In this study, the quantitative results also showed that in ANSES there was no change in exposure band ratio, suggesting that the reliability of exposure ranking was low, which is consistent with the qualitative result.
The qualitative and quantitative comparison results showed some degrees of consistency. The qualitative comparison result showed that the total scores for Nanotool, Stoffenmanager-Nano and Nanosafer were higher than other tools, while the quantitative result showed that Nanotool, ECguidance, and Stoffenmanager-Nano got higher scores than other tools. Therefore, it can be concluded that Nanotool and Stoffenmanager-Nano might have comprehensive advantages over the other tools.
Further, correlation analysis showed that there were no correlations between multiple models, indicating that each tool was relatively independent, except for the correlations between two specific combinations: between the Precautionary matrix and ANSES, and between Nanosafer and IVAM Guidance.
The risk bands and preventive measures for different scenarios were also analyzed. Interestingly, Table 6 showed that the average risk ratio given by Stoffenmanager-Nano was the most stringent. This may be because Stoffenmanager-Nano was developed as a practical approach for employers and employees for risk prioritization, and its risk bands were classified in three priority bands corresponding to low/medium/high priorities of action.
More information is needed to validate these CB tools in order to determine whether the use of CB tools can adequately reduce worker's nanomaterial exposure to safe levels. It would be useful to replicate the study using more substances from various factories to further compare the tools and to see if they perform similarly across multiple samples and scenarios.
6. Conclusions
In summary, the following conclusions can be drawn: (i) Nanotool, Nanosafer, and Stoffenmanager-Nano tools have a higher comprehensive advantage over other tools based on qualitative assessment; (ii) the input exposure information was more readily available than the hazard information; (iii) the hazard band ratios given by Nanotool, ECguidance, and ANSES were sensitive to changes in hazard input and were consistent with the order of inherent toxicity; (iv) Nanotool was the most sensitive, and ISO, ECguidance, and IVAM Guidance had good sensitivity in exposure band ratio output to changes in exposure input; (v) the exposure classification given by Stoffenmanager-Nano, Nanotool, and Nanosafer had good correlation with the particle number concentration ratios; (vi) each tool has its own characteristics and scope of application; (vii) Nanotool and Stoffenmanager-Nano have a comprehensive advantage over other tools based on both qualitative and quantitative assessments.This study provides a recommendation for joint application of risk assessment methods for nanomaterials in workplaces, which will help developing countries establish and refine their own methodologies. The eight tools may be useful as a first step in risk assessment, but it is also important to consider the objective and the information needed when selecting a tool. Ideally, more than one tool should be selected for comparing findings and to better inform decision making.
Conflicts of interest
There are no conflicts to declare.Acknowledgements
This work was sponsored by the Zhejiang Provincial Program for the Cultivation of High-level Innovative Health talents, the Medical Health Technology Project by Health Commission of Zhejiang (No. 2018KY332 and 2020KY517), and the reform and development program from Beijing Municipal Institute of Labor Protection in 2019, and in part supported by the Natural Science Foundation of China (81472961), the Health Commission of Zhejiang Province (No. WSK2014-2-004), and the Key Research and Development Program of Zhejiang Province of China (No. 2015C03039).Notes and references
- K. Savolainen, H. Alenius, H. Norppa, L. Pylkkanen, T. Tuomi and G. Kasper, Toxicology, 2010, 269, 92–104 CrossRef CAS
.
- A. D. Maynard, Nat. Nanotechnol., 2014, 9, 159–160 CrossRef CAS
- D. M. Zalk and D. I. Nelson, J. Occup. Environ. Hyg., 2008, 5, 330–346 CrossRef CAS
- A. Sanchez Jimenez, J. Varet, C. Poland, G. J. Fern, S. M. Hankin and M. van Tongeren, J. Occup. Environ. Hyg., 2016, 13, 936–949 CrossRef
- H. D. Xu, L. Zhao, S. C. Tang, J. Zhang, F. L. Kong and G. Jia, Chin. J. Ind. Hyg. Occup. Dis., 2016, 34, 905–910 CAS
- D. H. Brouwer, Ann. Occup. Hyg., 2012, 56, 506–514 Search PubMed
- K. H. Dunn, A. C. Eastlake, M. Story and E. D. Kuempel, Ann. Work Exposures Health, 2018, 62, 362–388 CrossRef CAS
- B. Liguori, S. F. Hansen, A. Baun and K. A. Jensen, NanoImpact, 2016, 2, 1–17 CrossRef
- M. Xing, Y. Zhang, H. Zou, C. Quan, B. Chang, S. Tang and M. Zhang, Inhalation Toxicol., 2015, 27, 138–148 CrossRef CAS
- M. Xing, H. Zou, X. Gao, B. Chang, S. Tang and M. Zhang, Environ. Sci.: Processes Impacts, 2015, 17, 656–666 RSC
- F. Tian, M. Zhang, L. Zhou, H. Zou, A. Wang and M. Hao, J. Occup. Health, 2018, 60, 337–347 CrossRef CAS
- N. R. C. f. t. W. Environment, NanoSafer v 1.1, http://nanosafer.org/Default, 1.1 beta.
- J. Höck, T. Epprecht and E. Furrer, et al., Federal Office of Public Health and Federal Office for the Environment, 2011, Berne, Version 2.1 Search PubMed
- T. Schneider, D. H. Brouwer, I. K. Koponen, K. A. Jensen, W. Fransman, B. Van Duuren-Stuurman, M. Van Tongeren and E. Tielemans, J. Exposure Sci. Environ. Epidemiol., 2011, 21, 450–463 CrossRef CAS
- O. f. S. R. (TNO), Stoffenmanager Nano, https://nano.stoffenmanager.nl/.
- B. Van Duuren-Stuurman, S. R. Vink, K. J. Verbist, H. G. Heussen, D. H. Brouwer, D. E. Kroese, M. F. Van Niftrik, E. Tielemans and W. Fransman, Ann. Occup. Hyg., 2012, 56, 525–541 Search PubMed
- K. Verbist, Stoffenmanager Nano: How (Well) Does It Work?, Edinburgh, UK, 2012 Search PubMed
- D. M. Zalk, R. Kamerzell, S. Paik, J. Kapp, D. Harrington and P. Swuste, J. Nanopart. Res., 2010, 11, 1685–1704 CrossRef
- S. Y. Paik, D. M. Zalk and P. Swuste, Ann. Occup. Hyg., 2008, 52, 419–428 CAS
- Y. Astier, O. Uzun and F. Stellacci, Small, 2009, 5, 1273–1278 CrossRef CAS
- A. Eastlake, R. Zumwalde and C. Geraci, J. Nanopart. Res., 2016, 18, 1–24 CrossRef
- S. Foss, H. Og, A. Baun, D. Environment and K. Alstrup-Jensen, 2011.
- J. Höck, H. Hofmann, H. Krug, C. Lorenz, L. Limbach, B. Nowack, M. Riediker, K. Schirmer, C. Som, W. Stark, C. Studer, N. von Götz, S. Wengert and P. Wick, Precautionary Matrix for Synthetic Nanomaterials, Federal Office for Public Health and Federal Office for the Environment, Berne, 2008 Search PubMed.
- J. Höck, T. Epprecht, H. Hofmann, K. Höhner, H. Krug, C. Lorenz, L. Limbach, P. Gehr, B. Nowack, M. Riediker, K. Schirmer, B. Schmid, C. Som, W. Stark, C. Studer, A. Ulrich, N. von Götz, S. Wengert and P. Wick, Precautionary Matrix for Synthetic Nanomaterials, Federal Office for Public Health and Federal Office for the Environment, Berne, 2010 Search PubMed.
- J. W. Stark, C. Studer and A. Ulrich, 2010.
- E. T. Höck J., E. Furrer, M. Gautschi, H. Hofmann, K. Höhener, K. Knauer, H. Krug, et al., Federal Office of Public Health and Federal Office for the Environment, 2013, BAG/BAFU, Version 3.0 Search PubMed
- R. P. A. Ltd, Guidance on the protection of the health and safety of workers from the potential risks related to nanomaterials at work, 2014 Search PubMed
- F. Jongeneelen, R. Cornelissen, P. van Broekhuizen and F. van Broekhuizen, Guidance working safely with nanomaterials and products, the guide for employers and employees, IVAM UvA bv, 2011 Search PubMed.
- R. D. Via, T. Winters, J. W. Bennie, B. Bryant, J. M. Cousineau, J. Deakin, S. Dénommée, J. Forget, J. Dumont and H. M. Gillis, ISO/TS 12901-2:2014, 31, 2014.
- M. Riediker, C. Ostiguy, J. Triolet, P. Troisfontaine, D. Vernez, G. Bourdel, N. Thieriet and A. Cadène, J. Nanomater., 2012, 2012, 8 Search PubMed
- C. Ostiguy, M. Riediker, J. Triolet, P. Troisfontaines, and D. Vernez, French Agency for food, environmental and occupational health and safety (ANSES), 2010 Search PubMed
- C. Lesmes-Fabian, Int. J. Environ. Res. Public Health, 2015, 12, 4670–4696 CrossRef
- D. B. Van, S. R. Vink, K. J. Verbist, H. G. Heussen, D. H. Brouwer and D. E. Kroese, et al., Ann. Occup. Hyg., 2012, 56, 525 Search PubMed
- R. Cornelissen, F. Jongeneelen, P. van Broekhuizen, and F. van Broekhuizen, Guidance working safely with nanomaterials and products, the guide for employers and employees, Amsterdam, The Netherlands, 2011 Search PubMed
- M. Kupczewskadobecka, S. Czerczak and S. Brzeźnicki, Environ. Toxicol. Pharmacol., 2012, 34, 512–518 CrossRef CAS
- E. Hofstetter, J. W. Spencer, K. Hiteshew, M. Coutu and M. Nealley, Ann. Occup. Hyg., 2013, 57, 210–220 CAS
- N. Savic, D. Racordon, D. Buchs, B. Gasic and D. Vernez, Ann. Occup. Hyg., 2016, 60, 991–1008 CrossRef PubMed
- F. L. Andrea Spinazzè1, D. Campagnolo, S. Rovelli1, M. Locatelli, A. Cattaneo and D. M. Cavallo, Ann. Work Exposures Health, 2017, 61, 284–298 CrossRef PubMed
- B. Xing, N. Senesi and D. Chad, Engineered Nanoparticles and the Environment: Biophysicochemical Processes and Toxicity, John Wiley & Sons, 2016, vol. 4, pp. 28–29 Search PubMed
- International Labour Organization, International Chemical Safety Cards database, https://www.ilo.org/dyn/icsc/showcard.home Search PubMed.
- P. Koedrith, R. Boonprasert, J. Y. Kwon, Im-S. Kim and Y. R. Seo, Mol. Cell. Toxicol., 2014, 2, 107–126 CrossRef
- European Chemicals agency, https://echa.europa.eu/.
| This journal is © The Royal Society of Chemistry 2019 |