 Open Access Article
The effective photocatalysis and antibacterial properties of AgBr/AgVO3 composites under visible-light
Jie Zhang *abd,
Jia Wangabcd,
Huihui Xu*abcd,
Xianzi Lvabd,
YuXiang Zenga,
Jizhou Duanabd and
Baorong Houabd
aKey Laboratory of Marine Environmental Corrosion and Bio-fouling, Institute of Oceanology, Chinese Academy of Sciences, 7 Nanhai Road, Qingdao, 266071, China. E-mail: zhangjie@qdio.ac.cn; xuhuihui16@mails.ucas.ac.cn; Fax: +86-532-82880498; Tel: +86-532-82898851
bOpen Studio for Marine Corrosion and Protection, Pilot National Laboratory for Marine Science and Technology, Qingdao 266237, China
cUniversity of Chinese Academy of Sciences, Beijing, 100049, China
dCenter for Ocean Mega-Science, Chinese Academy of Sciences, Qingdao, 266071, China
First published on 13th November 2019
Abstract
With the discharge of large amount of organic pollutants and antibiotics into the water environment, the water cycle has been seriously polluted, and at the same time, various drug-resistant bacteria have emerged in succession, which poses a serious threat to human health. In recent years, photocatalytic nanomaterials have become a research hotspot in the antimicrobial area. In this study, AgBr/AgVO3 photocatalysts were prepared by a hydrothermal process and an in situ growth method. The composites were tightly connected by the (501) plane of AgVO3 and the (200) lattice plane of AgBr. The photocatalytic activity was tested by degrading Rhodamine B (RhB) solution under visible-light, and the result indicated that the photodegradation rate for RhB solution was 92.3% by the photocatalysis with 0.5AgBr/AgVO3 and the photocatalytic performance of 0.5AgBr/AgVO3 was improved compared to pure AgVO3 and AgBr. In addition, more than 99.997% of E. coli, S. aureus, and P. aeruginosa cells were killed by the photocatalysis with 0.5AgBr/AgVO3 within 30 min. These results demonstrated that the 0.5AgBr/AgVO3 heterojunction photocatalyst could be widely used in the treatment of environmental pollution and in the antibacterial field.
Introduction
In order to realize the effective utilization of solar energy and reduce the harm of antimicrobial materials to the environment and human beings, it is of great significance to develop and design green environment-friendly photocatalytic antimicrobial materials. In recent years, photocatalytic nanomaterials have become a research hotspot in the field of antimicrobials1–8 because of their good broad-spectrum antimicrobial properties, lack of secondary pollution and stability. Many studies have examined the antibacterial properties of photocatalysts on E. coli,1,3–5,8 S. aureus,1,8 P. aeruginosa,6 Lactobacillus2 and Sulfate Reducing Bacteria.2Under light irradiation, the semiconductor will generate electrons and holes which react with water or air to form reactive oxygen species (·OH−, ·O2−, h+).1,7 These free radicals will destroy the cell walls and cell membranes of microbial cells, lead to the leakage of cytoplasm and cause the apoptosis of microbial cells. At the same time, these free radicals can also enter the cell, destroy the functional macromolecules in the cell, cause the disorder of growth and metabolism of microbial cells, and further oxidize and decompose microbial metabolites and intracellular substances, so as to achieve the complete killing of microorganisms.
Currently, AgVO3 (p-type semiconductor) material has received increasing attention because of its narrow band gap, stable structure, excellent photocatalytic performance and potential applications in batteries and sensors.8,9 However, because of its high recombination rate of photoelectron–hole pairs, it's necessary to enhance the photocatalytic performance by forming heterojunctions between AgVO3 and other semiconductors. Some scholars have designed AgVO3-based composites, such as Ag/AgVO3/RGO,10 InVO4/AgVO3,8 and AgVO3/MoS2.11 And the above composites are mainly used for degrading poisonous chemicals, and rarely used to sterilize. At the same time, AgBr (n-type semiconductor)12 has been widely investigated as co-catalyst because of its excellent photocatalytic activity. Therefore, our goal is to obtain AgBr/AgVO3 composite with excellent activity and stability that can be used in photocatalytic antibacterial area and water purification applications.
In this work, AgBr/AgVO3 photocatalysts with different molar ratios were prepared via a hydrothermal process and an in situ growth method. The morphology, structure and composition of AgBr/AgVO3 nanocomposites were revealed by X-ray powder diffraction (XRD), scanning electron microscopy (SEM), transmission electron microscopy (TEM), nitrogen (N2) absorption (BET specific surface area) and X-ray photoelectron spectroscopy (XPS). The photocatalytic activities of AgBr/AgVO3 composites were tested by degrading organic pollutants RhB solution. And the antibacterial activity was determined by killing E. coli, S. aureus, and P. aeruginosa, which were used as model bacteria. Moreover, a mechanism for the photocatalytic reactions of AgBr/AgVO3 heterojunction was proposed based on the above experimental data.
Experimental section
Chemicals
AgNO3, NH4VO3, NaBr, HNO3, NH3·H2O, Rhodamine B (RhB), iso-propyl alcohol (IPA), benzoquinone (BQ) and sodium oxalate (MSDS) were used. All the reagents were of analytical grade and used as received without further purification. P. aeruginosa (a Gram-negative bacteria), E. coli (a Gram-negative bacteria) and S. aureus (a Gram-positive bacteria) were obtained from the Institute of Oceanology, Chinese Academy of Sciences (Qingdao, China).Synthesis of AgBr/AgVO3 photocatalysts
AgVO3 samples were synthesized via a hydrothermal process as follows: 0.34 g AgNO3 was dissolved in 30 ml distilled water under magnetic stirring to obtain solution A, and 0.234 g NH4VO3 was dissolved in 30 ml distilled water to obtain solution B. Solution A was added dropwise to solution B and the pH of the final suspension was adjusted to 7.0 with 2.0 M HNO3 and NH3·H2O. The mixture was transferred into a 100 ml Teflon-lined stainless steel autoclave, which was heated to 180 °C for 24 h.13 The products were cooled to room temperature and washed with water and ethanol and collected after filtering. Finally, the samples were dried at 60 °C a vacuum oven for 12 h to obtain pure AgVO3 crystals with one-dimensional rod-like nanostructures. The rod-like structure of AgVO3 was selected because the one-dimensional nanostructure exhibited photocatalytic activity superior to that of nanosheet structure.14For the synthesis of AgBr/AgVO3 photocatalysts: 0.2068 g AgVO3 powder was dispersed into 30 ml absolute ethanol and sonicated for 60 min. After that, 0.085 g AgNO3 was dissolved into the solution and stirred magnetically for another 30 min. NaBr (0.0514 g) was dissolved in 20 ml deionized water and added dropwise into the above solution under constant magnetic stirring and then stirred for another 3 h in the dark. The precipitate was filtered and washed with deionized water and ethanol. The final product was dried at 60 °C for 12 h in the dark. The sample was denoted as “0.5AgBr/AgVO3”. Using this method, AgBr/AgVO3 photocatalysts with different molar ratios were prepared and termed as 0.1AgBr/AgVO3, 0.3AgBr/AgVO3, 0.5AgBr/AgVO3 and 0.7AgBr/AgVO3. For comparison, AgBr photocatalyst was also prepared using the similar method.
Characterization
The phase purity and components of the AgBr/AgVO3 photocatalysts were characterized by XRD (Rigaku D/max-3C, Japan) operating at 40 kV and 30 mA with Cu Kα radiation (λ = 0.15406 nm). TEM and HRTEM images were taken on a Tecnai G220 transmission electron microscope at 200 kV acceleration voltage. The nitrogen (N2) adsorption–desorption measurements were conducted at 77 K by use of Micromeritics ASAP2020, and the sample was degassed at 200 °C for 6 h to remove physisorbed gases. The Brunauer–Emmett–Teller (BET) approach using adsorption data was followed to evaluate the specific surface area. The X-ray photoelectron spectroscopy (XPS) measurements were measured using a Multifunctional imaging electron spectrometer (Thermo ESCALAB 250XI, USA). The UV-vis diffuse reflectance spectra (UV-DRS) of the samples were tested using a Hitachi U-3900H Spectrometer (Japan) using BaSO4 as the reference.Photocatalytic performance
In this paper, RhB was selected as a model pollutant to determine the catalytic performance of the heterostructures, and an 800 W xenon lamp15 was used as the visible light source (XPA-7, Xujiang Electromechanical Plant, Nanjing, China). And the wavelength range of the final output light was 420–780 nm, which coincided with the range of visible light. In this experiment, 30 mg of the catalysts were added to 50 ml of RhB (10 mg l−1) solution. The solution was stirred for 30 min in the dark to ensure the establishment of an adsorption–desorption equilibrium.1 During the irradiation, 4 ml of the suspension was collected and analyzed after centrifugation at regular intervals. The concentration of RhB solution was determined using a TU-1901 spectrometer. The RhB photodegradation process was approximated by the following pseudo-first-order kinetic model:16 ln(Ct/C0) = kt, where t is the reaction time, Ct is the organic pollutant concentrations at reaction time t, C0 is the initial concentration, and the rate constant k is the slope of the corresponding fitted curves.Photocatalytic antibacterial experiments
In the antibacterial experiment, an 800 W Xe lamp was used as the light source, and E. coli, S. aureus and P. aeruginosa were used as model bacteria.15 Typically, 20 mg of photocatalyst, 45 ml of sterilized natural seawater, and 5 ml of bacterial suspension were added to 50 ml quartz tubes in sequence. The suspension was magnetically stirred for 30 min in the dark to establish an adsorption–desorption equilibrium. During the irradiation, 1 ml of the suspension was collected and diluted with sterilized seawater. Then, 100 μl of the diluted suspension was dropped on LB or 2216E agar plates. After incubation at 37 °C for 24 h, the number of bacterial colonies (in cfu) were calculated. The antibacterial rate was computed as follows:1,7| survival rate (%) = (Nt/N0) × 100%. |
| antibacterial rate (%) = 100 − survival rate. |
Results and discussion
The structural analysis of photocatalysts
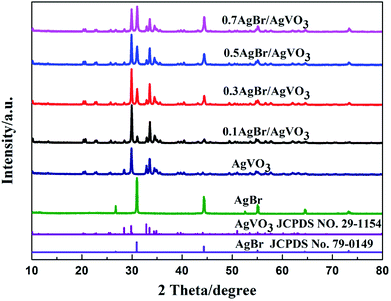
The crystal phase and structure of the photocatalysts were determined by XRD, and the XRD patterns were shown in Fig. 1. The pure AgVO3 sample showed diffraction peaks at 2θ = 28.4°, 29.8°, 32.8°, 33.5°, 34.4°, 34.9° and 50.9°, which can be indexed to the AgVO3 (−211), (501), (−411), (−112), (−602), (112) and (020) planes (JCPDS No. 29-1154).8 For pure AgBr, strong peaks occurred at 2θ = 30.9°, 44.3°, 55.0° and 73.2°, which can be indexed to the AgBr (200), (220), (222) and (420) planes (JCPDS No. 79-0149).17 The AgBr/AgVO3 photocatalysts had characteristic diffraction peaks that could be indexed to monoclinic-phase AgVO3 (JCPDS No. 29-1154) and cubic-phase AgBr (JCPDS No. 79-0149). In addition, the intensities of the diffraction peaks of AgBr increased gradually with the increase of the AgBr concentration in the AgBr/AgVO3 composites, while those of AgVO3 decreased as its content decreased. No peaks of other samples were shown in the AgBr/AgVO3 composites, indicating that the composites were only composed of AgBr and AgVO3.Characterization of the photocatalysts
Fig. 2(a–f) showed the SEM images of pure AgVO3, AgBr and AgBr/AgVO3 samples with different molar ratios. As shown in Fig. 2(a), pure AgVO3 exhibited a rod-like structure, with a diameter of approximately 500 nm, and the shape of pure AgBr crystals were irregular (Fig. 2(b)). The AgBr/AgVO3 heterostructure was a rod-like structure with spherical shapes, as shown in Fig. 2(c–f). With the increase of molar ratio of AgBr, the amount of AgBr particles attached to the rod-like AgVO3 increased. When the loading was large, the AgBr particles aggregated into a cluster and accumulated on the rod structure.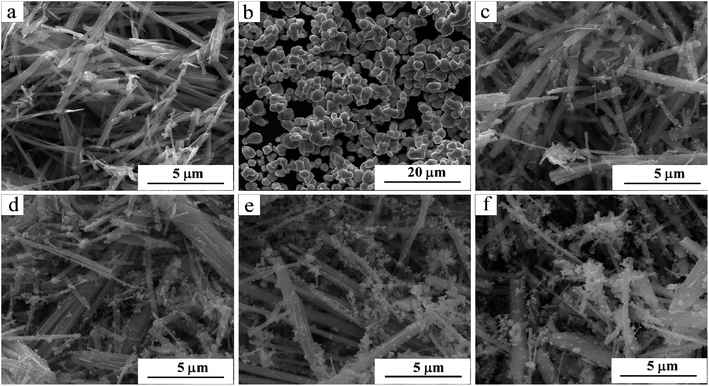 | ||
| Fig. 2 SEM images of as-synthesized samples: (a) pure AgVO3, (b) pure AgBr, (c) 0.1AgBr/AgVO3, (d) 0.3AgBr/AgVO3, (e) 0.5AgBr/AgVO3, (f) 0.7AgBr/AgVO3. | ||
In order to further investigate the microstructure of the 0.5AgBr/AgVO3 composite, TEM, HRTEM were carried out. It can be seen that the 0.5AgBr/AgVO3 composite had a rod-like structure with irregular particles in Fig. 3(a and b). In addition, the enlarged TEM image in Fig. 3(c) clearly showed the rod-like structure (diameters of approximately 500 nm) with irregular particles (an average size of 50 nm). The HRTEM image (Fig. 3(d)) showed clearly two sets of different lattice fringes with calculated spaces of 0.2985 nm and 0.2850 nm, which were in agreement with the (501) lattice plane of the tetragonal AgVO3 (ref. 8 and 10) and (200) lattice plane of the orthorhombic AgBr,18,19 respectively. The result demonstrated that a well-defined heterojunction structure was formed between AgBr and AgVO3, which was consistent with the XRD results.
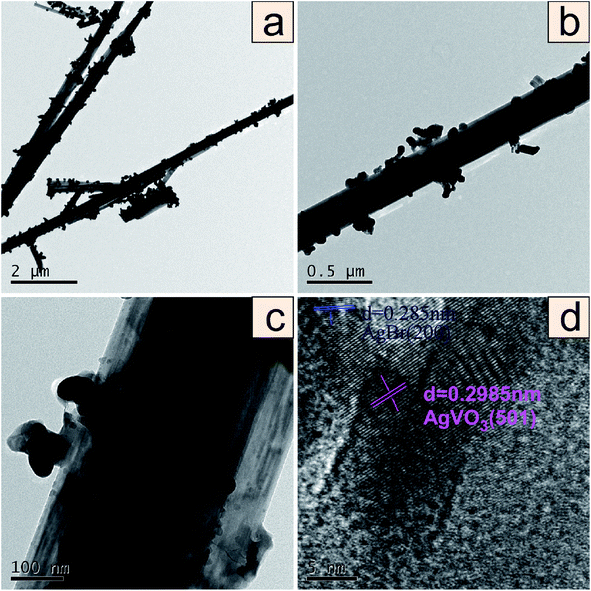 | ||
| Fig. 3 TEM images in low magnification (a and b), high magnification (c) and the corresponding HRTEM image of 0.5AgVO3/AgBr (d). | ||
The BET specific surface area data of different proportion of photocatalysts was shown in Table 1. The specific surface area of the 0.3 AgBr/AgVO3 composite photocatalyst was the largest, with a value of 35.0681 m2 g−1. When the doping ratio of AgBr was further increased, the specific surface area of the photocatalyst decreases and the specific surface areas of 0.5AgBr/AgVO3 and 0.7AgBr/AgVO3 were 21.7348 m2 g−1 and 11.1933 m2 g−1 respectively. The reason was that coalescence of AgBr nanoparticles resulted in the grain growth and the specific surface area reduction for 0.5AgBr/AgVO3 and 0.7AgBr/AgVO3.20 Fig. 2 can provide us with the basis for speculation. It can also be seen from Fig. 2 that pure AgBr nanoparticles cluster together, thus the specific surface area of AgBr is small. Above all, coupling AgBr with AgVO3 promotes the specific surface area of AgVO3. High specific surface area is more conducive to the diffusion and adsorption of pollutants and increase the reaction sites, thus further improving its catalytic activity.21,22
| Sample | SBET/(m2 g−1) |
|---|---|
| AgBr | 3.8990 |
| AgVO3 | 9.0904 |
| 0.1AgBr/AgVO3 | 23.3675 |
| 0.3AgBr/AgVO3 | 35.0681 |
| 0.5AgBr/AgVO3 | 21.7348 |
| 0.7AgBr/AgVO3 | 11.1933 |
XPS spectra of 0.5AgBr/AgVO3 composite were obtained to investigate the elemental composition and valence states. As shown in Fig. 4(a), XPS survey spectrum (Fig. 4(a)) revealed the presence of Ag 3d, V 2p, Br 3d and O 1s electronic states in the composite. Fig. 4(b) showed a high-resolution XPS spectrum of Ag 3d, and there were two peaks at 367.8 eV and 373.8 eV corresponding to Ag 3d5/2 and Ag 3d3/2, respectively, which can be attributed to Ag+ of AgBr or AgVO3.8 And the peaks at 368.6 and 374.6 eV can be ascribed to Ag0 species, according to previous report19 which further verified the existence of Ag0 in AgBr/AgVO3. The spectrum of V 2p (Fig. 4(c)) showed that the signals for V 2p1/2 and V 2p3/2 were approximately 524.11 eV and 516.75 eV, respectively, corresponding to V5+ in AgVO3.7,19 The spectrum of Br 3d was shown in Fig. 4(e), and there were two peaks at 68.65 eV and 69.64 eV, which were consistent with Br 3d5/2 and Br 3d3/2 peaks,18,19 corresponding to Br− in AgBr. The Br/V molar ratio was calculated as 0.619 by sensitivity factor method, which is 23.8% higher than its nominal composition (0.5), and it indicates that bromine atoms are really dispersed on the catalysts surface. The oxygen peak is generally fitted by two components, respectively corresponded to oxygen in the oxide lattice and surface OH groups or undissociated water.14 Fig. 4(d) presents the high resolution XPS spectrum O 1s peaks. The peaks situated at 530.02 eV and 531.9 eV can be attributed to V–O and the –OH on the surface of the samples. Yang Xu et al. obtained similar results to ours for XPS spectrum of O 1s.23 According to Fig. 4(d), the ratio of the surface –OH to the total oxygen components can be estimated roughly to be 28.9%. The resultant abundant surface hydroxyl groups have been confirmed the strong chemical interaction between AgBr/AgVO3. The presence of hydroxyl groups also contributes to the photocatalytic reactions, because they can act as capture centers for photoinduced electrons. Overall, the XPS results confirmed that AgBr and AgVO3 coexisted in the AgBr/AgVO3 composites.
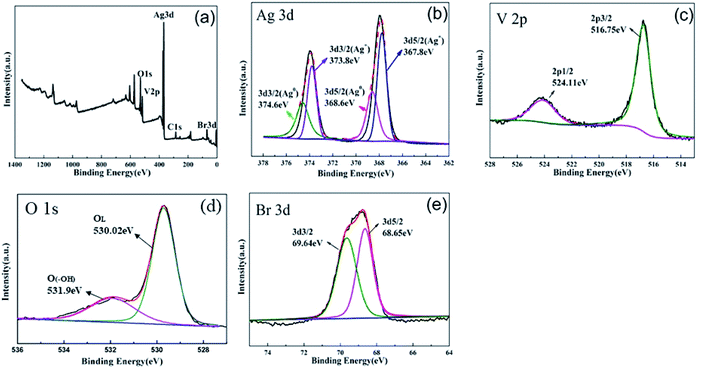 | ||
| Fig. 4 XPS spectra of 0.5AgBr/AgVO3 composition: (a) survey, (b) Ag 3d, (c) V 2p, (d) O 1s, and (e) Br 3d. | ||
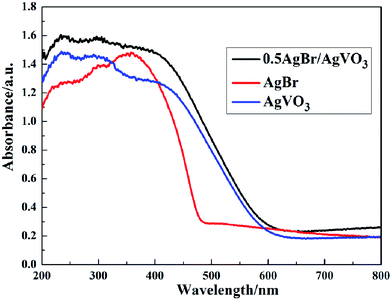
The UV-vis diffuse reflectance spectra was measured to study the photophysical properties of AgBr/AgVO3 samples. It can be seen that the initiation of the adsorption edge of AgVO3 was approximately 610 nm in Fig. 5. And it was calculated that the optical band-gap energy of AgVO3 was 2.03 eV (ref. 8) by using the equation Eg = 1240/λ. Simultaneously, the initiation of the adsorption edge of AgBr was approximately 480 nm, corresponding to a 2.58 eV band gap.18,19,24 After loading AgBr, the absorption band edge showed a significant shift to the visible-light region because of the synergistic effect between AgBr and AgVO3.
The photocatalytic activity
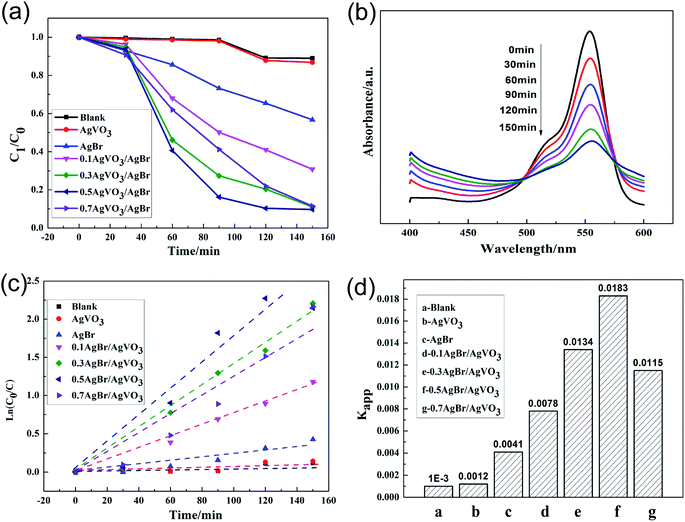
The activity of the catalysts was evaluated by comparing the degradation rates of RhB solution under visible light irradiation. The photocatalytic performances of AgBr/AgVO3 catalysts were shown in Fig. 6. As shown in Fig. 6(a), in the blank experiment, the degradation rate of RhB solution was very low, therefore the effects of visible light and other environmental factors did not need to be considered in the results.1,25 In addition, it can be seen that the 0.5AgBr/AgVO3 photocatalyst had a higher degradation efficiency compared to pure AgVO3 and AgBr/AgVO3 compositions with other molar ratios under visible light in Fig. 6(a). In Fig. 6(b), the maximum absorbance of RhB solution was at 554 nm,26 and the peak intensity at 554 nm decreased progressively by the photocatalysis of 0.5AgBr/AgVO3 composites under visible light. After 150 min of irradiation, 92.3% of the RhB was degraded. In Fig. 6(c and d), the pseudo-first-order reaction kinetic constant Kapp27 of RhB was 0.0183 min−1 by the photocatalysis of 0.5AgBr/AgVO3, which was 15 times higher than that of pure AgVO3.Photocatalytic antibacterial efficiency
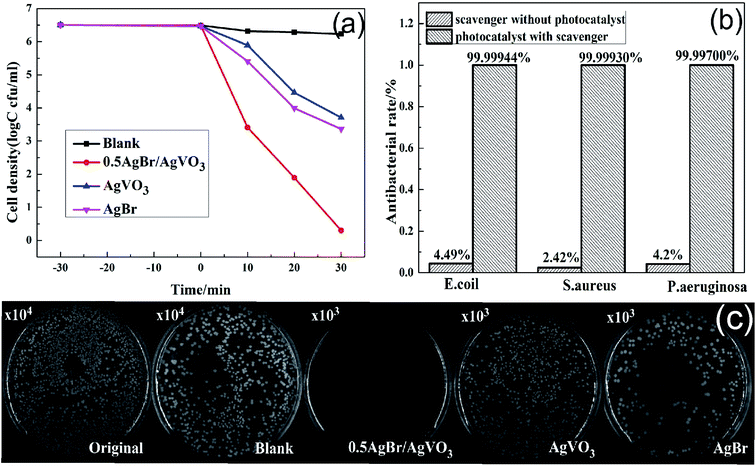
In this study, P. aeruginosa (3.2 × 10⁶ cfu per ml), E. coli (3.54 × 10⁷ cfu per ml) and S. aureus (1.4 × 10⁷ cfu per ml) were chosen as model bacteria to evaluate the photocatalytic antibacterial activities of the prepared photocatalysts under visible light irradiation. As shown in Fig. 7(a), the survival curves of P. aeruginosa suggested that the number of bacterial cells remained constant in the blank experiments, indicating that there was no effect to the bacterial cells for photocatalysts in the dark. In addition, it can be seen in Fig. 7(a) that the 0.5AgBr/AgVO3 photocatalysts exhibited enhanced photocatalytic antibacterial activities by comparison with pure AgBr and pure AgVO3 under visible-light. In addition, the survival pictures of P. aeruginosa colonies in the presence of different photocatalysts were shown in Fig. 7(c). The photocatalytic performance of the 0.5AgBr/AgVO3 compositions was improved because of the formation of the p–n heterojunction between AgBr and AgVO3, which increased the separation of the photo-generated carriers. Moreover, it can be seen in Fig. 7(b) that most of the bacteria were killed, with anti-microbial rates of 99.99944%, 99.99930% and 99.99700% for E. coli, S. aureus and P. aeruginosa after 30 min by the photocatalysis of 0.5AgBr/AgVO3.Furthermore, compared to other reported antibacterial photocatalysts, such as BiOI/BiVO4,1 Cu2O28 and ZnO–Bi2O3,29 the 0.5 AgBr/AgVO3 composites showed better photocatalytic antibacterial activity, making it a potential photocatalyst in antibacterial area.
Stability and reusability
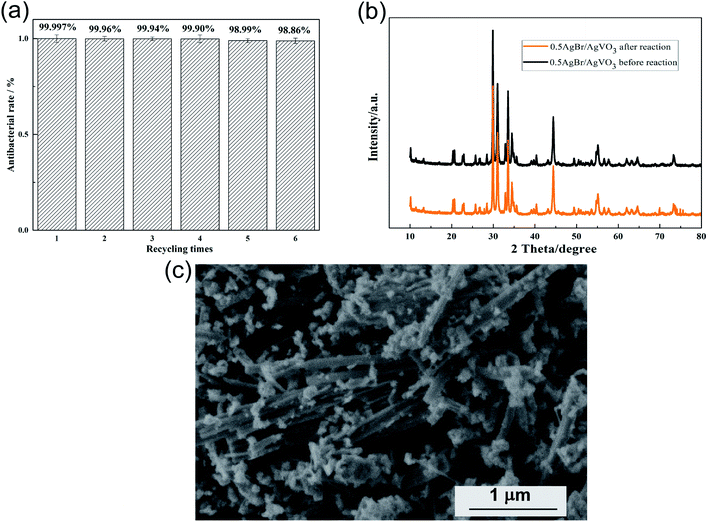
The stability and reusability of photocatalysts were important in practical application. Therefore, the antibacterial experiments of P. aeruginosa were repeated under visible light irradiation. After each circulation, the photocatalyst was collected by centrifugation, washed and dried for the next cycle. As shown in Fig. 8(a), after 6 cycles, the antibacterial rate of the 0.5AgBr/AgVO3 composites did not decrease significantly which suggested good stability of the photocatalyst. Fig. 8(b) showed the XRD pattern of 0.5AgBr/AgVO3 photocatalyst after 6 cycles. It can be seen that there was almost no change at all for the crystal phase and chemical composition of the photocatalyst after 6 cycles. Fig. 8(c) revealed the SEM image of the 0.5AgBr/AgVO3 photocatalyst after 6 runs, and there is no apparent change in morphology, indicating the good stability of 0.5AgBr/AgVO3.Photocatalytic mechanism
To further confirm the role of the free radical active species for the photocatalytic reaction, the free radical trapping experiments were measured. 2-Propanol (IPA) was used as an ·OH− scavenger, sodium oxalate (MSDS) as a h+ scavenger and 1,4-benzoquinone (BQ) as an ·O2− scavenger.1,7,8 As shown in Fig. 9, the degradation rate of RhB reached 92.3% after 150 min by the photocatalysis of 0.5AgBr/AgVO3 without any scavenger. With the addition of 1 mmol IPA, the degradation rate of RhB decreased slightly, suggesting that the ·OH− was not the primary radical species. However, when BQ and MSDS were added, the degradation rates of RhB were 52.6% and 43.2%, respectively, indicating the photocatalytic activity of AgBr/AgVO3 was significantly prohibited. These results suggested that the photocatalytic activity of AgBr/AgVO3 was primarily driven by ·O2− and h+.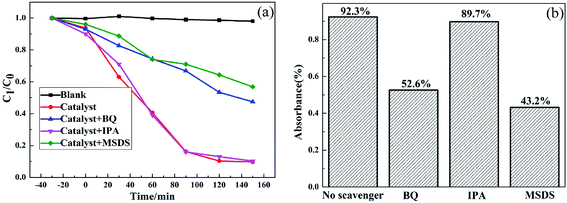 | ||
| Fig. 9 The active species trapping experiments for degradation of RhB with AgBr/AgVO3 photocatalyst under visible light irradiation. | ||
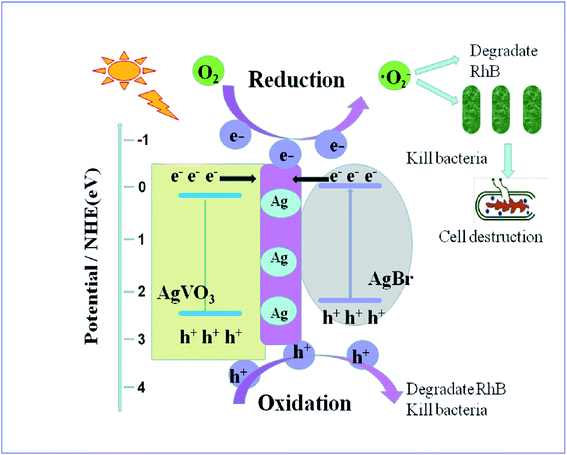
A possible reaction mechanism was illustrated in Fig. 10. As shown in previous research, silver ions had a bactericidal effect, but the metal silver (Ag0) which was generated by illumination of AgVO3 would contribute in the separation of electron–hole pairs.8 And plasmonic enhancements and facile charge transfer resulted from the assistance of metallic Ag, and the SPR effect of Ag nanoparticles played an important role in producing high photocatalytic activity for the oscillation of surface electron.30,31 At the same time, the conduction band (CB) electrons of noble metals can enhance the reducibility, which decreased the recombination opportunity of e− and h+.32 Additionally, the excellent conductivity of Ag nanoparticles greatly promoted interfacial charge-transfer kinetics among AgBr and AgVO3.
The CB of AgBr (−0.32 eV)19 was more cathodic than the standard redox potential of O2/·O2− (−0.046 eV vs. NHE),1,12 which exhibited a strong reductive ability and the valence band (VB) of AgVO3 (2.31 eV)8 had a better oxidation capability. AgBr (2.58 eV)18,19,24 and AgVO3 (2.03 eV)8 were matched in their band gap. The energy of visible light was sufficient to excite the VB electrons of AgVO3 and AgBr such that they ‘jumped’ into the CB.1,7 At the same time, the energy bands of the two semiconductors would be correspondingly bent and moved. Because of the excellent conductivity of Ag nanoparticles, light-induced electrons can be quickly transferred at the interface of the heterostructures, which avoided the recombination with the excited holes. At the same time, these electrons can be captured by oxygen to produce ·O2− which can attack the cell wall of bacterial,1 and kill the cell completely,7,8 revealing the efficient and environmentally friendly advantages of photocatalysis technology. Additionally, the remained holes can be directly oxidized by water to hydroxyl radicals, which played an important role in photocatalytic antibacterial area and water purification applications.
Conclusions
AgBr/AgVO3 photocatalysts were prepared via a hydrothermal process and in situ growth method, which were composed of rod-shaped AgVO3 and irregular granular AgBr. The photocatalytic experiments indicated that the 0.5AgBr/AgVO3 heterojunction photocatalyst exhibited enhanced photocatalytic activity and antibacterial efficiency, compared to pure AgBr, pure AgVO3 and other AgBr/AgVO3 composites under visible light irradiation. The degradation rate of RhB solution was 92.3% and more than 99.9970% of E. coli, S. aureus and P. aeruginosa cells were killed after 30 min by the photocatalysis of 0.5AgBr/AgVO3. Overall, the 0.5AgBr/AgVO3 heterojunction photocatalyst had excellent photocatalytic activity, stability, reusability and photocatalytic antibacterial performance, which suggested that it could be widely used in photocatalytic antibacterial area and water purification applications.Authors' contributions
JZ performed the data analysis and modified the manuscript, JW completed the test analysis of XPS and the specific surface area, HHX performed the synthesis and characterization of AgBr/AgVO3 films, JZD and BRH participated in the determination of synthetic schemes, YXZ and XZL participated in the characterization. And HHX supervised the conceptual framework and drafted the manuscript, JZ participated in modifying the manuscript. All authors read and approved the final manuscript.Availability of data and material
All datasets are presented in the main paper.Conflicts of interest
The authors declare that they have no competing interests.Abbreviations
| SEM | Scanning electron microscopy |
| TEM | Transmission electron microscopy |
| HRTEM | High resolution transmission electron microscopy |
| XRD | X-ray diffraction |
| BET | Brunauer–Emmett–Teller |
| XPS | X-ray photoelectron spectroscopy |
| UV-DRS | UV-visible diffuse reflectance spectra |
| RhB | Rhodamine B |
| IPA | iso-Propyl alcohol |
| BQ | Benzoquinone |
| MSDS | Sodium oxalate |
| VB | Valence band |
| CB | Conduction band |
Acknowledgements
This work is supported by the National Natural Science Foundation of China (Grant No. 41376003 and 41006054), the Strategic Priority Research Program of the Chinese Academy of Sciences, Grant No. XDA13040405, and the National Basic Research Program of China (2014CB643304).References
- Y. H. Xiang, P. Ju, Y. Wang, Y. Sun, D. Zhang and J. Q. Yu, Chem. Eng. J., 2016, 288, 264–275 CrossRef CAS
.
- B. K. Liu, X. L. Han, L. L. Mu, J. T. Zhang and H. Z. Shi, Mater. Lett., 2019, 253, 148–151 CrossRef CAS
.
- N. Liu, Q. Zhu, N. Zhang, C. Zhang, N. Kawazoe, G. P. Chen, N. Negishi and Y. N. Yang, Environ. Pollut., 2019, 247, 847–856 CrossRef CAS PubMed
.
- L. Gao, Z. H. Li and J. W. Liu, RSC Adv., 2017, 7, 27515–27521 RSC
.
- J. Podporska-Carroll, E. Panaitescu, B. Quilty, L. L. Wang, L. Menon and S. C. Pillaid, Appl. Catal., B, 2015, 176–177, 306–314 Search PubMed
.
- X. L. Qin, Y. Huang, K. Wang, T. T. Xu, S. P. Li, M. Zhao, Y. L. Wang and Q. Chen, Carbon, 2019, 152, 459–473 CrossRef CAS
.
- R. A. Senthil, M. Sun, J. Q. Pan, S. Osman, A. Khan and Y. Z. Sun, Opt. Mater., 2019, 92, 284–293 CrossRef CAS
.
- X. Zhang, J. Zhang, J. Q. Yu, Y. Zhang, Z. X. Cui, Y. Sun and B. R. Hou, Appl. Catal., B, 2018, 220, 57–66 CrossRef CAS
.
- W. Zhao, Y. Guo, Y. Faiz, W. T. Yuan, C. Sun, S. M. Wang, Y. H. Deng, Y. Zhuang, Y. Li, X. M. Wang, H. He and S. G. Yang, Appl. Catal., B, 2015, 163, 288–297 CrossRef CAS
.
- W. Zhao, J. H. Li, Z. B. Wei, S. M. Wang, H. He, C. Sun and S. G. Yang, Appl. Catal., B, 2015, 179, 9–20 CrossRef CAS
.
- Y. Y. Qin, H. Li, J. Lu, Y. S. Yan, Z. Y. Lu and X. L. Liu, Chin. J. Catal., 2018, 39, 1470–1483 CrossRef CAS
.
- L. Yin, Z. Fu, Y. Li, B. Liu, Z. Lin, J. Lu, X. Chen, X. Han, Y. Deng, W. Hu, D. Zou and C. Zhong, RSC Adv., 2019, 9, 4521–4529 RSC
.
- L. Cao, Mater. Lett., 2017, 188, 252–256 CrossRef CAS
.
- J. F. Chen, L. Dou, J. Z. Li, B. Chen, J. B. Zhong, J. J. He and R. Duan, Solid State Sci., 2019, 94, 106–113 CrossRef CAS
.
- X. Zhang, J. Zhang, J. Q. Yu, Y. Zhang, F. K. Yu, L. Jia, Y. L. Tan, Y. M. Zhu and B. R. Hou, J. Colloid Interface Sci., 2019, 533, 358–368 CrossRef CAS PubMed
.
- P. Mahsa and H. Aziz, J. Colloid Interface Sci., 2017, 491, 216–229 CrossRef PubMed
.
- Y. Bai, Q. Xu and Z. S. Cai, J. Mater. Sci.: Mater. Electron., 2018, 29, 17580–17590 CrossRef
.
- Y. J. Liu, F. Zhou, S. Zhan and Y. F. Yang, J. Inorg. Organomet. Polym., 2017, 27, 1365–1375 CrossRef CAS
.
- F. Guo, W. L. Shi, Y. Cai, S. W. Shao, T. Zhang, W. S. Guan, H. Huang and Y. Liu, RSC Adv., 2016, 6, 93887–93893 RSC
.
- L. L. Lai, W. Wen, B. Fu, X. Y. Qian, J. B. Liu and J. M. Wu, Mater. Des., 2016, 108, 581–589 CrossRef CAS
.
- S. Talebzadeh, F. Forato, B. Bujoli, S. A. Trammell, S. Grolleau, H. Pal, C. Queffélec and D. A. Knight, RSC Adv., 2018, 8, 42346–42352 RSC
.
- Q. E. Zhao, W. Wen, Y. Xia and J. M. Wu, J. Phys. Chem. Solids, 2019, 124, 192–198 CrossRef CAS
.
- Y. Xu, W. Wen and J. M. Wu, J. Hazard. Mater., 2018, 343, 285–297 CrossRef CAS PubMed
.
- X. Miao, Z. Y. Ji, J. J. Wu, X. Shen, J. Wang, L. Kong, M. Liu and C. Song, J. Colloid Interface Sci., 2017, 502, 24–32 CrossRef CAS PubMed
.
- Q. Jin, W. Wen, J. Q. Bai and J. M. Wu, Thin Solid Films, 2019, 683, 111–117 CrossRef CAS
.
- Y. D. Meng, Y. Z. Hong, C. Y. Huang and W. D. Shi, CrystEngComm, 2017, 19, 982–993 RSC
.
- S. Xue, Z. W. Wei, X. Y. Hou, W. H. Xie, S. Y. Li, X. N. Shang and D. Y. He, Appl. Surf. Sci., 2015, 355, 1107–1115 CrossRef CAS
.
- S. Mosleh, K. Dashtian, M. Ghaedi and M. Amiri, RSC Adv., 2019, 9, 30100–30111 RSC
.
- T. Jan, S. Azmat, B. Wahid, M. Adil, H. Alawadhi, Q. Mansoor, Z. Farooq, S. Z. Ilyas, I. Ahmad and M. Ismail, Mater. Sci. Semicond. Process., 2018, 84, 71–74 CrossRef CAS
.
- H. B. Zeng, W. P. Cai, P. S. Liu, X. X. Xu, H. J. Zhou, C. Klingshirn and H. Kalt, ACS Nano, 2008, 2, 1661–1670 CrossRef CAS PubMed
.
- C. Hu, Y. Q. Lan, J. H. Qu, X. X. Hu and A. M. Wang, J. Phys. Chem. B, 2006, 110, 4066–4072 CrossRef CAS PubMed
.
- L. J. Wang, X. W. Yan, C. L. Xu, Z. L. Xiao, L. M. Yang, B. Zhang and Q. Q. Wang, Analyst, 2011, 136, 1221–1229 Search PubMed
.
| This journal is © The Royal Society of Chemistry 2019 |

