 Open Access Article
Carbon nanoparticle-protected RNA aptasensor for amplified fluorescent determination of theophylline in serum based on nuclease-aided signal amplification
Xiaoyu Gongab,
Chi Yub,
Yichang Zhangb,
Yuan Sunb,
Lin Ye*c and
Juan Li *b
*b
aLonggang District People's Hospital of Shenzhen, Shenzhen, Guangdong 518172, P. R. China
bHubei Key Laboratory of Resources and Chemistry of Chinese Medicine, Hubei University of Chinese Medicine, Wuhan, Hubei 430065, P. R. China. E-mail: lz198207@126.com
cDepartment of General Surgery, Union Hospital, Tongji Medical College, Huazhong University of Science and Technology, Wuhan, Hubei 430022, P. R. China. E-mail: ylwhuhhust@hust.edu.cn
First published on 22nd October 2019
Abstract
A carbon nanoparticle (CNP) and Cryonase-aided method that realizes the amplified fluorescent detection of theophylline was proposed. The amplification technique exploits distinct binding affinities of CNP towards the FAM-labeled theophylline RNA aptamer (aptasensor) and aptasensor/theophylline complex as well as the protection effect of CNP for absorbed aptasensor from enzymatic digestion by Cryonase. Upon the addition of theophylline, it forms an aptasensor/theophylline complex with a fluorescent dye-tagged aptasensor that is initially absorbed and quenched by CNP. The nuclease activity of Cryonase towards detached aptasensor probes is then activated, leading to efficient cleavage of aptasensor probes and separation of the fluorescent dye from the CNP surface. Theophylline that has been liberated can launch another reaction cycle, which ensures the sensitivity enhancement. A detection limit is achieved as high as 6.3 nM, which is 400-fold better than traditional strategies. The proposed sensing system also provides desired selectivity even in serum samples. The assay is simple, sensitive, selective, and universal, and has great promise for the design and application of aptasensors in the biological, chemical, and biomedical fields.
1. Introduction
Theophylline is the most commonly used bronchodilator for the treatment of asthma, emphysema, and neonatal apnea.1,2 Theophylline has a narrow safety concentration range (20–100 μM), so the serum levels of users must be strictly and regularly controlled to avoid toxicity.3 Therefore, it is necessary to develop rapid, accurate, and sensitive methods for theophylline monitoring.Besides traditional methods such as radioimmunoassay,4 mass spectrometry,5 and liquid chromatography,6 innovative methods employing an anti-theophylline RNA aptamer (aptasensor) have been developed recently.7,8 Various schemes that can translate the structure changes of anti-theophylline aptasensor before and after binding with theophylline into optical or electrical output signals have been proposed.3,9–18 Unlike traditional methods, the aptasensor-based methods are instant, fast, washing-free, sensitive, and highly selective. Owing to these advantages, aptasensors have been widely applied in clinical settings.19–21
Unfortunately, practical problems still exist when aptasensors are used for theophylline detection. For example, the RNA aptamer is inherently chemically unstable.22,23 Moreover, the ubiquity of RNase makes RNA easily attacked and hydrolyzed in the environment.10,12 Consequently, extremely careful protocols must be carried out when using RNA aptasensor for detections.13,24 Meanwhile, in conventional RNA-aptamer detection schemes, one target triggers only one probe to switch on one signal probe, thereby limiting the sensitivity of aptasensor-based theophylline detection to the μM level and restricting its further application.25
In previous reported, scientists demonstrated that RNA adsorbed on carbon nanomaterials, such as graphene oxide and carbon nanotubes surface was protected from enzymatic hydrolysis by nucleases.13,26 Based on the protection effect and the different binding forces of carbon nanomaterials towards bound or unbound nucleic acid probes, a series of nuclease-aided cyclic enzymatic amplification methods for the detection of for a great variety of targets, including microRNA, theophylline, DNA, and Vascular Endothelial Growth Factor (VEGF) was proposed.27–30 However, being based on DNase I, this scheme is limited to DNA-probed targets. In contrast, the nuclease Cryonase indiscriminately hydrolyzes nucleic acids without distinction.13,31 To overcome the instability of the anti-theophylline RNA aptasensor, this study attaches RNA aptasensor to CNP and thereby proposes a Cryonase-aided signal-amplified approach for sensitive detection of theophylline. The assay can be completed within 0.5 h, the signal amplification strategy guarantees the high sensitivity and the employment of aptasensor ensures the detection selectivity and generality. Therefore, this method is robust, reliable, efficient, which may advance the developments of aptasensors.
2. Experimental section
2.1 Materials and reagents
Cryonase and aptasensor (5′-FAM-GGC GAU ACC AGC CGA AAG GCC CUU GGC AGC GUC-3′) were ordered from Takara Biotechnology Co. Ltd. (Dalian, China). Theophylline, caffeine, aminophylline, diprophylline, and xanthine were obtained from Xiya Reagent Co. Ltd. (Chengdu, China). Carbon nanoparticles (CNPs) were purchased from Beijing DK nano technology Co. Ltd (Beijing, China). The other reagents were purchased from Sigma-Aldrich (St. Louis, MO, USA). Fetal bovine serum was purchased from Thermo Fisher Scientific Corporation (Shanghai, China).2.2 Fluorescence measurement
Fluorescence measurements were tested on a Fluoromax-2 fluorometer (HORIBA Jobin Yvon Inc., Edison, NJ). The excitation and emission spectra were set at 490 and 520 nm respectively. All experiments were carried out in 20 mM Tris–HCl (pH 7.8) containing 5 mM MgCl2 and 50 mM NaCl. The test was performed in 200 μL reaction buffer containing 100 nM aptasensors, 20 U Cryonase, 0.06 mg mL−1 CNP, and different concentrations of theophylline at 37 °C for 0.5 h.2.3 Gel electrophoresis
Three tubes of 10 μM aptasensors in 10 μL reaction buffer were prepared. One of the tubes contained only aptasensors. The other two tubes before and after the incubation with 0.2 mg mL−1 CNP for half an hour (at room temperature) were followed by the introduction of 20 U Cryonase for another half an hour (at 37 °C). Afterwards, the samples were added 10 μL saturated urea to stop reaction. Next, a 15% denaturing polyacrylamide gel electrophoresis (PAGE) was prepared using 1 × TBE buffer (pH 8.3). The gel was run at 100 V for about 1 h in TBE buffer, after stained with Stains All solution, the result was recorded with a digital camera.2.4 Measurements in fetal bovine serum (FBS)
FBS was first diluted 10 times using the used buffer and treated with RNase inhibitor (1 U μL−1), the dilution of serum samples provided the required concentration of salt ions and pH environment. Then, the further measurements in serum samples were conducted with previous procedure.3. Results and discussion
3.1 Working mechanism
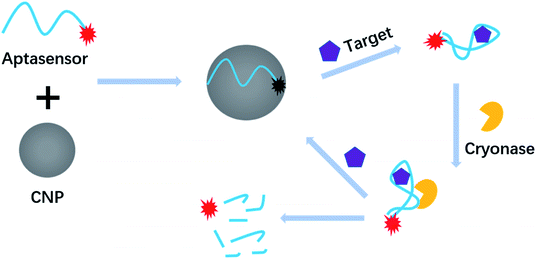
Fig. 1 shows the working principle of the new method. After the aptasensor is adsorbed onto the CNP, the FAM labelled-aptasensor was quenched. In the presence of the target, the aptasensor binds to theophylline and a secondary structure complex is formed and desorbs from the CNP. As a result, the desorbed aptasensor was digested by Cryonase, and the fluorophore becomes fluorescent and subsequently releasing the theophylline molecule to bind to another aptasensor to trigger a new round of cleavage. This cyclic hydrolysis reaction will continue until all aptasensors are digested and all fluorophores light up, as a result, a significant fluorescent signal amplification can be realized. In principle, a single theophylline molecule can trigger to complete digestion of all aptasensors and sensitive detection of theophylline thus can be achieved. | ||
| Fig. 1 Working principle of CNP-protected and Cryonase-aided signal amplification for theophylline assay. | ||
3.2 Feasibility analysis
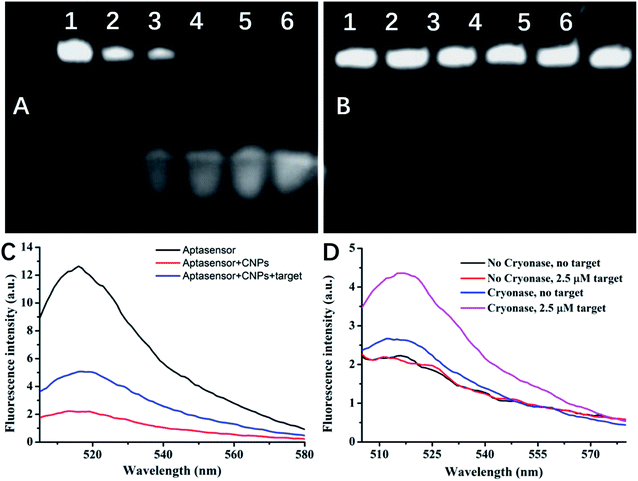
The protection effect of CNP on the RNA aptasensor was first tested by using Cryonase. As shown in Fig. 2A and B. PAGE experiments (Fig. 2A) revealed that in the absent of CNP, unprotected aptasensor was partially hydrolyzed after incubated with Cryonase for 10 min. After 30 min, the aptasensor band was invisible, demonstrating that it has been completely hydrolyzed by Cryonase. In contrast, even after incubation for 1 h at 37 °C, there was no detectable hydrolysis of the aptasensor incubated with CNP (Fig. 2B), confirming its excellent biostability.We next investigated the adsorption and desorption properties of the aptasensor on CNP by using fluorescence changes of the aptasensor before and after addition of CNP. As shown in Fig. 2C, in the absence of CNP, the aptasensor emitted strong fluorescence signal (black line). However, the CNP quenched the fluorescence emission (red line), indicating that the CNP exhibited high binding ability toward the aptasensor and effectively suppressed its fluorescence. The addition of 100 μM theophylline led to fluorescence restoration by 2.5-fold (blue line), suggesting that a complex formed between the aptasensor and theophylline kept far away from CNP surface, thus allow fluorescence recovery.
Then the amplified assay was test by first incubating the aptasensor with CNPs to form an aptasensor/CNPs complex (Fig. 2D, black line). We added theophylline and Cryonase orderly, and measured the fluorescence signal after 1 h incubation. The amplification strategy led to a obvious increase of the fluorescence signal in the presence of theophylline target (Fig. 2D, purple line). Although the hydrolysis of part of the aptasensors adsorbed on CNPs by Cryonase led to a slight increase in the background signal (blue line), the net signal produced by this strategy was significantly enhanced, a 2.5-fold signal increase was observed. In contrast, for the traditional 1![[thin space (1/6-em)]](https://www.rsc.org/images/entities/char_2009.gif) :
:![[thin space (1/6-em)]](https://www.rsc.org/images/entities/char_2009.gif) 1 detection strategy, no increase in the signal was observed (red line, in both cases, an theophylline concentration of 2.5 μM was used). The result demonstrated that the digestion of the aptasensors by Cryonase triggered a recycling reaction, and significantly realized the amplified fluorescence signal.
1 detection strategy, no increase in the signal was observed (red line, in both cases, an theophylline concentration of 2.5 μM was used). The result demonstrated that the digestion of the aptasensors by Cryonase triggered a recycling reaction, and significantly realized the amplified fluorescence signal.
3.3 Sensitivity and selectivity
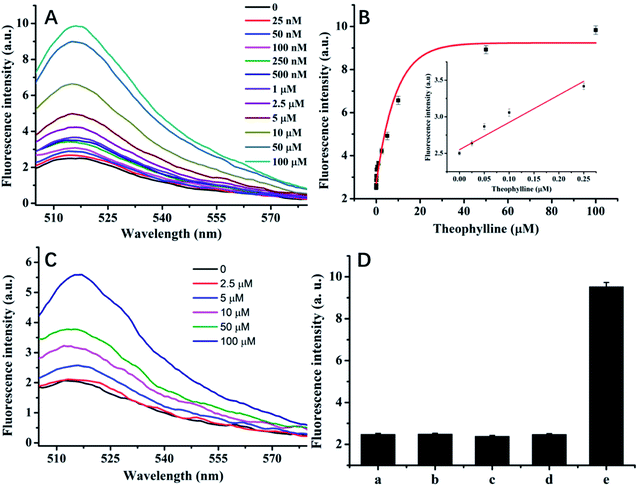
The results of theophylline detection via the cyclic release of aptasensor are shown in Fig. 3. Fig. 3A shows the fluorescence spectrum of theophylline of different concentrations, in which the fluorescence signal gradually increases with the increase of theophylline concentration from 25 nM to 0.1 mM. Fig. 3B shows the standard curve established by theophylline of different concentrations and the fluorescence intensity, the fluorescence intensity shows a good linearity within the range of 25 nM to 2.5 μM. Based on 3 times standard deviation of 6 measurements of blank samples, the detection limit was calculated as 6.3 nM, which is competitive with many reports,15,16,31,32 as compared in Table 1, and verify that our method represents a significant advance in theophylline assay. We also examined the results in the absence of Cryonase. As shown in Fig. 3C, 2.5 μM of theophylline triggered a weak signal change in the probe system and the fluorescence signal increased with the theophylline concentration from 2.5 μM to 100 μM. This method enabled the detection of 2.5 μM of theophylline. In comparison, it is proven that the signal amplification scheme can improve detection sensitivity by three orders of magnitude.| Materials used | Signal output | Detection limit | Ref. |
|---|---|---|---|
| Aptazymes gold nanoparticles | Colorimetry | 1 μM | 33 |
| Self-assembling RNA aptamer graphene oxide | Fluorescence | 155 nM | 16 |
| PCR and in vitro transcription | Fluorescence | 100 nM | 10 |
| RNA ribozyme, DNase I, graphene oxide | Fluorescence | 100 nM | 14 |
| Ligand-independent exponential amplification | Fluorescence | 92 nM | 34 |
| Aptasensor and gold nanoparticles | Electrochemistry | 70 nM | 35 |
| Graphene oxide and Cryonase | Fluorescence | 47 nM | 31 |
| Self-assembling RNA aptamer, graphene oxide | Fluorescence | 50 nM | 15 |
| CNPs and Cryonase | Fluorescence | 6.3 nM | This work |
Because of the inherent affinity of aptamer,8 the aptasensor has highly selectivity. We investigated the selectivity by comparing the signal intensity of theophylline, caffeine, aminophylline, diprophylline, and xanthine after adding to the solution at a final concentration of 0.1 mM respectively. The results are shown in Fig. 3D, caffeine has similar structure with theophylline, but it does not show an obvious enhancement in the fluorescence signal, suggesting that the method has good selectivity.
3.4 Direct detection of theophylline in real samples
Under ideal laboratory conditions, this method can deliver highly sensitive and selective theophylline detection. However, the further application challenge is to tolerate any interference from complex biological samples. To demonstrate its effects in practice, we applied the theophylline detection method to real samples. Different concentrations of theophylline were spiked into 10% fetal bovine serum (FBS) for recovery tests. As shown in Table 2, the experimental results reveal that the recoveries for theophylline are distributed between 94% and 110%, suggesting the proposed method can be a promising convenient strategy for theophylline detection in real samples.| Sample | Added (nM) | Founded (nM) | Recovery (%) |
|---|---|---|---|
| 1 | 30 | 33 ± 1.25 | 110 |
| 2 | 50 | 53 ± 1.38 | 106 |
| 3 | 100 | 94 ± 1.61 | 94 |
| 4 | 500 | 486 ± 3.7 | 97.2 |
| 5 | 1000 | 1090 ± 8.4 | 109 |
4. Conclusions
We have developed an theophylline detection method which employs signal amplification to achieve 6.7 nM theophylline detection, three orders of magnitude higher than that of traditional schemes, and can be directly used for theophylline detection in complex biological systems. It has a simple design and good versatility, and is expected to be extended to cover the detection of other small molecules.Conflicts of interest
There are no conflicts to declare.Acknowledgements
This study was supported by the Scientific Research Foundation Project of the Education Department of Hubei Province (Q20172009), Natural Science Foundation of Hubei Province (2017CFB397), and the Opening Foundation of Key Laboratory of Ministry of Education on Traditional Chinese Medicine Resource and Compound Prescription.References
- S. Adimoolam, J. Assoc. Acad. Minor. Phys., 1991, 2, 123–126 CAS.
- S. P. Newman, Adv. Drug Delivery Rev., 2018, 133, 5–18 CrossRef CAS.
- E. E. Ferapontova, E. M. Olsen and K. V. Gothelf, J. Am. Chem. Soc., 2008, 130, 4256–4258 CrossRef CAS.
- A. Castro and B. Steele, Clin. Biochem., 1983, 16, 281–284 CrossRef CAS PubMed.
- M. Culea, N. Paiibroda, M. Chiriac and Z. Moldovan, Biomed. Environ. Mass Spectrom., 1990, 19, 360–362 Search PubMed.
- B. Srdjenovic, V. Djordjevic-Milic, N. Grujic, R. Injac and Z. Lepojevic, J. Chromatogr. Sci., 2008, 46, 144–149 CAS.
- R. D. Jenison, S. C. Gill, A. Pardi and B. Polisky, Science, 1994, 263, 1425–1429 CrossRef CAS.
- G. R. Zimmermann, R. D. Jenison, C. L. Wick, J. P. Simorre and A. Pardi, Nat. Struct. Biol., 1997, 4, 644–649 CrossRef CAS.
- J. L. Chavez, W. Lyon, N. Kelley-Loughnane and M. O. Stone, Biosens. Bioelectron., 2010, 26, 23–28 CrossRef CAS.
- P. S. Lau, B. K. Coombes and Y. Li, Angew. Chem., 2010, 49, 7938–7942 CrossRef CAS.
- G. C. Zhao and X. Yang, Electrochem. Commun., 2010, 12, 300–302 CrossRef CAS.
- C. Carrasquilla, P. S. Lau, Y. F. Li and J. D. Brennan, J. Am. Chem. Soc., 2012, 134, 10998–11005 CrossRef CAS.
- L. Cui, Z. R. Chen, Z. Zhu, X. Y. Lin, X. Chen and C. J. Yang, Anal. Chem., 2013, 85, 2269–2275 CrossRef CAS.
- X. Li, J. Song, Y. Wang and T. Cheng, Anal. Chim. Acta, 2013, 797, 95–101 CrossRef CAS PubMed.
- H. Y. Jiang, K. Ling, X. J. Tao and Q. Q. Zhang, Biosens. Bioelectron., 2015, 70, 299–303 CrossRef CAS PubMed.
- K. Ling, H. Jiang, Y. Li, X. Tao, C. Qiu and F. R. Li, Biosens. Bioelectron., 2016, 86, 8–13 CrossRef CAS.
- S. Feng, C. Chen, W. Wang and L. Que, Biosens. Bioelectron., 2018, 105, 36–41 CrossRef CAS.
- J. Wang, W. Cheng, F. Meng, M. Yang, Y. Pan and P. Miao, Biosens. Bioelectron., 2018, 101, 153–158 CrossRef CAS.
- C. Feng, S. Dai and L. Wang, Biosens. Bioelectron., 2014, 59, 64–74 CrossRef CAS.
- X. Xia, H. Wang, H. Yang, S. Deng, R. Deng, Y. Dong and Q. He, J. Agric. Food Chem., 2018, 66, 12431–12438 CrossRef CAS.
- X. H. Xia, Y. X. Wang, H. Yang, Y. Dong, K. X. Zhang, Y. H. Lu, R. J. Deng and Q. He, Food Chem., 2019, 283, 32–38 CrossRef CAS.
- M. Oivanen, S. Kuusela and H. Lonnberg, Chem. Rev., 1998, 98, 961–990 CrossRef CAS.
- L. Cui, R. Peng, T. Fu, X. Zhang, C. Wu, H. Chen, H. Liang, C. J. Yang and W. Tan, Anal. Chem., 2016, 88, 1850–1855 CrossRef CAS.
- P. S. Lau, C. K. Lai and Y. Li, ChemBioChem, 2013, 14, 987–992 CrossRef CAS.
- J. Liu, Z. Cao and Y. Lu, Chem. Rev., 2009, 109, 1948–1998 CrossRef CAS PubMed.
- Y. Wu, J. A. Phillips, H. Liu, R. Yang and W. Tan, ACS Nano, 2008, 2, 2023–2028 CrossRef CAS.
- Z. D. Liu, P. P. Hu, H. X. Zhao, Y. F. Li and C. Z. Huang, Anal. Chim. Acta, 2011, 706, 171–175 CrossRef CAS.
- L. Cui, X. Lin, N. Lin, Y. Song, Z. Zhu, X. Chen and C. J. Yang, Chem. Commun., 2012, 194–196 RSC.
- Y. Xie, X. Lin, Y. Huang, R. Pan, Z. Zhu, L. Zhou and C. J. Yang, Chem. Commun., 2015, 2156–2158 RSC.
- S. X. Wang, K. S. Liu, Y. F. Lou, S. Q. Wang, Y. B. Peng, J. P. Chen, J. H. Huang, S. X. Xie, L. Cui and X. Wang, Microchim. Acta, 2018, 185, 375 CrossRef.
- Y. F. Lou, Y. B. Peng, X. Luo, Z. Yang, R. Wang, D. Sun, L. Li, Y. Tan, J. Huang and L. Cui, Microchim. Acta, 2019, 186, 494 CrossRef.
- X. Ma, Z. Guo, Z. Mao, Y. Tang and P. Miao, Microchim. Acta, 2017, 185, 33 CrossRef.
- A. Ogawa and M. Maeda, Bioorg. Med. Chem. Lett., 2008, 18, 6517–6520 CrossRef CAS.
- B. J. Lam and G. F. Joyce, J. Am. Chem. Soc., 2011, 133, 3191–3197 CrossRef CAS.
- X. Chen, Z. Guo, Y. Tang, Y. Shen and P. Miao, Anal. Chim. Acta, 2018, 999, 54–59 CrossRef CAS.
| This journal is © The Royal Society of Chemistry 2019 |


