
 Open Access Article
 This Open Access Article is licensed under a Creative Commons Attribution-Non Commercial 3.0 Unported Licence
Synthesis of high surface area porous carbon from anaerobic digestate and it's electrochemical study as an electrode material for ultracapacitors†
Vikash Chaturvediab,
Saurabh Usangonvkarc and
Manjusha V. Shelke *ab
*ab
aPhysical and Materials Chemistry Division, CSIR-National Chemical Laboratory, Pune-411008, MH, India. E-mail: mv.shelke@ncl.res.in
bAcademy of Scientific and Innovative Research (AcSIR), Ghaziabad-201002, UP, India
cPolymer Science and Engineering Division, CSIR-National Chemical Laboratory, Pune-411008, MH, India
First published on 8th November 2019
Abstract
The remnants of the anaerobic digestion process, ‘the digestate,’ mainly consist of fibrous lignin and cellulose like molecules, as a significant carbon repository along with some other inorganic impurities. The present work demonstrates the potential use of anaerobically treated fruit and vegetable waste (FVW) as a source of porous carbon for supercapacitor electrode materials. This work suggests that the FVW digestate can inherit silicon (Si) and calcium (Ca) based inorganic impurities, which play an essential role as structure directing agents for digestate derived carbon. These contaminants act as hard templates during carbonization to create hierarchical pores and contribute to an enhancement in surface area. Different batches from an anaerobic biogas digester plant are converted to porous carbon and examined as a potential supercapacitor electrode material. A maximum capacitance of 235 F g−1 is achieved from DDHPC-4kh carbon with a specific surface area of 2502 m2 g−1 at a current density of 1 A g−1 in an acidic aqueous electrolyte. The results are significant in comparison to other bio-sourced precursors studied previously.
Introduction
Renewable energy sources are comparatively cheaper and cleaner than conventional fossil fuel, petroleum, and coal. However, most of the established sources, energy generation, and utilization techniques are not necessarily concomitant. Therefore, a significant challenge associated with accessing renewable energy is to develop cost-efficient energy storage mechanisms for an extended lifetime. Recently, the supercapacitor has captured great attention as an electrochemical energy storage device which stores relatively more charge with lower internal resistance as compared to conventional capacitors. High power density supercapacitors can also be integrated as a complementary system with batteries, possessing high energy density. Supercapacitors, also known as ultracapacitors,1–5 can be categorized mainly in two types called as electrical double layer capacitor (EDLC) and pseudocapacitor. The charge storage mechanism in EDLC is a nonfaradaic process, and electrostatic charges are stored in an oppositely charged double layer at the electrode–electrolyte interface. A pseudocapacitor electrode may consist of metal oxide or conducting polymer electrodes possessing the ability to undergo fast and reversible redox reactions and intercalation of electrolyte ions. EDLC have higher capacitance as compared to conventional capacitors, lesser capacitances than pseudocapacitor but longer and stable life cycle. The hybrid capacitor is a combination of both EDLC and pseudocapacitor, constructed in a way to achieve both, significant stability and higher capacitance.6 Different types of carbon materials, such as activated carbons (ACs), graphitic carbons, carbide-derived carbons, carbon fabrics (CFs), carbon nanotubes (CNTs), etc. have been widely used as electrode materials for EDLC owing their unique physicochemical properties.7–11 High specific surface area, excellent thermal stability, superior conductivity, resistance to corrosion, and porous morphology makes these carbons as suitable electrode material for electrochemical energy storage application. Furthermore, these carbon materials are compatible to make composites easily with other materials, relatively low cost with high cyclic stability makes it widely accessible for commercial applications.12–15 The surface area of the carbon materials plays a crucial role in charge storage; therefore, increasing the specific surface area (SSA) via a network of mesopores and micropores is desirable. However, in the case of porous carbons having adequate pore size distribution is also equally important. Potassium hydroxide (KOH) activation is an efficient way for generating micropores and mesopores into the framework of structured carbons, such as carbon foams (CFs), carbon nanofibers (CNFs), carbon nanotubes (CNTs), carbon aerogels (CAs), and charcoal.16,17 Utilization of nanostructured templates is one of the useful ways for mesopore and micropore creation in carbon networks. Homogeneous nanosized silica and zeolite like materials are frequently used as hard templates in a mixture with a carbon precursor which after carbonation, are removed with acid or base treatment leaving pores behind.18–21 Different polymers and block copolymers have been reported as soft templates.22–25 By employing different activation methods, so many cost-effective and readily available biowastes are converted into porous activated carbon, and Table S1 in the ESI† outlined some of the similar porous carbons derived from bio-waste and used as electrode material for EDLC applications.26–32The high surface area in carbon nanochannels (1260 m2 g−1) were achieved recently by hydrothermal preprocessing of sugarcane bagasse and further pyrolysis, yielding capacitance of 280 F g−1 at a current density of 1 A g−1.32 Coconut waste was transformed into porous carbon nano-spheres using pyrolysis exhibiting a specific capacitance of 236 F g−1 at 2 mV s−1 and having a specific surface area of 3000 m2 g−1.33 Similarly; abundant industrial wastes offer an inexpensive and renewable route for generating high-quality carbon for the purposes mentioned above. Supercapacitors materials (carbon) are obtained from sugar and distillery industry waste and found to have a high surface area (730–900 m2 g−1) with specific capacitance as high as 120 F g−1 in aqueous KOH electrolyte at an input current density of 1 A g−1.34
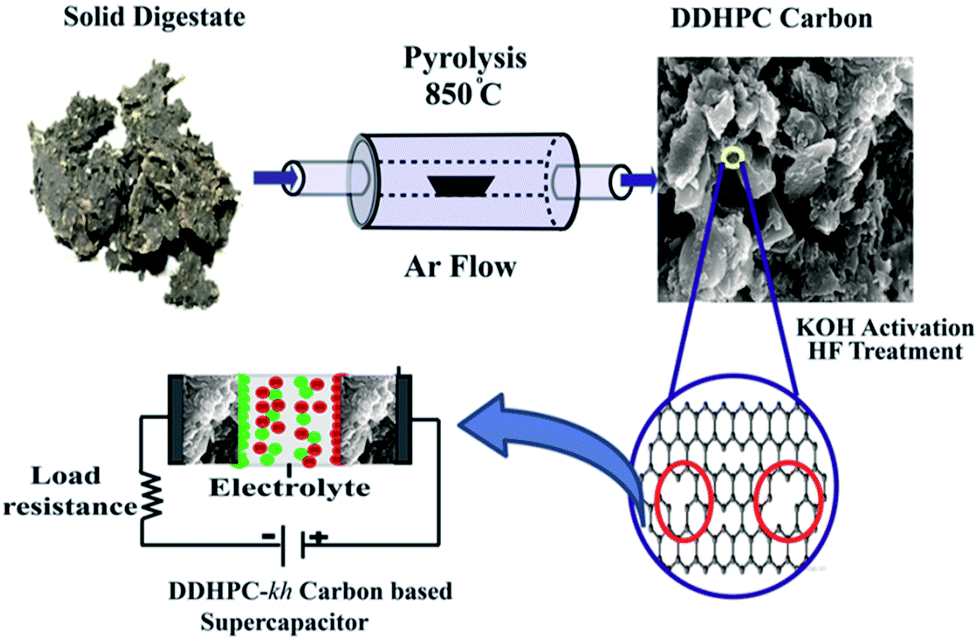 | ||
| Scheme 1 Schematic diagram for the synthesis of DDHPC-kh carbon from anaerobic digestate. | ||
Another potential source of carbon, originates from domestic/industrial wastewater treatment, is anaerobically treated digestate. Anaerobic digestion is the process of converting organic feedstock into biogas (such as methane), which can serve as an alternative for fossil fuels, by reducing the number of greenhouse gases.35 Fibrous, liquor or sludge-based combination of two fractions may be the primary output depending on the type of digester and the stage at which the digestate is extracted. Anaerobic treatment of bio-waste comprises a four-step process commonly known as hydrolysis, acidogenesis, acetogenesis, and methanogenesis. Digestate generated after acidogenesis and methanogenesis are known as ‘Acidogenic’ and ‘Methanogenic’ respectively, having different compositional and structural nature. Generally, digestate is composed of smaller chains of oligosaccharides, fibers, lignin, cellulose, and hemicellulose; hence, it could serve as a valuable carbon source.36 Fruits and vegetable waste (FVW) make up a significant chunk of waste from industries as well as domestic waste. FVW is known to have a substantial amount of total solids (TS) and favorable TS to volatile solids (VS) ratio.37–39 It is reported that the total solid content (TS) and volatile content (VS) remains between 10–17% and 50–60%, respectively.40,41
The presented research work deals with the production of highly porous carbon from industrial/domestic FVW derived digestate. Different batches of the anaerobic digestate were converted to porous carbon. Furthermore, thus produced carbon samples were processed to enhance the surface area and impurities removal. Highly porous carbon samples were tested as a potential EDLC electrode material for electrochemical energy storage.
Experimental section
Materials
Potassium hydroxide pellets (KOH), hydrochloric acid (HCl) and hydrofluoric acid (HF) were purchased from Bruker India Scientific Private Limited. Conducting carbon (carbon black-99.99%), polyvinylidene fluoride (PVDF) and N-methyl-2-pyrrolidone were purchased from Sigma Aldrich and used for electrode preparation. Digestate precursor was received from an anaerobic biogas digester established by Syngenta India Limited in the village of Corlim, Goa, India.Materials preparation
Digestate collected in four different batches were used as a carbon source for the pyrolysis at elevated temperature in inert (Argon flow) environment. Carbonization was carried initially at 400 °C (ramping at 3 °C min−1 up to 400 °C) for 1 hour, and then at 850 °C (ramping rate of 5 °C min−1 up to 850 °C) for 3.5 hours (Scheme 1). The carbon samples prepared from the four different batches were named as DDHPC-1, DDHPC-2, DDHPC-3, and DDHPC-4, respectively. It is essential to highlight that, out of these four digestate source precursor, two (DDHPC-1, DDHPC-2) were collected from settled digestate at the bottom of the wastewater outlet of the digester. The other two (DDHPC-3, DDHPC-4) were obtained from the floating portion of digestate (after centrifugation in water stream).After carbonization, all four DDHPC samples were activated by KOH treatment (in 3![[thin space (1/6-em)]](https://www.rsc.org/images/entities/char_2009.gif) :1, KOH to carbon ratio) at 850 °C for 1 hour. Excess KOH was neutralized with a mild (1 M) HCl solution. All the samples were treated with the hydrofluoric acid (HF) for removal of any inherited silica and other inorganic impurities in the samples. The samples prepared after KOH activation and HF treatment are named as DDHPC-1kh, DDHPC-2kh, DDHPC-3kh, and DDHPC-4kh, respectively. kh represents the processing steps of KOH activation and HF treatment. Electrochemical behavior of DDHPC-4kh sample has been investigated in detail including different treatments steps and accordingly named as DDHPC-4 (after carbonization of as received digestate), DDHPC-4k (after KOH activation of DDHPC-4) and DDHPC-4kh after HF treatment of DDHPC-4k.
:1, KOH to carbon ratio) at 850 °C for 1 hour. Excess KOH was neutralized with a mild (1 M) HCl solution. All the samples were treated with the hydrofluoric acid (HF) for removal of any inherited silica and other inorganic impurities in the samples. The samples prepared after KOH activation and HF treatment are named as DDHPC-1kh, DDHPC-2kh, DDHPC-3kh, and DDHPC-4kh, respectively. kh represents the processing steps of KOH activation and HF treatment. Electrochemical behavior of DDHPC-4kh sample has been investigated in detail including different treatments steps and accordingly named as DDHPC-4 (after carbonization of as received digestate), DDHPC-4k (after KOH activation of DDHPC-4) and DDHPC-4kh after HF treatment of DDHPC-4k.
Characterizations
Powder X-ray diffraction (PXRD) was performed using a Philips X'Pert PRO diffractometer for the structural and compositional study of DDHPC-kh samples. Raman spectroscopic analysis was conducted to understand the graphitic nature of the synthesized carbon samples. Raman spectra were recorded in a continuous scanning mode on an HR 800 Raman spectrometer (Jobin–Yvon, Horiba, France). Thermo Gravimetric Analysis (TGA) was carried out on as-received digestate precursors to study the thermal decomposition profile between temperature range 50–900 °C with a ramp rate of 10 °C min−1 in nitrogen (N2) flow. Surface elementals of DDHPC-kh samples were analyzed using X-ray Photoelectron Spectroscopy (XPS). For morphological characterization, Scanning Electron Microscopy (SEM) was carried out for all the samples by using FEI, Nova Nano SEM 450. Transmission Electron Microscopy (TEM) images were recorded to investigate the morphology and nanostructure of the obtained porous carbon by FEI, Tecnai F30, FEG system. Brunauer–Emmett–Teller (BET) technique was used by carrying out N2 adsorption on the sample surface to determine the surface area and pore size distribution, using quantachrom BET surface analyzer.Electrochemical measurements
The electrochemical performances were investigated by using SP-300 multichannel electrochemical workstation (Biologic Science Instruments). A standard protocol was followed for coating of active material over the substrate to fabricate the supercapacitor electrodes. In the process, 80 wt% of the testing sample was mixed with 15 wt% conducting carbon and 5 wt% polyvinylidene difluoride (PVDF) binder. Few drops of N-methyl-2-pyrrolidone (NMP) solvent was added to the above mixture and ground thoroughly into a viscous slurry. This slurry was coated uniformly on the Toray carbon paper. After coating, the electrodes were dried in a vacuum oven at 100 °C for 24 hours and used for electrochemical testing. All electrochemical studies were performed using 1 M H2SO4 solution as an electrolyte within the voltage range 0 to 1 V. The electrochemical measurements were carried out in two-electrode system by applying cyclic voltammetry (CV), galvanostatic charge–discharge (GCD) and electrochemical impedance spectroscopy (EIS) methods. The reported specific capacitance of the electrode materials is calculated from the galvanostatic charge–discharge curve by using the following equation;| C = 2I/{m × (dv/dt)} |
Results and discussion
Morphology and structural characterization
PXRD analysis was performed to determine the crystalline/graphitic nature of the as-prepared four different DDHPC-kh samples, and the corresponding diffraction patterns were shown in Fig. 1a. The diffraction patterns of all the samples are showing the broad peaks centered around 2 theta angle of 26°, corresponding to the (002) plane, as well as at around 43°, corresponding to the (100) plane indicating the presence of disordered graphitic domains in largely amorphous carbon. Additional impurity peaks are also observed in the XRD of (DDHPC-1kh & DDHPC-2kh) and (DDHPC-3kh & DDHPC-4kh) samples collected from different portions of the digestate, revealing presence of different types of impurities in the settled digestate and floating digestate. These impurity peaks at 17.6°, 22.9°, 24.8° of 2θ are quite significant in DDHPC-1kh and DDHPC-2kh and represent the presence of methanogenic digestate (sluggish) impurities which may be due to a combination of clay components, remnant of nutrients and minerals.42 Peaks for DDHPC-1kh and 2kh, centered at around 17.6° and 24.8° of 2θ can be assigned for layered silicates and orthosilicate impurities such as illite, which is a principal constituent of natural clay. While the peak centered at around 26.6° of 2θ can be attributed to the presence of crystalline silica or quartz.43,44 PXRD data confirms that acid treatment alone is not sufficient to completely remove Si-based impurities which are still present probably in the form of silicates and crystalline quartz in DDHPC-1kh and DDHPC-2kh. Peak around 35.4° of 2θ indicates the presence of iron-based metal oxide impurities in DDHPC-1kh and DDHPC-2kh. From the diffraction patterns of DDHPC-3kh and DDHPC-4kh, it can be noticed that the clay content has drastically decreased. However, probable presence of calcium can be interpreted from the poorly resolved peak appeared at around 28.3° of 2θ. Calcium is an essential element for plants which during the anaerobic treatment, is converted into metastable carbonate vaterite and further on carbonization at higher temperature again converted to more stable form i.e. calcite.45–47 A sharp peak appears at 44.4°of 2θ in the diffraction pattern of DDHPC-3kh and DDHPC-4kh, most probably represents the presence of iron-based impurities which may be consist of metallic iron (α-iron) and iron carbide (or Fe3C).48 So, the digestate settled at the bottom have a higher presence of elemental earth-constituents, which are difficult to remove by acid (cold/warm) treatment as observed for DDHPC-1kh and DDHPC-2kh.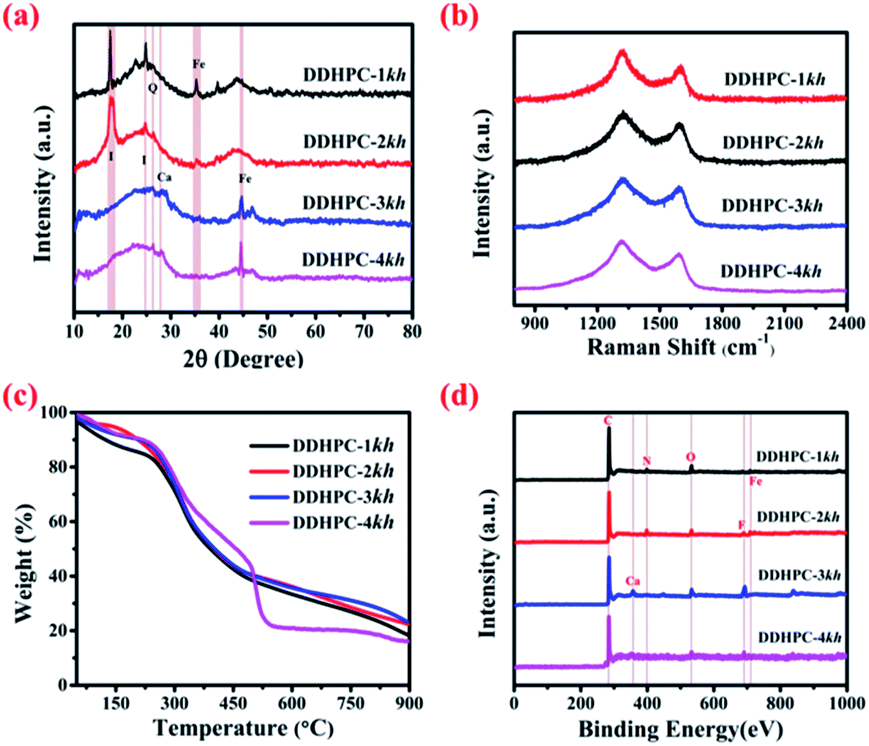 | ||
| Fig. 1 (a) X-ray diffraction pattern, (b) Raman spectrum (c) thermo gravimetric analysis and (d) XPS survey scan for DDHPC-1kh, DDHPC-2kh, DDHPC-3kh and DDHPC-4kh derived from FVW digestate. | ||
Raman spectral analysis was performed to confirm the presence of the graphitic nature in all DDHPC samples, and the Raman spectra of all the samples are shown in Fig. 1b. All the samples were showing the presence of two major peaks at around 1330 cm−1 and 1590 cm−1. Former peak, which is at around 1330 cm−1 is associated with structural defects (D band) whereas later, which is at around 1590 cm−1, is due to graphitic structures (G band), appears due to first-order scattering of the stretching vibration mode E2g. The ratio of the intensity of these two bands, i.e., the ID/IG ratio is an important parameter to understand the amount of graphitization in carbon materials.
In this case, Raman spectrum of all four DDHPC-kh samples was fitted by using Gaussian function and ID/IG was calculated which is 1.26, 1.47, 1.27 and 1.30 for DDHPC-1kh, DDHPC-2kh, DDHPC-3kh, and DDHPC-4kh respectively. All shown Raman spectra can be attributed to the typical activated carbon. This can be confirmed from the partial deviation from the Gaussian fit at low wavenumber of the broad D band (1330 cm−1). This has been reported as impurity band (I band) due to other ionic impurities in the carbon framework.49 These results indicate that the level of the defect and degree of graphitization varies with the variation in batch processing of the digester plant. Thermogravimetric analysis (TGA) of as received digestate precursor was carried out in the nitrogen atmosphere, and results are shown in Fig. 1c. TGA curves depict the weight loss in three significant temperature segments between 50–250 °C, 250–500 °C, and 500–900 °C for all DDHPC-kh samples. Initial weight loss below 250 °C is observed probably due to evaporation of adsorbed gases, volatile solids, and the water molecules. Decomposition of organic content such as undigested lignin and hemicellulose along with other impurities takes place in the second segment between 250–500 °C. Decomposition curve of three digestate samples exhibits almost similar decomposition behavior for DDHPC-1kh, DDHPC-2kh, and DDHPC-3kh with slight variation for DDHPC-4kh signifying steeper weight loss probably due to higher hemicellulose content.50 In the third segment, above 500 °C, DDHPC-4kh exhibits excellent thermal stability with negligible weight loss, but the total yield is lowest as compared to all other digestate samples. Mass retention of 18.2%, 22.5%, 23.3%, and 16.1% was observed for DDHPC-1kh, DDHPC-2kh, and DDHPC-3kh and DDHPC-4kh respectively at 900 °C.
The survey scan spectra obtained from X-ray photoelectron spectroscopy (XPS) studies of DDHPC-kh carbons are shown in Fig. 1d. The survey scan confirms the elemental presence of carbon, oxygen, and iron in the all four DDHPC-kh samples with sharp peaks corresponding to the binding energy (B.E.) of C 1s, O 1s, and Fe 2p core levels. In DDHPC-1kh and DDHPC-2kh presence of N 1s peak can be observed additionally, which has no significant presence in the DDHPC-3kh and DDHPC-4kh. Presence of elemental fluorine (F 1s, B.E. 684 eV) and elemental calcium (Ca 2p3/2, B.E. 347.2 eV) has also been confirmed in various DDHPC-kh samples as indicated in Fig. 1d. The deconvoluted spectra of C 1s and O 1s peaks (ESI Fig. S1 and S2†) give better insight about the compositional nature of carbonaceous material. Deconvolution of C 1s peaks (ESI Fig. S1†) represents the combined presence of sp2 and sp3 (B.E. at around 284.54 to 284.58 eV) hybridized carbon in all DDHPC-kh samples. Along with C–C and C![[double bond, length as m-dash]](https://www.rsc.org/images/entities/char_e001.gif) C bonds, carbon is bonded mainly with other heteroatoms such as oxygen, nitrogen, and fluorine during the carbonization. Alcohol and amine functional groups (C–O and C–N, B.E. at around 285.67–286.14 eV) are most likely present in all the four carbon samples. A combined presence of, carbonyl groups (CO B.E. at around 287.1–288 eV), carboxylic groups (O–CO B.E. at around 288.6–289.8 eV), and fluorinated polymeric carbon (B.E. at around 290.3–291.4 eV) is observed in all DDHPC-kh samples with a slight compositional variation. Satellite peaks are present for the DDHPC-1kh and DDHPC-4kh at around B.E. of 292.5 & 293.1 eV, respectively.51–54 O 1s peaks (ESI Fig. S2†) can be deconvoluted to signify the presence of CO (531.2–531.6 eV) and C–O (B.E. at 532.8–533.2 eV). Water and air absorbed by the surface of carbonaceous materials are contributing to the peaks corresponding to the B.E. of 534–535.2 eV.55 Satellite peaks, at B.E. of 538.2 & 538.4 eV, are observed corresponding to O 1s core level, for the DDHPC-1kh and DDHPC-4kh respectively.
C bonds, carbon is bonded mainly with other heteroatoms such as oxygen, nitrogen, and fluorine during the carbonization. Alcohol and amine functional groups (C–O and C–N, B.E. at around 285.67–286.14 eV) are most likely present in all the four carbon samples. A combined presence of, carbonyl groups (CO B.E. at around 287.1–288 eV), carboxylic groups (O–CO B.E. at around 288.6–289.8 eV), and fluorinated polymeric carbon (B.E. at around 290.3–291.4 eV) is observed in all DDHPC-kh samples with a slight compositional variation. Satellite peaks are present for the DDHPC-1kh and DDHPC-4kh at around B.E. of 292.5 & 293.1 eV, respectively.51–54 O 1s peaks (ESI Fig. S2†) can be deconvoluted to signify the presence of CO (531.2–531.6 eV) and C–O (B.E. at 532.8–533.2 eV). Water and air absorbed by the surface of carbonaceous materials are contributing to the peaks corresponding to the B.E. of 534–535.2 eV.55 Satellite peaks, at B.E. of 538.2 & 538.4 eV, are observed corresponding to O 1s core level, for the DDHPC-1kh and DDHPC-4kh respectively.
The specific surface area (SSA) and porosity properties of all the DDHPC-kh samples were investigated by using the BET measurements and the corresponding plots are shown in the figures. Fig. 2a represents the adsorption isotherms obtained from the BET measurements, and all four samples are showing the typical type I and type IV behavior. The SSA was approximated by using the multipoint BET (MPBET) and found 1095 m2 g−1, 1216 m2 g−1, 2204 m2 g−1, and 2502 m2 g−1 for DDHPC-1kh, DDHPC-2kh, DDHPC-3kh, and DDHPC-4kh respectively. Among all the samples, DDHPC-1kh has the lowest surface area and comparatively inadequate pore distribution (see Fig. 2c the pore size distribution, using NLDFT slit-pore model), which may hinder the efficient electrolytic access to the surface of active material. DDHPC-2kh and DDHPC-3kh show higher surface area and pore volume as compared to DDHPC-1kh. However, DDHPC-4kh has a comparatively highest SSA than all other DDHPC-kh samples, due to the increased presence of mesopores and micropores as indicated by broader hysteresis opening. A comparative BET study has been included separately for DDHPC-4kh sample in Fig. 2b along with pore-size distribution (Fig. 2d) to understand the pore creation during the complete pyrolysis treatment and further pore activation through KOH & HF treatment. Fig. 2b exhibits a considerable broadening in hysteresis loop of DDHPC-4kh, which signifies the enhancement in the mesopores due to higher condensation of adsorbate molecules. Moreover, from Fig. 2d it is clear that micro-mesopore distribution drastically increased for DDHPC-4kh as compared to only after carbonization (DDHPC-4) and KOH activation (DDHPC-4k) of digestate sample. BET isotherms indicate that inherited amorphous SiO2 is acting as a hard template and on removal with HF treatment contributes to the creation of meso and micropores. SSA of DDHPC-4, 4k, and 4kh was estimated as 53 m2 g−1, 1097 m2 g−1 and 2502 m2 g−1 using MPBET, and results are shown in Table 1. These results provide strong evidence that KOH activation and SiO2 based impurities are playing a very crucial role in the creation of pores.
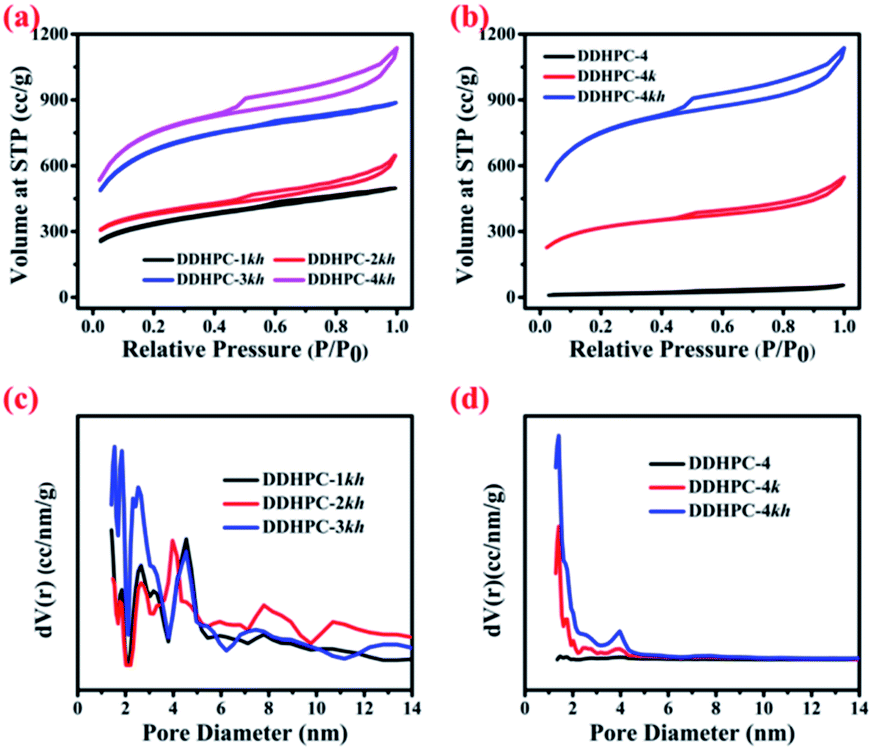 | ||
| Fig. 2 BET adsorption isotherm for DDHPC 1kh, 2kh, 3kh and 4kh (a), and DDHPC-4, 4k and 4hk (b); pore size distribution for DDHPC-1kh, 2kh and 3kh (c), and DDHPC-4, 4k and 4hk (d). | ||
| Sample | MP-BET specific surface area (m2 g−1) | DFT total pore volume |
|---|---|---|
| DDHPC-1kh | 1095 | 0.700 |
| DDHPC-2kh | 1216 | 0.864 |
| DDHPC-3kh | 2204 | 1.232 |
| DDHPC-4kh | 2502 | 1.499 |
| DDHPC-4k | 1097 | 0.660 |
| DDHPC-4 | 53 | 0.066 |
The surface morphology of DDHPC-kh samples was analyzed by FESEM, and the corresponding FESEM images are represented in Fig. 3. The FESEM images exhibit a highly porous surface of DDHPC-kh samples having a combined 3D interconnected, crumbled, and layered sheet-like carbon network structures. The layered porous carbon provides access for electrolyte and exposes the high surface area for electrostatic charge storage. It is evident from FESEM images that microstructures of all DDHPC-kh samples differ slightly from each other. But, as compared to DDHPC-1kh (Fig. 3a and b) and DDHPC-2kh (Fig. 3c and d), DDHPC-3kh (Fig. 3e and f) and DDHPC-4kh (Fig. 3g and h) have higher presence of thinner and crumbled sheets to a considerable extent which is more conducive to better electrochemical performance.
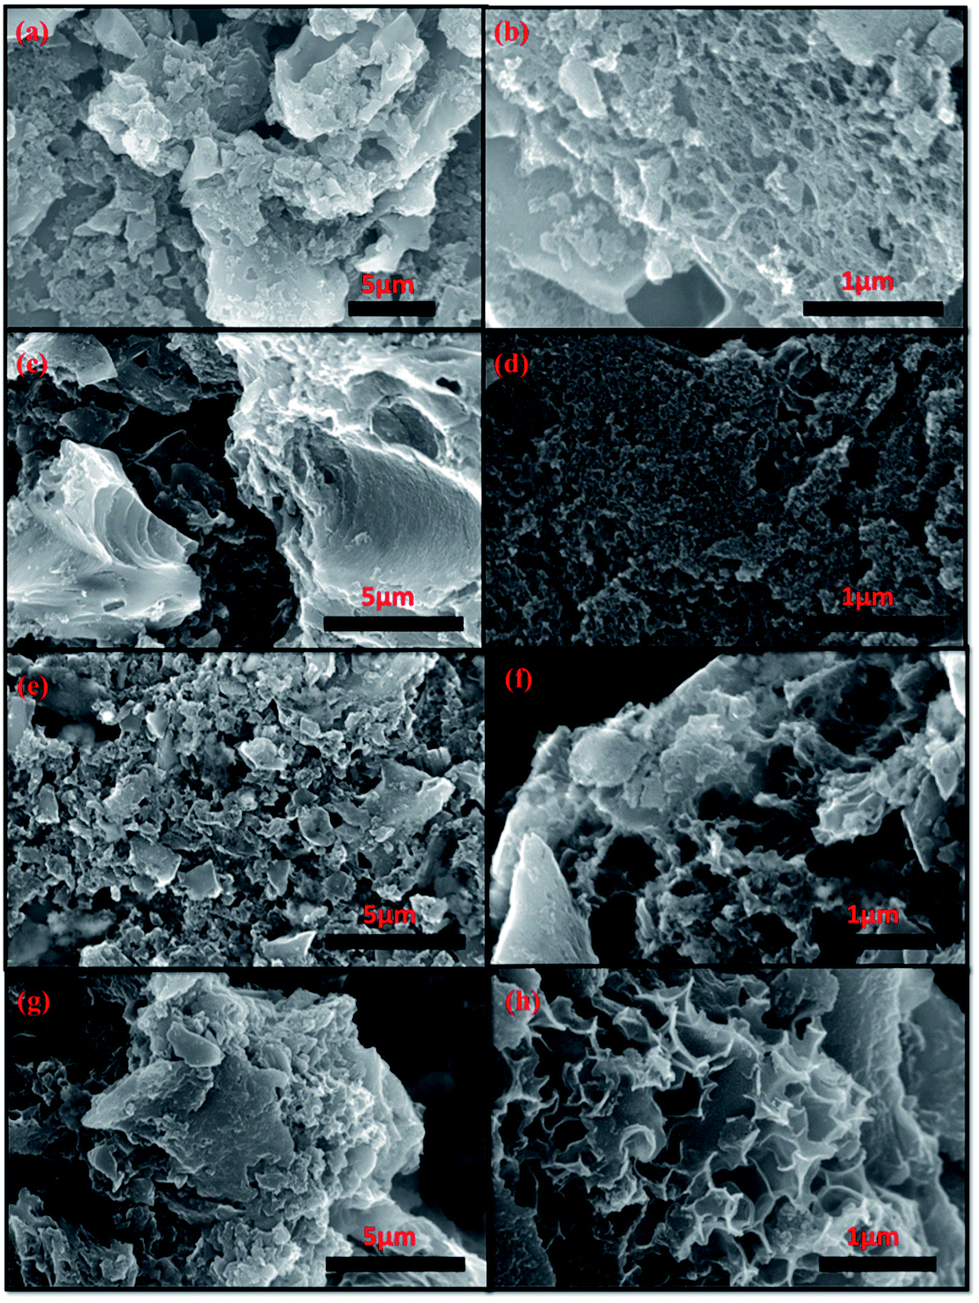 | ||
| Fig. 3 FESEM images of different DDHPC-kh samples; DDHPC-1kh (a and b), DDHPC-2kh (c and d), DDHPC-3kh (e and f), DDHPC-4kh (g and h). | ||
TEM images are shown in Fig. 4, represent unordered highly porous structure for all DDHPC-kh sample. The TEM images indicate the nanoscale resolution of porous carbon network which majorly forms sheet-like structure along with high pore density (meso and micropores) in all DDHPC-kh samples. TEM images also provide evidence that DDHPC-4kh contains comparatively more uniform porous arrangement as compared to other DDHPC-kh samples, which agrees well with the PSD results in BET analysis. Some images appeared with dense black spots between the carbon matrix, probably due to amorphous and crystalline impurities, which are significantly present in different DDHPC-kh samples. Amorphous nature and presence of polycrystalline contaminants in the various DDHPC-kh are also evident by SAED pattern shown in Fig. 4c, f, i and l for DDHPC-1kh, 2kh, 3kh, and 4kh respectively. TEM imaging of DDHPC-4kh sample has been done during various treatment steps and images are included as ESI Fig. S3 of ESI.† Fig. S3† clearly indicates that DDHPC-4 (ESI Fig. S3a and b†) contains non porous carbon particles with dense spots of inorganic impurities. After KOH/HCl treatment, unordered porous texture can be seen for DDHPC-4k (ESI Fig. S3d and e†) which further improves with HF treatment for DDHPC-4kh (ESI Fig. S3g and h†).
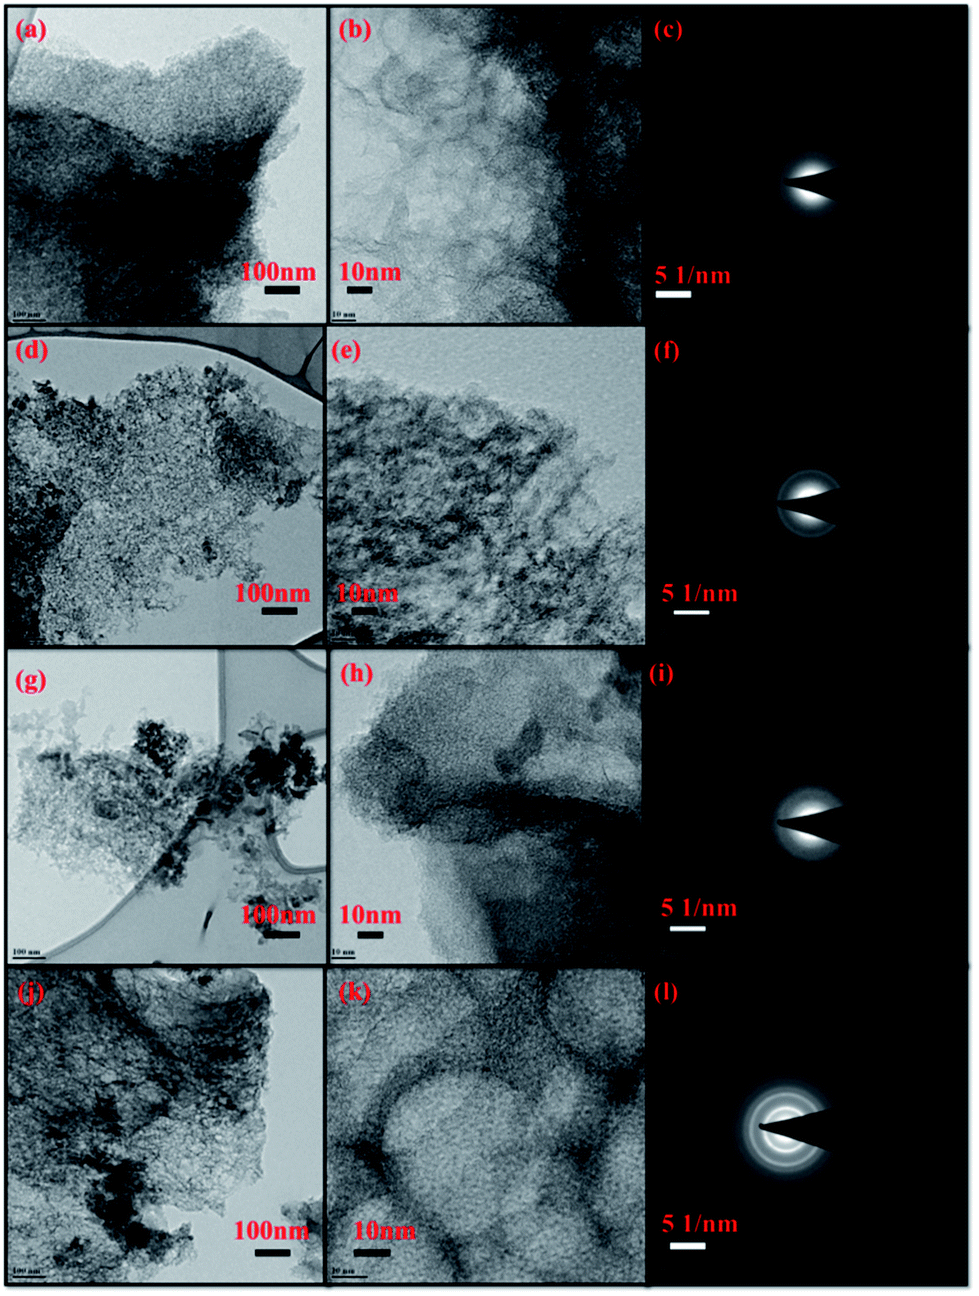 | ||
| Fig. 4 TEM image of different DDHPC-kh samples; DDHPC-1kh (a–c), DDHPC-2kh (d–f), DDHPC-3kh (g–i), DDHPC-4kh (j–l). | ||
Electrochemical studies
The electrochemical study has been carried out for all four carbon samples at different scan rates and current densities. Fig. 5 represents a relative performance of all four samples at same input parameter using cyclic voltammetry (CV), galvanostatic charge–discharge (CD), electrochemical impedance spectroscopy (EIS) and cyclic stability (CS). From resulting data, rectangular CV and triangular CD curves represent a capacitive behavior of all four batches of carbon with different specific capacitance. It can be inferred from the symmetric rectangular shapes of CV curves in Fig. 5a that all of the DDHPC-kh electrodes possess sound ion diffusion and charge propagation characteristics with typical EDLC type of behavior. From charge–discharge, the specific capacitance has been calculated at a current density of 1 A g−1. Values obtained from the CD curves in Fig. 5b are 108 F g−1, 139 F g−1, 184 F g−1 and 235 F g−1 for DDHPC-1kh, 2kh, 3kh, and 4kh respectively. This variation shows that the charge storage capacity is highly dependent on the structural nature, porosity, and directly proportional to the specific surface area of different carbon samples. The difference in surface area results from the variety in source digestate and entirely depends upon the nature of the carbon precursor. All four samples have different equivalent series resistance (Rs) as well as charge transfer resistance (Rct). These values have been calculated from the Nyquist plot, as shown in Fig. 5c. The calculated Rs are approximately 2.86 ohms, 2.45 ohms, 1.96 ohms, and 1.93 ohms respectively for DDHPC-1kh, 2kh, 3kh, and 4kh. Charge transfer resistance calculated by fitting the semicircle of Nyquist plot is 0.30 ohms, 0.51 ohms, 0.28 ohms, and 0.33 ohms respectively for DDHPC-1kh, 2kh, 3kh, and 4kh. Cyclic stability in Fig. 5d shows the capacity retention of about 77%, 72%, 65% and 56% for DDHPC 1kh, 2kh, 3kh, and 4kh carbon electrodes respectively at a high current density of 10 A g−1 after 5000 cycles. The capacity fading is prominent in DDHPC-4kh even though it has excellent capacity and low series resistance. Rate capabilities, calculated as the ratio of specific capacitance at 20 A g−1 to that at 1 A g−1 for different DDHPCs are 70%, 76%, 71%, and 67% for DDHPC-1kh, 2kh, 3kh, and 4kh respectively. For a better understanding of the issues associated with capacity fading, DDHPC-4 was investigated in details during different steps of treatments, and comparable electrochemical results are shown in Fig. 6.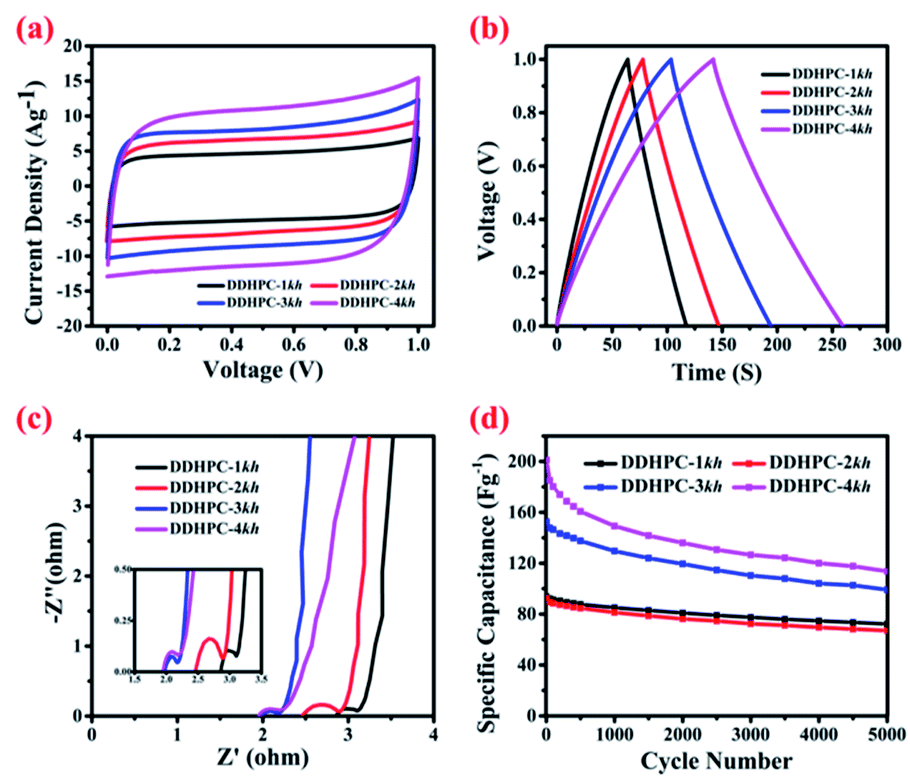 | ||
| Fig. 5 Comparative electrochemical data for DDHPC 1kh, 2kh, 3kh and 4kh samples; (a) cyclic voltammetry (scan rate 100 mV s−1), (b) chronopotentiometry charge–discharge (current density 1 A g−1), (c) Nyquist plot for impedance and (d) cyclic stability at current density of 10 A g−1. | ||
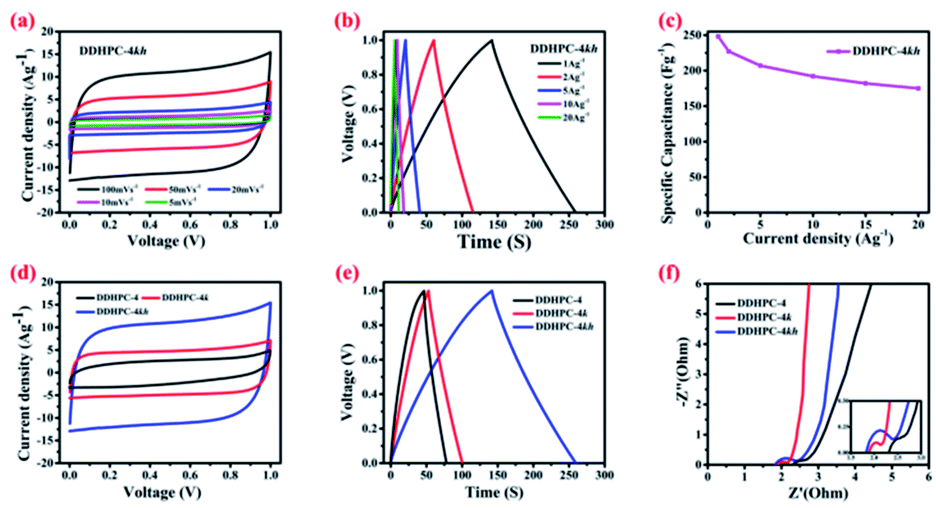 | ||
| Fig. 6 Detailed electrochemical analysis of DDHPC-4kh sample (a) cyclic voltammetry (at various scan rates), (b) galvanostatic charge–discharge (at various current densities), (c) rate capacity (at various current densities). Comparative electrochemical results at different treatment stages for DDHPC-4, 4k and 4hk samples (d) cyclic voltammetry at a scan rate of 100 mV s−1, (e) galvanostatic charge–discharge at an input current density of 1 A g−1, (f) Nyquist plots. | ||
Fig. 6a represents the CV of DDHPC-4kh, the behavior of the electrode tested under various scan rates ranging from 5 mV s−1 to 100 mV s−1. Rectangular profile of CV is maintained even at the higher scan rate. Fig. 6b represents the CD curve at different current densities and the specific capacitance calculated is about 235 F g−1 at 1 A g−1. During charge–discharge, the capacitance retention of 67% was observed at an input current density of 20 A g−1 as compared to 1 A g−1 (Fig. 6c). Fig. 6d–f represents the comparative electrochemical studies for DDHPC-4 at different stages of treatment. Fig. 6d shows relative CV curves at a scan rate of 100 mV s−1 of DDHPC-4, DDHPC-4k, DDHPC-4kh (after carbonization, KOH activation, HF washing). CV curve of DDHPC-4 sample shows a slight deviation from ideal rectangular characteristics, most probably because of inorganic impurities and surface functional groups are contributing to pseudocapacitance. KOH activation, HF treatments enhance the overall EDLC performance by improving the surface area and reducing the inorganic contaminants. After carbonization, during CD (Fig. 6e) DDHPC-4 shows a specific capacitance of 73 F g−1 with 1 A g−1 applied current density. Further, on KOH activation, the specific capacitance of DDHPC-4k increased up to 99 F g−1 at the same applied current density. DDHPC-4k sample has high amorphous silica content that hampers its performance even though it has a high surface area of 1097 m2 g−1 (Table 1). After removal of silica (through HF treatment), the capacitance improved significantly to 235 F g−1 at an applied current density of 1 A g−1 (for DDHPC-4kh). EIS shows that Rs values also decreased with the KOH activation and HF treatment, possibly due to the removal of inherited impurities. However, charge transfer and diffusion resistance (low-frequency region) increased for DDHPC-4kh as compared to DDHPC-4k. Rct increased probably due to increment in the heterogeneity in the electrode surface and a higher presence of grain boundaries after the HF treatment (Fig. 6f).
Electrochemical investigations suggest a reverse trend between the specific capacity and cyclic stability of DDHPC-kh carbons, such as DDHPC-4kh possesses the much higher capacitance values as compared to DDHPC-1kh, 2kh, and 3kh but with poor cyclic stability and rate capability. Capacity fading of DDHPC-4kh could be due to slow decaying of inorganic impurities present in the bulk samples. During the HF treatment, impurities encapsulated in carbon layers may not be directly accessible for acid to dissolve them for removal. The surface micropores of DDHPC-4kh samples may get activated during the electrochemical testing in acidic medium, and electrolytic ion can easily penetrate the highly porous carbon framework and reach to encapsulated impurities and dissolves them into the electrolytic solution. Dissolution of bulk impurities may lead to degradation of mechanical integrity of the porous electrode resulting in the poor cyclic stability and rate capacity. A similar trend is also observed for DDHPC-3kh as well, in contrast to DDHPC-1kh & 2kh, which possess lesser specific capacity but comparatively better cyclic stability.
Conclusions
In summary, different batches from an anaerobic digestate were converted to highly porous DDHPC-kh carbon samples possessing a combined 3D interconnected, crumbled, and layered sheet-like carbon network structures. Nitrogen and oxygen-containing surface functionalities are observed in various DDHPC-kh samples with a slight compositional variation. Additionally, a small presence of iron, calcium, and silica-based inorganic impurities are observed through XPS and XRD analysis. When tested as a supercapacitor electrode, at an input current density of 1 A g−1, the specific capacitance of 108 F g−1, 139 F g−1, 184 F g−1, and 235 F g−1 was obtained for the DDHPC-1kh, 2kh, 3kh, and 4kh respectively. A maximum capacitance of 235 F g−1 was achieved with an SSA of 2502 m2 g−1 at a current density of 1 A g−1 with an aqueous electrolyte for DDHPC-4kh. Inherited inorganic content, mainly silica, acted as pore directing (self-templating) agent, resulting in the very high surface area of DDHPC-4kh. The critical challenge associated with the electrochemical performance of DDHPC-kh electrodes is poor cyclic stability with a capacity retention of 77%, 72%, 65%, and 56% for DDHPC 1kh, 2kh, 3kh, and 4kh respectively after 5000 cycles at a current density of 10 A g−1. By selectively reducing the inherited inorganic impurities on input and output feedstock of biogas digester, and with some adequate experimentation on combining the various treatment steps, the electrochemical properties of digestate derived carbons are expected to improve further. The advantage of present work lies in the maximum usage of domestic/industrial organic waste by not only utilizing it to the fullest (as biofuel) but also converting the remnants (digestate) into activated carbon for the use as electrode material in energy storage devices. The results presented herein can be used as an archetype for value addition in the digestate waste along with sustainable energy solution in the future.Conflicts of interest
There are no conflicts to declare.Acknowledgements
The authors acknowledge fellowship support from the Council of Scientific and Industrial Research (CSIR), Government of India. We sincerely acknowledge the funding support from the Department of Science and Technology (DST-Nanomission), Government of India.Notes and references
- B. E. Conway, Electrochemical Supercapacitors: Scientific Fundamentals and Technological Applications, Springer Science & Business Media, 2013 Search PubMed.
- Y. Wang, Y. Song and Y. Xia, Chem. Soc. Rev., 2016, 45, 5925–5950 RSC.
- R. Ryoo, S. H. Joo, M. Kruk and M. Jaroniec, Adv. Mater., 2001, 13, 677–681 CrossRef CAS.
- C. Liang, Z. Li and S. Dai, Angew. Chem., Int. Ed., 2008, 47, 3696–3717 CrossRef CAS.
- C. Liang, S. Dai and G. Guiochon, Anal. Chem., 2003, 75, 4904–4912 CrossRef CAS.
- Z. Yu, L. Tetard, L. Zhai and J. Thomas, Energy Environ. Sci., 2015, 8, 702–730 RSC.
- D. Qu and H. Shi, J. Power Sources, 1998, 74, 99–107 CrossRef CAS.
- D. W. Wang, F. Li, M. Liu, G. Q. Lu and H. M. Cheng, Angew. Chem., Int. Ed., 2008, 47, 373–376 CrossRef CAS.
- J. Chmiola, G. Yushin, R. Dash and Y. Gogotsi, J. Power Sources, 2006, 158, 765–772 CrossRef CAS.
- M. Cakici, R. R. Kakarla and F. Alonso-Marroquin, Chem. Eng. J., 2017, 309, 151–158 CrossRef CAS.
- Y. Wang, Z. Shi, Y. Huang, Y. Ma, C. Wang, M. Chen and Y. Chen, J. Phys. Chem. C, 2009, 113, 13103–13107 CrossRef CAS.
- A. G. Pandolfo and A. F. Hollenkamp, J. Power Sources, 2006, 157, 11–27 CrossRef CAS.
- Q. Wang, Y. Zhang, H. Jiang and C. Meng, J. Colloid Interface Sci., 2019, 534, 142–155 CrossRef CAS.
- Y. Zhang, C. Wang, H. Jiang, Q. Wang, J. Zheng and C. Meng, Chem. Eng. J., 2019, 375, 121938 CrossRef CAS.
- D. N. Futaba, K. Hata, T. Yamada, T. Hiraoka, Y. Hayamizu, Y. Kakudate, O. Tanaike, H. Hatori, M. Yumura and S. Iijima, Nat. Mater., 2006, 5, 987–994 CrossRef CAS.
- P. Kalyani and A. Anitha, Int. J. Hydrogen Energy, 2013, 38, 4034–4045 CrossRef CAS.
- J. Wang and S. Kaskel, J. Mater. Chem., 2012, 22, 23710 RSC.
- R. Ryoo, S. H. Joo and S. Jun, J. Phys. Chem. B, 1999, 103, 7743–7746 CrossRef CAS.
- J. Lee, S. Yoon, T. Hyeon, S. M. Oh and K. Bum Kim, Chem. Commun., 1999, 2177–2178 RSC.
- J. Fan, C. Yu, L. Wang, B. Tu, D. Zhao, Y. Sakamoto and O. Terasaki, J. Am. Chem. Soc., 2001, 123, 12113–12114 CrossRef CAS.
- A. Lu, A. Kiefer, W. Schmidt and F. Schüth, Chem. Mater., 2004, 16, 100–103 CrossRef CAS.
- F. Zhang, Y. Meng, D. Gu, Y. Yan, C. Yu, B. Tu and D. Zhao, J. Am. Chem. Soc., 2005, 127, 13508–13509 CrossRef CAS.
- H. Kosonen, S. Valkama, A. Nykänen, M. Toivanen, G. ten Brinke, J. Ruokolainen and O. Ikkala, Adv. Mater., 2006, 18, 201–205 CrossRef CAS.
- C. Liang and S. Dai, J. Am. Chem. Soc., 2006, 128, 5316–5317 CrossRef CAS.
- Y. Deng, T. Yu, Y. Wan, Y. Shi, Y. Meng, D. Gu, L. Zhang, Y. Huang, C. Liu, X. Wu and D. Zhao, J. Am. Chem. Soc., 2007, 129, 1690–1697 CrossRef CAS.
- M. R. Jisha, Y. J. Hwang, J. S. Shin, K. S. Nahm, T. Prem Kumar, K. Karthikeyan, N. Dhanikaivelu, D. Kalpana, N. G. Renganathan and A. M. Stephan, Mater. Chem. Phys., 2009, 115, 33–39 CrossRef CAS.
- Y. Guo, J. Qi, Y. Jiang, S. Yang, Z. Wang and H. Xu, Mater. Chem. Phys., 2003, 80, 704–709 CrossRef CAS.
- V. Subramanian, C. Luo, A. M. Stephan, K. S. Nahm, S. Thomas and B. Wei, J. Phys. Chem. C, 2007, 111, 7527–7531 CrossRef CAS.
- M. S. Balathanigaimani, W. G. Shim, M. J. Lee, C. Kim, J. W. Lee and H. Moon, Electrochem. Commun., 2008, 10, 868–871 CrossRef CAS.
- K. Jurewicz and K. Babeł, Energy Fuels, 2010, 24, 3429–3435 CrossRef CAS.
- M. Biswal, A. Banerjee, M. Deo and S. Ogale, Energy Environ. Sci., 2013, 6, 1249 RSC.
- M. Wahid, D. Puthusseri, D. Phase and S. Ogale, Energy Fuels, 2014, 28, 4233–4240 CrossRef CAS.
- A. Divyashree, S. A. B. A. Manaf, S. Yallappa, K. Chaitra, N. Kathyayini and G. Hegde, J. Energy Chem., 2016, 25, 880–887 CrossRef.
- A. Mahto, R. Gupta, K. K. Ghara, D. N. Srivastava, P. Maiti, D. Kalpana, P. Zavala-Revira, R. Meena and S. K. Nataraj, J. Hazard. Mater., 2017, 340, 189–201 CrossRef CAS.
- A. Padilla-Rivera, M. G. Paredes and L. P. Güereca, Biomass Bioenergy, 2019, 125, 79–94 CrossRef CAS.
- F. Tambone, V. Orzi, M. Zilio and F. Adani, Waste Manag., 2019, 88, 21–27 CrossRef CAS.
- C. Asquer, A. Pistis and E. A. Scano, Environ. Eng. Manage., 2013, 12, 89–92 Search PubMed.
- L. Deressa, S. Libsu, R. B. Chavan, D. Manaye and A. Dabassa, Environ. Ecol. Res., 2015, 3(3), 65–71 CAS.
- H. Bouallagui, Y. Touhami, R. Ben Cheikh and M. Hamdi, Process Biochem., 2005, 40, 989–995 CrossRef CAS.
- D. Zirkler, A. Peters and M. Kaupenjohann, Biomass Bioenergy, 2014, 67, 89–98 CrossRef CAS.
- F. Tambone, P. Genevini, G. D'Imporzano and F. Adani, Bioresour. Technol., 2009, 100, 3140–3142 CrossRef CAS.
- Y. Yao, B. Gao, M. Inyang, A. R. Zimmerman, X. Cao, P. Pullammanappallil and L. Yang, J. Hazard. Mater., 2011, 190, 501–507 CrossRef CAS.
- B. Ali Fil, M. Korkmaz and G. Özmetin, J. Chil. Chem. Soc., 2014, 59, 2686–2691 CrossRef.
- J. A. González, A. C. Carreras and M. D. C. Ruiz, Lat. Am. Appl. Res., 2007, 37, 133–139 Search PubMed.
- R. Siddique, K. Singh, P. Kunal, M. Singh, V. Corinaldesi and A. Rajor, Constr. Build. Mater., 2016, 121, 112–119 CrossRef CAS.
- Y. Han, T. Nishimura and T. Kato, CrystEngComm, 2014, 16, 3540–3547 RSC.
- C. Rodriguez-Navarro, C. Jimenez-Lopez, A. Rodriguez-Navarro, M. T. Gonzalez-Muñoz and M. Rodriguez-Gallego, Geochim. Cosmochim. Acta, 2007, 71, 1197–1213 CrossRef CAS.
- S. Zhang, M. Zeng, J. Li, J. Li, J. Xu and X. Wang, J. Mater. Chem. A, 2014, 2, 4391–4397 RSC.
- A. Cuesta, P. Dhamelincourt, J. Laureyns, A. Martínez-Alonso and J. M. D. Tascón, Carbon, 1994, 32, 1523–1532 CrossRef CAS.
- D. Watkins, M. Nuruddin, M. Hosur, A. Tcherbi-Narteh and S. Jeelani, J. Mater. Res. Technol., 2015, 4, 26–32 CrossRef CAS.
- W. Yu, H. Wang, S. Liu, N. Mao, X. Liu, J. Shi, W. Liu, S. Chen and X. Wang, J. Mater. Chem. A, 2016, 4, 5973–5983 RSC.
- S. Zhang, M. Zeng, J. Li, J. Li, J. Xu and X. Wang, J. Mater. Chem. A, 2014, 2, 4391–4397 RSC.
- H. A. Becerril, J. Mao, Z. Liu, R. M. Stoltenberg, Z. Bao and Y. Chen, ACS Nano, 2008, 2, 463–470 CrossRef CAS.
- L. Stobinski, B. Lesiak, A. Malolepszy, M. Mazurkiewicz, B. Mierzwa, J. Zemek, P. Jiricek and I. Bieloshapka, J. Electron Spectrosc. Relat. Phenom., 2014, 195, 145–154 CrossRef CAS.
- B. Gupta, N. Kumar, K. Panda, V. Kanan, S. Joshi and I. Visoly-Fisher, Sci. Rep., 2017, 7, 1–14 CrossRef CAS PubMed.
Footnote |
| † Electronic supplementary information (ESI) available. See DOI: 10.1039/c9ra06603a |
| This journal is © The Royal Society of Chemistry 2019 |