
 Open Access Article
 This Open Access Article is licensed under a Creative Commons Attribution-Non Commercial 3.0 Unported Licence
A uniform few-layered carbon coating derived from self-assembled carboxylate monolayers capable of promoting the rate properties and durability of commercial TiO2†
Meng Huanga,
Hui-Ling Zhub,
Yong-Xin Qia,
Ning Lun*a and
Yu-Jun Bai *a
*a
aKey Laboratory for Liquid–Solid Structural Evolution and Processing of Materials (Ministry of Education), Shandong University, Jinan 250061, PR China. E-mail: byj97@sdu.edu.cn; lunning66@sdu.edu.cn; Fax: +86 531 88392315; Tel: +86 531 88392315
bSchool of Materials Science and Engineering, Shandong University of Science and Technology, Qingdao, 266590, PR China
First published on 8th November 2019
Abstract
The poor cyclability and rate property of commercial TiO2 (c-TiO2) hinder its utilization in lithium-ion batteries (LIBs). Coating carbon is one of the ways to ameliorate the electrochemical performance. However, how to effectively form a uniform thin carbon coating is still a challenge. On the basis of the strong interaction of the TiO2 surface with carboxyl groups, herein a new tactic to achieve uniform and thin carbon layers on the c-TiO2 particles was proposed. When mixing c-TiO2 with citric acid containing carboxyl groups in deionized water, the high-affinity adsorption of TiO2 for carboxyl groups resulted in self-assembled carboxylate monolayers on the surface of TiO2 which evolved into a uniform few-layered amorphous carbon coating during carbonizing at 750 °C. The product derived from the mixture of c-TiO2 and citric acid with a mass ratio of 1![[thin space (1/6-em)]](https://www.rsc.org/images/entities/char_2009.gif) :0.3 exhibits the optimal performance, revealing a high specific capacity (256.6 mA h g−1 after 50 cycles at 0.1 A g−1) and outstanding cycling stability (retaining a capacity of 160.0 mA h g−1 after 1000 cycles at 0.5 A g−1). The greatly enhanced capacity and cyclability correlate with the uniform few-layered carbon coating which not only ameliorates the electronic conductivity of c-TiO2 but also avoids the reduction in ionic conductivity caused by thick carbon layers and redundant carbon.
:0.3 exhibits the optimal performance, revealing a high specific capacity (256.6 mA h g−1 after 50 cycles at 0.1 A g−1) and outstanding cycling stability (retaining a capacity of 160.0 mA h g−1 after 1000 cycles at 0.5 A g−1). The greatly enhanced capacity and cyclability correlate with the uniform few-layered carbon coating which not only ameliorates the electronic conductivity of c-TiO2 but also avoids the reduction in ionic conductivity caused by thick carbon layers and redundant carbon.
1. Introduction
The rapid development of electric vehicles, hybrid electric vehicles and large-scale renewable energy storage equipment has prompted the urgent need for low-cost and environmentally friendly energy storage systems. Li-ion batteries (LIBs) have gained great success recently in commerce on account of their high energy and power densities, good stability and safety.1,2 However, the electrode materials still face some intractable obstacles, mainly including low electronic and/or ionic conductivities, and unavoidable capacity decay during charging and discharging.Insertion-type anodes, especially Ti-based oxides, exhibit high safety. TiO2 has a series of advantages, such as environmental benignity, abundance in the earth, low price, high chemical stability, low volume change (<4%) and small structural strain in lithiation/delithiation process.3,4 Nevertheless, the low electronic conductivity and poor Li-ion conductivity are the main factors restricting its application in LIBs.5,6 To date, extensive explorations have been carried out to solve these issues by ion-doping,7 scaling down the particle size to nanometer for shortening Li-ion diffusion length,8,9 appropriately controlling to form novel morphology,10–12 and coating with conductive carbon materials,13–15 among which the last one is commonly simple and efficient to improve the electrochemical performance of TiO2. However, the TiO2 employed in the available investigations was mostly prepared by the precursors with high cost, regardless of the economy for applications.
Commercially available anatase TiO2 with low cost is conveniently fabricated by acid etching titanium ore. However the impurities in the commercial TiO2 (c-TiO2) have serious effect on the electrochemical performance,16 only several reports are concerning with the electrochemical performance of c-TiO2. Sulfate radicals are the dominant impurities in c-TiO2, which could be eliminated by heating the c-TiO2 above 750 °C. Furthermore, coating carbon at 750 °C with the carbon source of glucose could not only effectively remove the sulfate radicals but also greatly meliorate the electrochemical properties of c-TiO2, achieving a capacity of 203.4 mA h g−1 after 250 cycles at 0.5 A g−1.17 When the c-TiO2 was coated with soft carbon derived from pitch, a capacity of 140.2 mA h g−1 was retained after 1000 cycles at 0.5 A g−1.18 Thus the c-TiO2 composited with carbon at temperatures above 750 °C could denote elevated specific capacities owing to the removal of the sulfate radicals and the improvement in electrical conductivity, but the cyclability is still unsatisfactory, possibly because of the difficulty in tailoring the uniform formation of the carbon coating around the TiO2 particles. The incomplete carbon coating could not isolate TiO2 from electrolyte, and the electronic conductivity could not be thoroughly revealed. Moreover, superfluous carbon also affects the rate performance and cycling stability of TiO2 on account of the poor performance of carbon materials at high current rate.
Due to the low volume variation during the lithiation/delithiation in TiO2, the optimum carbon content is to form the uniform and thin coating as soon as possible, not only enhancing the electric conductivity but also facilitating Li-ion migration. How to effectively achieve the homogenous thin carbon coating is still a challenge.
According to a very recent report,19 TiO2 could selectively absorb carboxylic acid due to the high-affinity adsorption resulted from the bidentate binding, leading to self-assembled carboxylate monolayers on the surface of TiO2. This strong adsorption phenomenon might find other applications besides self-cleaning and photocatalysis. In this work, citric acid (CA) with carboxyl groups was chosen as the carbon source to manufacture the carbon-coated c-TiO2 at 750 °C, aiming at to obtain uniform and thin carbon coating layers for optimizing the electrochemical performance of c-TiO2. As expected, the rate performance and cycling stability were significantly raised by simply adjusting the mass ratio of CA/TiO2, achieving a high specific capacity of 256.6 mA h g−1 at 0.1 A g−1 and 168.2 mA h g−1 at 0.5 A g−1 even after 1000 cycles. The mechanism involved was discussed by virtue of several characterization methods.
2. Experimental
2.1. Fabrication of TiO2/C
The c-TiO2 (purity of 99.19 wt%, 0.5 wt% SO42−, specific surface area of 350 m2 g−1) was purchased from Panzhihua TaiDu Chemical Industry Co. Ltd, identical to that in our previous work.The carbon-coated c-TiO2 was fabricated by two simple steps. (1) CA of 0.6, 0.9 and 1.2 g was dissolved in 50 mL deionized water separately, then 3.0 g c-TiO2 was added into each solution and magnetically stirred for 30 min in a crucible (i.e. the mass ratio for CA/c-TiO2 is 0.2, 0.3 and 0.4 one by one), the uniform mixtures were dried in an oven at 105 °C for 12 h to obtain the precursors. (2) The dried precursors were calcined in a horizontal tube furnace at 750 °C for 5 h (at a heating rate of 5 °C min−1) under N2 atmosphere. The calcination products were consecutively labeled as TiO2/C-20, TiO2/C-30 and TiO2/C-40 in terms of the mass percent of CA/c-TiO2.
2.2. Characterization
Crystal structure was identified by powder X-ray diffraction (XRD) in a Rigaku Dmax-2500 diffractometer with Cu Kα radiation in 2θ range from 10 to 90°. Raman spectra (Lab-RAM HR800 Raman spectroscope) were adopted to characterize carbon material using argon ion laser excitation with wavelength of 632.81 nm. High-resolution transmission electron microscopy (HRTEM, JEOL JEM-2100 microscope) was employed to analyze microstructure. Carbon content was determined by thermogravimetric analysis (TGA) via heating the carbon-coated samples in air to 700 °C in a TGA/DSC1/1600 apparatus.2.3. Electrode preparation and performance test
The electrochemical properties of TiO2/C were tested by assembling coin-type half cells (CR 2025) in a glove box filled with Ar atmosphere. The active substance, acetylene black and polyvinylidene difluoride were mixed according to a mass ratio of 8:1:1 in solvent of n-methyl pyrrolidinone. The homogeneous mixture was coated on Cu foil followed by vacuum drying for 12 h at 120 °C. The other cell components include counter electrode of Li foil, separator of Celgard 2300, electrolyte containing 1 M LiPF6 dissolved in ethyl carbonate and dimethyl carbonate with a volume ratio of 1:1.
Land CT2001A battery test systems were employed to evaluate the electrochemical performance in a potential range of 0.02–3.0 V (vs. Li/Li+) at 25 °C. An IviumStat electrochemical workstation was adopted to test cyclic voltammogram (CV) between 0.02 and 3.0 V at a scanning rate of 0.3 mV s−1 and electrochemical impedance spectra (EIS) in a frequency range of 10−2–105 Hz with a signal amplitude of 3 mV.
3. Results and discussion
3.1. TG/DTG curves and FTIR spectra for determining the interaction between TiO2 and CA
In order to determine the interaction between TiO2 and CA, TG/DTG curves were measured in N2 atmosphere for the pristine CA and the precursor of TiO2/C-30. For CA, the dominant weight loss around 200 °C is followed by a slight weight loss around 250 °C owing to the pyrolysis of CA (Fig. 1a), and the intensity ratio for the latter DTG peak to the former one is 0.072. However, for the precursor of TiO2/C-30, besides the weight loss around 200 °C, another weight loss happened around 375 °C (Fig. 1b), and the intensity ratio for the two DTG peaks is 0.2569. Apparently, the weight loss at the second stage for the TiO2/C-30 precursor shifts to higher temperature, and the ratio is much high than that for CA, demonstration the strong interaction between TiO2 and CA due to the high-affinity adsorption of TiO2 surface for carboxyl groups, as reported in the literature.19 The self-assembled carboxylate monolayers on the surface of TiO2 facilitates to evolved into uniform few-layered carbon coating during subsequent carbonization at 750 °C.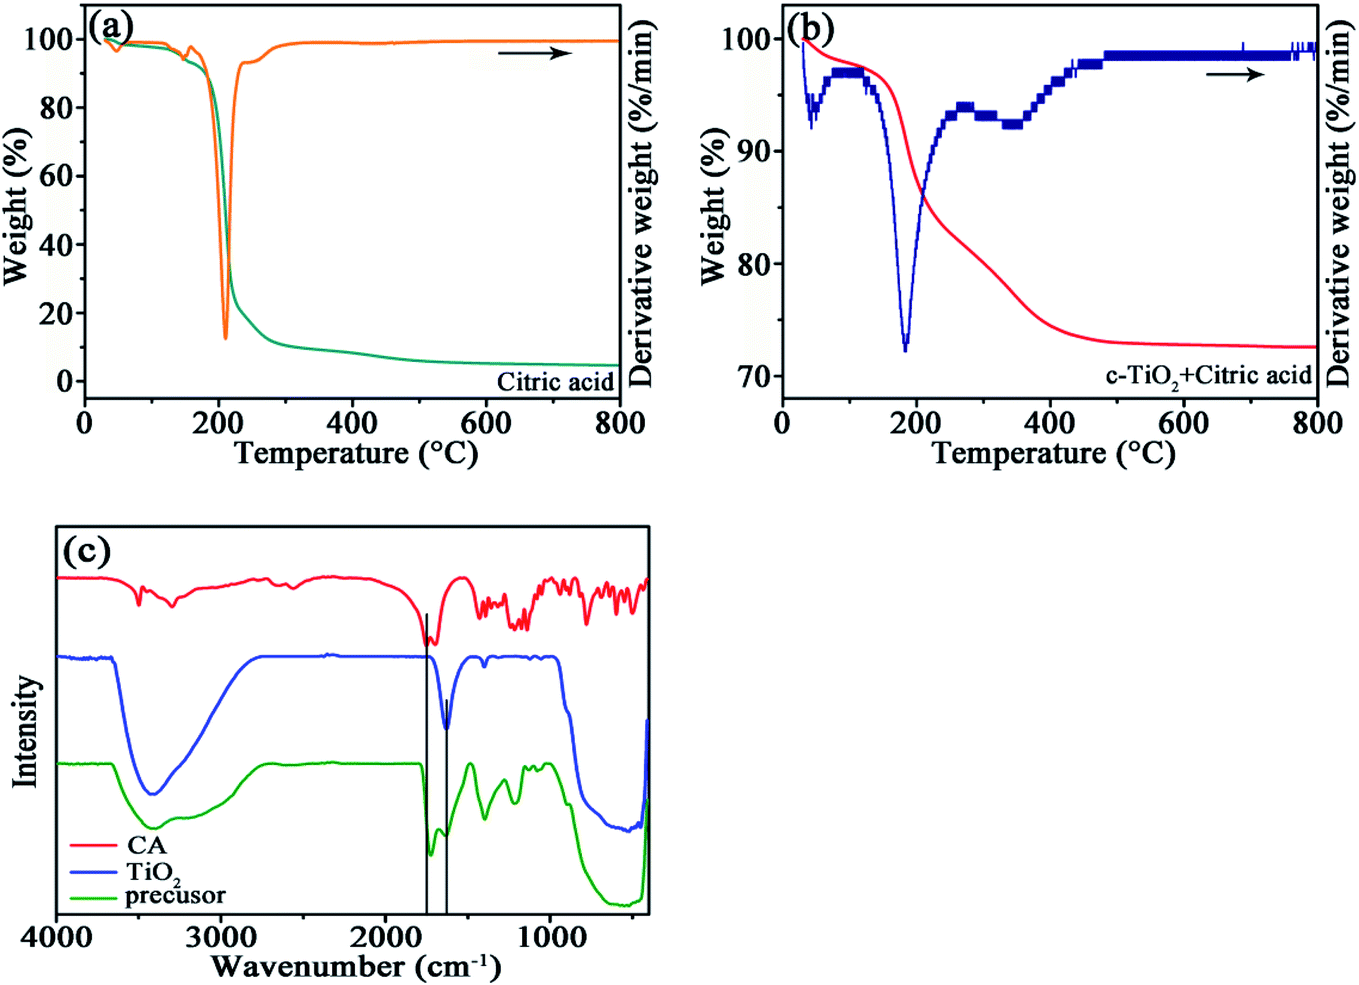 | ||
| Fig. 1 TG/DTG curves of CA (a), TiO2/C-30 precursor (b) at the heating rate of 10 °C min−1 under N2 atmosphere, and (c) FTIR spectra of CA, TiO2 and TiO2/C-30 precursor. | ||
The interaction between TiO2 and CA was also confirmed by FTIR (Fig. 1c). In the spectra of TiO2/C-30 precursor and c-TiO2, the broad peak around 400–900 cm−1 originates from the Ti–O bond of TiO2,20 the adsorption peaks near 1200 and 1400 cm−1 from the –OH in citric acid, the peak around 1634 cm−1 from the surface hydroxyl group, and the adsorption bands in the region of 3000–3500 cm−1 from the vibration of the adsorbed water.21 The absorption band at 1751 cm−1 in CA is related to the C![[double bond, length as m-dash]](https://www.rsc.org/images/entities/char_e001.gif) O from carboxyl groups.22,23 No deviation occurs for the adsorption peak of surface hydroxyl group at 1634 cm−1, whereas the position of CO bond in TiO2/C-30 precursor shifts to 1724 cm−1, denoting the strong interaction between TiO2 and carboxyl group as observed in the TG/DTG curves.
O from carboxyl groups.22,23 No deviation occurs for the adsorption peak of surface hydroxyl group at 1634 cm−1, whereas the position of CO bond in TiO2/C-30 precursor shifts to 1724 cm−1, denoting the strong interaction between TiO2 and carboxyl group as observed in the TG/DTG curves.
3.2. Structure and carbon content evaluation
The XRD patterns (Fig. 2a) of TiO2, TiO2/C-20, TiO2/C-30, and TiO2/C-40 calcined at 750 °C manifest similar diffractions to anatase TiO2 (JCPDS no. 71-1166). The peaks of bare TiO2 are narrower and stronger than those of TiO2/C, demonstrating the grain growth of TiO2 in the absence of carbon layer. Calculated by the Scherrer equation D = Kλ/(βcosθ), the average crystallite sizes are 38.7 nm for TiO2, 14.7 nm for TiO2/C-20, 13.9 nm for TiO2/C-30 and 10.1 nm for TiO2/C-40 in terms of the (101) plane, further confirming the hindered growth of TiO2 crystallites in the presence of carbon derived from CA. No distinct carbon diffractions could be identified due to the low content and amorphous structure, as evidenced by Raman spectra and TG analysis.
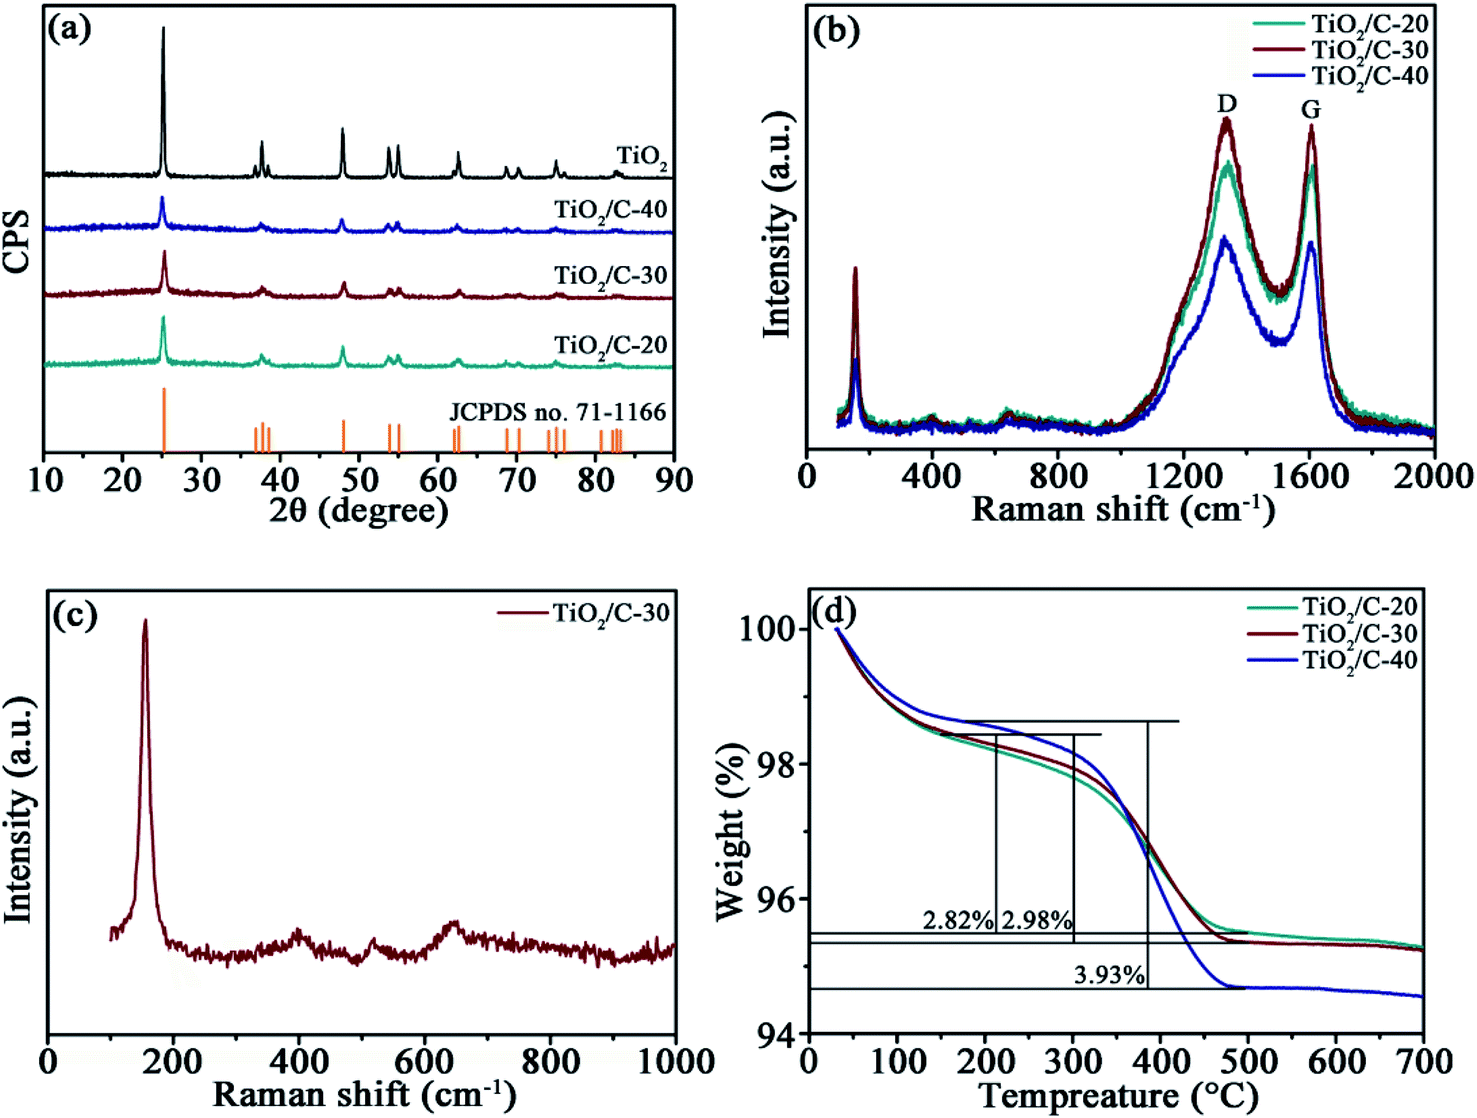 | ||
| Fig. 2 (a) XRD patterns of TiO2 and TiO2/C, (b) Raman spectra of TiO2/C, (c) partially enlarged Raman spectrum TiO2/C-30, and (d) TG curves of TiO2/C. | ||
The presence of carbon in TiO2/C was corroborated by Raman spectra (Fig. 2b). The characteristic D (around 1341 cm−1) and G bands (around 1606 cm−1) represent amorphous and graphitized carbon, respectively. The relative intensity ratio (ID/IG) of the two bands is 1.016 for TiO2/C-20, 1.024 for TiO2/C-30 and 1.011 for TiO2/C-40, manifesting the low graphitization degree of the CA-derived carbon. The partially enlarged Raman spectrum between 100–1000 cm−1 for TiO2/C-30 (Fig. 2c) indicates the characteristic peaks at 154, 397, 521 and 631 cm−1 resulted from anatase TiO2.24,25
The carbon content was assessed by TGA at the heating rate of 10 °C min−1 under air atmosphere (Fig. 2d). The curves contain two weight loss stages; the one below 200 °C is attributed to the elimination of moisture absorbed on the samples, and the other one between 200 and 500 °C results from the combustion of carbon. Consequently, the carbon content is 2.82 wt% for TiO2/C-20, 2.98 wt% for TiO2/C-30, and 3.93 wt% for TiO2/C-40.
3.3. Microstructure examination
The interaction of carbon with TiO2 was examined by TEM (Fig. 3). Homogeneous microstructure could be observed from the low magnification images (Fig. 3a, c and e). The high-resolution images (Fig. 3b, d and f) illustrate the interplanar spacing of 0.35 nm which is consistent with that of the (101) plane of anatase TiO2. Carbon coating about 2–3 carbon layers in thickness is discernible on the surface of TiO2 particles. The coating for TiO2/C-30 is uniform (Fig. 3d), yet is discontinuous for TiO2/C-20 because the carbon content is too low to fully cover the TiO2 particles (Fig. 3b), while for TiO2/C-40, besides the unintermitted few-layered carbon, some amorphous carbon presents among the particles owing to the higher carbon content (Fig. 3f). The uniform and thin carbon coating could facilitate electron transfer, compensating for the poor electronic conductivity of c-TiO2. In addition, the carbon layer is also conducive to maintaining the stability of the structure,26 thus the structure will not easy to be destroyed during the Li+ shuttle, which is beneficial to improving the electrochemical performance of c-TiO2. | ||
| Fig. 3 TEM images of TiO2/C-20 (a and b), TiO2/C-30 (c and d), TiO2/C-40 (e and f). | ||
3.4. Electrochemical performance assessment
The electrochemical performance of TiO2/C was firstly assessed by galvanostatically discharging/charging at 0.1 A g−1 with the active substance of about 1.7–2.3 mg cm−2 on each electrode (Fig. 4a). The initial coulombic efficiencies (CE) are 26.2%, 53.0%, 55.3% and 52.2% for TiO2, TiO2/C-20, TiO2/C-30 and TiO2/C-40, respectively, indicative of the enhanced CE after coating carbon derived from CA. The formation of SEI films in the 1st cycle is responsible for the low CE. Except for the initial cycles, the CE is almost close to 100%, conducive to maintaining good cycling stability. After the initial several cycles, the capacities of the products tend to be stable, achieving lithiation capacities of 74.9, 205.7, 256.6 and 206.8 mA h g−1 after the 50th cycle for TiO2, TiO2/C-20, TiO2/C-30 and TiO2/C-40, respectively. The capacity of TiO2/C is evidently higher than that of the bare TiO2, because the thin carbon coating could separate the TiO2 particles from electrolyte, preventing some side reactions and thus meliorating the electrochemical performance of c-TiO2.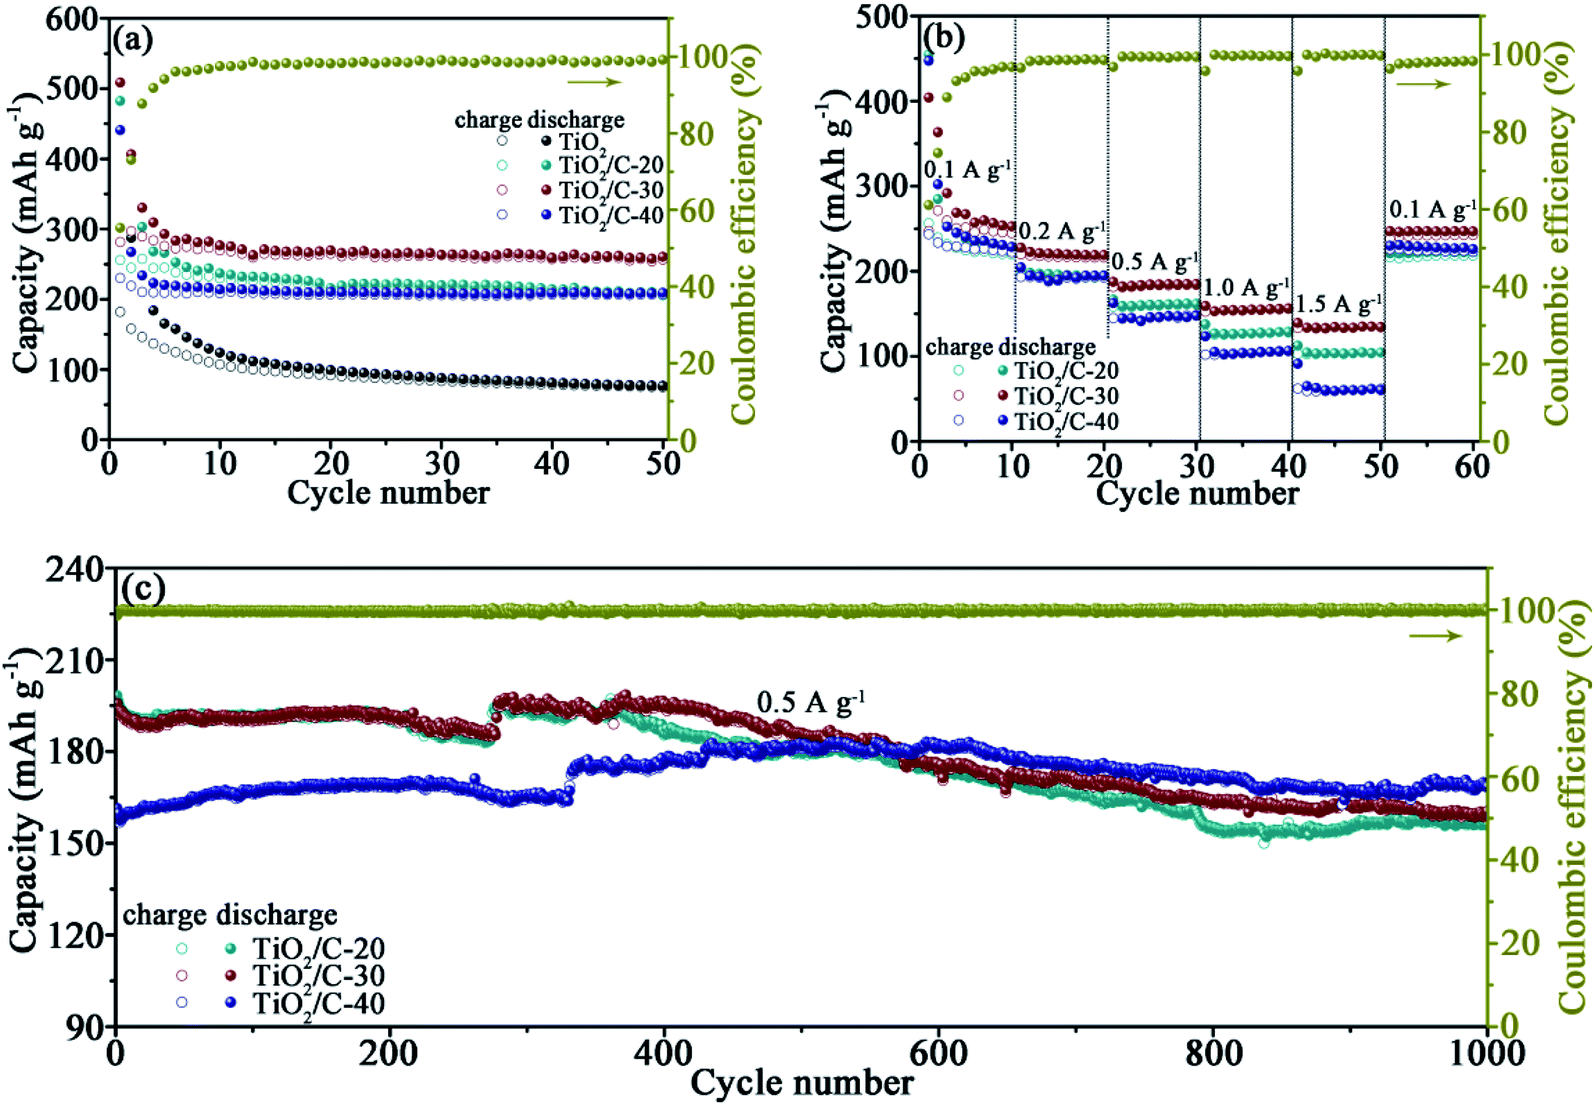 | ||
| Fig. 4 (a) Cycling performance of TiO2 and TiO2/C at 0.1 A g−1, (b) rate performance of TiO2/C, (c) cycling performance of TiO2/C at 0.5 A g−1. | ||
To understand the structural stability with cycling, the XRD patterns of TiO2/C-30 were acquired before cycling and after 100 charge/discharge cycles at 0.1 A g−1 (Fig. S1†). Apparently, the structure after 100 cycles is identical to that prior to cycling with the Cu diffractions as a reference.
Rate capabilities were tested at 0.1, 0.2, 0.5, 1.0, 1.5 and 0.1 A g−1 for every 10 cycles (Fig. 4b), the average capacity at each current density and the capacity retention relative to the capacity at the initial 0.1 A g−1 are summarized in Table 1 for intuitive comparison. TiO2/C-30 exhibits not only the highest specific capacity but also the highest capacity retention at each current density, demonstrating the superior rate capabilities to the other carbon-coated products. The inferior rate performance of TiO2/C-20 is related to the discontinuous carbon layers, while that of TiO2/C-40 to the redundant carbon besides the carbon layers. When the current density returned to 0.1 A g−1 after the rate performance test, the capacity recovered to similar values to that at the initial 0.1 A g−1, denoting the excellent performance stability of TiO2/C.
| Samples | Capacities/capacity retention at varied current densities | |||||
|---|---|---|---|---|---|---|
| 0.1 | 0.2 | 0.5 | 1.0 | 1.5 | 0.1 | |
| TiO2/C-20 | 221.3/100 | 193.1/87.3 | 160.4/72.5 | 127.2/57.5 | 102.8/46.5 | 218.7/98.8 |
| TiO2/C-30 | 245.8/100 | 216.6/88.1 | 183.3/74.6 | 154.4/62.8 | 133.7/54.4 | 242.6/98.7 |
| TiO2/C-40 | 224.8/100 | 191.1/85.0 | 147.5/65.6 | 105.3/46.8 | 60.4/26.9 | 224.1/99.7 |
The cells were continued cycling at 0.5 A g−1 for exploring the cyclability (Fig. 4c). After 1000 cycles, the capacity is 156.1, 160.0 and 168.2 mA h g−1 for TiO2/C-20, TiO2/C-30 and TiO2/C-40, respectively, further confirming the excellent cycling stability after forming the thin carbon layers derived from CA.
The performance of TiO2/C-30 was also compared with other modified TiO2 in literature (Table 2). With respect to the highly pure TiO2 derived from tetraethyl orthotitanate,27 tetra-n-butyl titanate,28 titanium isopropoxide29,30 as well as modified by other carbon materials, TiO2/C-30 reveals the performance comparable to that in the literature despite the simply fabrication of TiO2/C-30 by employing the cheap raw materials of c-TiO2 and CA.
| Electrode state | Capacity at low current rate | Capacity at high current rate | Capacity/current rate/cycle number |
|---|---|---|---|
| Nitrogen rich carbon coated TiO2 nanoparticles27 | 303/0.1C | 87/10C | 136/5C/500 |
| Graphene-modified TiO2 hierarchical film28 | 205/0.5C | 76/20C | 94/5C/3500 |
| N-doped hollow urchin-like anatase TiO2@C composite29 | 165/1C | 111/10C | — |
| Carbon@mesoporous TiO2 nanocrystalline@carbon30 | 244/0.1C | 115/5C | 191/0.2C/200 |
| TiO2/C-30 (this work) | 245/100 mA g−1 | 133/1500 mA g−1 | 160/500 mA g−1/1000 |
3.5. Electrochemical reaction analysis
CV profiles were measured to compare the lithiation/delithiation of TiO2 and TiO2/C (Fig. 5). The analogous plots manifest the similar reactions occurred in TiO2/C to those in TiO2. The lithiation/delithiation potentials around 1.5/2.4 V associate with the reaction TiO2 + xLi+ + xe− ↔ LixTiO2 (0 ≤ x ≤ 1).31 The cathodic peak around 0.7 V in the 1st cycle is related to the formation of the SEI films, which disappears in the subsequent cycles. The difference (ΔV) between the anodic (Va)/cathodic potentials (Vc) for the initial three CV cycles are given in Table 3, which reflects the polarization of the electrode materials to a certain degree. Roughly, the ΔV value for TiO2 is larger than those for TiO2/C with the same cycle due to the poor electronic conductivity of c-TiO2. The ΔV for TiO2/C-20 and TiO2/C-30 is comparatively stable within the three cycles, while that for TiO2/C-40 increases with cycling, because carbon materials usually exhibit inferior Li-ion conductivity, meanwhile, the redundant porous carbon results in more SEI films and thus elevated electrical resistance owing to the insulating feature of the SEI films.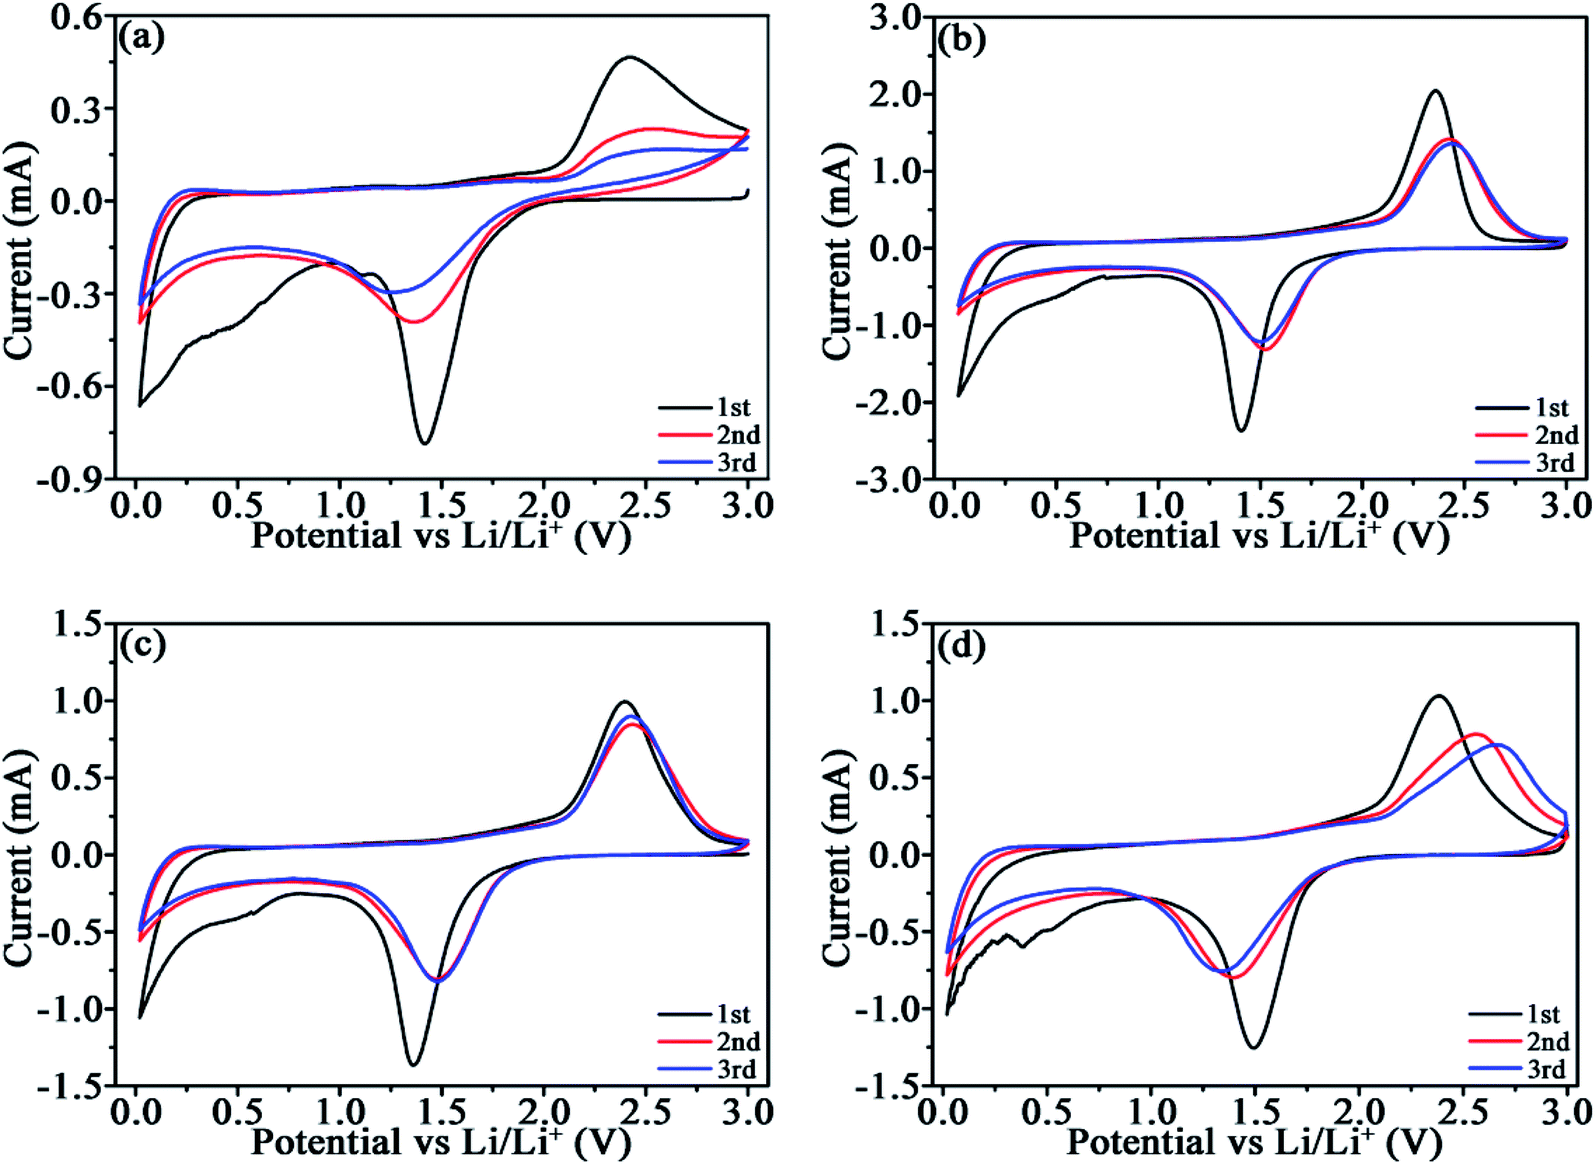 | ||
| Fig. 5 CV plots of TiO2 (a), TiO2/C-20 (b), TiO2/C-30 (c), and TiO2/C-40 (d) at 0.3 mV s−1. | ||
| Samples | 1st cycle | 2nd cycle | 3rd cycle | ||||||
|---|---|---|---|---|---|---|---|---|---|
| Va | Vc | ΔV | Va | Vc | ΔV | Va | Vc | ΔV | |
| TiO2 | 2.41 | 1.42 | 0.99 | 2.49 | 1.37 | 1.12 | 2.67 | 1.28 | 1.39 |
| TiO2/C-20 | 2.37 | 1.41 | 0.96 | 2.43 | 1.53 | 0.90 | 2.44 | 1.51 | 0.93 |
| TiO2/C-30 | 2.40 | 1.36 | 1.04 | 2.43 | 1.48 | 0.95 | 2.43 | 1.48 | 0.95 |
| TiO2/C-40 | 2.39 | 1.49 | 0.90 | 2.56 | 1.40 | 1.16 | 2.66 | 1.35 | 1.3 |
3.6. EIS analysis
EIS were measured after cycling the cells for 50 times at 0.1 A g−1 to further recognize the effect of carbon on the electrochemical kinetics (Fig. 6). In the equivalent circuit fitting to the EIS (Fig. 6a), Rs stands for the electrolyte resistance, RSEI for the SEI film resistance (acquired by the semicircle diameter in high frequency region32), Rct for the charge transfer resistance, CPE for the constant phase elements relevant to interfacial capacitance, and Zw for the Warburg impedance associating with Li+ diffusion dynamics. Apparently, the fitting curves almost overlap with the experimental ones (more details at high frequency are displayed in Fig. 6b), corroborating the validity of the equivalent circuit. The data acquired from the fitting plots are collected in Table 4. The total resistance RT = (Rs + RSEI + Rct) for TiO2/C is significantly smaller than that for TiO2, demonstrating the markedly enhanced electronic conductivity by coating the thin carbon layers.33 However, TiO2/C-40 exhibits higher RSEI, Rct, and RT than TiO2/C-30, because the redundant carbon in TiO2/C-40 gives rise to more SEI films due to the loose porous structure. The SEI film is favorable for Li-ion transfer yet unfavorable for electron migration, resulting in the increased RSEI, Rct and RT.34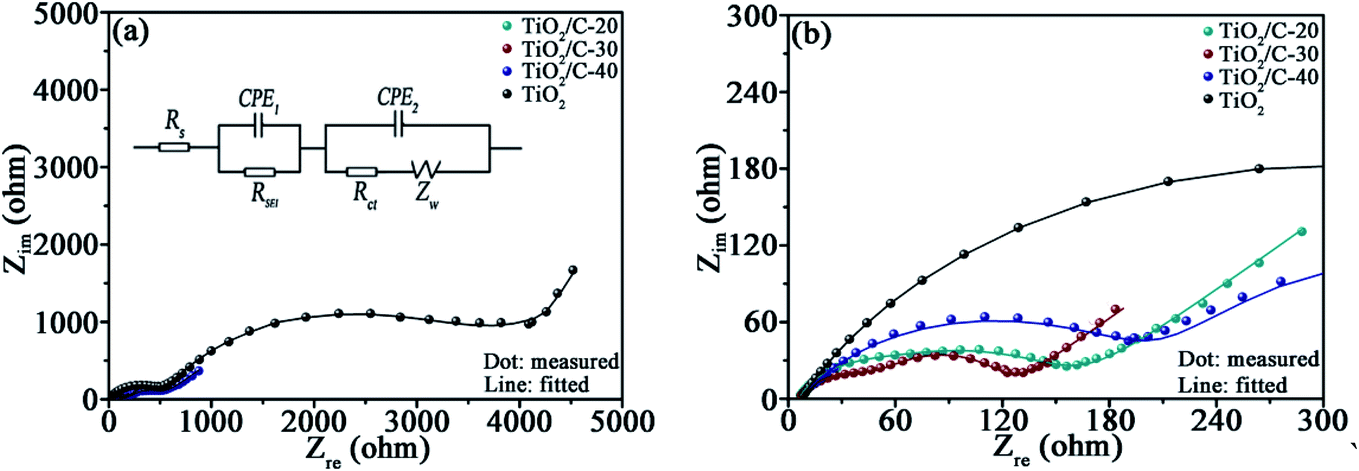 | ||
| Fig. 6 (a) EIS and the corresponding fitting curves (the inset is the equivalent circuit fitting to the EIS of TiO2/C), (b) the enlarged EIS at high frequency. | ||
| Sample | Rs (Ω) | RSEI (Ω) | Rct (Ω) | RT (Ω) |
|---|---|---|---|---|
| TiO2 | 7.1 | 500.7 | 3649.0 | 4156.8 |
| TiO2/C-20 | 5.7 | 34.5 | 120.7 | 160.9 |
| TiO2/C-30 | 6.6 | 50.2 | 61.8 | 118.6 |
| TiO2/C-40 | 6.3 | 201.7 | 299.6 | 507.6 |
Furthermore, Li+ diffusion coefficient (D) was calculated by the formula Ip = 2.69 × 10⁵n3/2AD1/2ν1/2ΔC0,35 where Ip – peak current (taking the anodic peak of the stable 3rd CV cycle in Fig. 5 as an example), ΔC0 – change of Li+ concentration during discharging/charging (listed in Table 5), n = 1 for TiO2, A = 1.5386 cm2 and ν = 3 × 10⁻⁴ V s−1. From the calculated D values in Table 5, the thin carbon coating brings about the enhancement in ionic conductivity more than one order of magnitude. However, the conductivity decreases slightly with increasing the carbon content due to the poor Li-ion conductivity of carbon materials.
| Samples | Ip (mA) | a (Å) | b (Å) | c (Å) | ΔC0 (mol cm−3) | D (cm2 S−1) |
|---|---|---|---|---|---|---|
| TiO2 | 0.17 | 3.784 | 3.784 | 9.515 | 0.0244 | 9.45 × 10⁻¹³ |
| TiO2/C-20 | 1.35 | 3.784 | 3.784 | 9.515 | 0.0244 | 5.96 × 10⁻¹¹ |
| TiO2/C-30 | 0.90 | 3.784 | 3.784 | 9.515 | 0.0244 | 2.65 × 10⁻¹¹ |
| TiO2/C-40 | 0.71 | 3.784 | 3.784 | 9.515 | 0.0244 | 1.64 × 10⁻¹¹ |
Comprehensively considering the electronic and ionic conductivities, the appropriate carbon content to form uniform thin layers (say TiO2/C-30) is essential for c-TiO2 to achieve the optimized electrochemical performance.
3.7. Discussion
The performance of the carbon-coated c-TiO2 was discussed by combining the TEM, EIS, TGA, and CV results in this work with that reported in the literature available,17,18,36 as summarized in Table 6. Although the interaction with carbon could bring about great improvement in electrochemical performance of c-TiO2, the performance is still affected by several factors, such as the carbon source, carbonization temperature and resultant carbon content. When c-TiO2 was calcined at 450 °C with the carbon precursor of sucrose,36 the carbon/TiO2 nanocomposites only revealed better performance at low current rate because of the low carbonization temperature. When the sintering temperature was raised to 750 °C using glucose as the carbon precursor, both the capacity and rate performance were further ameliorated due to the thorough removal of the residual SO42− in c-TiO2. When employing pitch as the carbon source,18 the products calcined at 750 °C demonstrated high capacity, outstanding rate capabilities and cyclability. However, if the carbonization temperature was raised to 900 °C,37 the performance decreases despite the amelioration in electronic conductivity by introducing Ti9O17 yet with the reduction in active components. Consequently, compared to the performance of c-TiO2 in the literature, TiO2/C-30 demonstrates higher initial CE, superior rate performance and cyclability.| Carbon source | Carbonization temperature | Carbon content | Capacity at low rate/initial CE | Capacity at high rate/capacity retention | Capacity at 0.5 A g−1 after cycling/cycle number |
|---|---|---|---|---|---|
| Sucrose36 | 450 | 1.9 | 231 (0.03) | 130.0 (0.3) | |
| Glucose17 | 750 | 11.7 | 274.9 (0.1)/47.1 | 100.7 (1.6)/36.6 | 203.4/250 |
| Pitch18 | 750 | 26.6 | 326.8 (0.1)/46.6 | 162.5 (1.6)/49.7 | 140.2/1000 |
| Pitch37 | 900 | 10.3 | 180.7 (0.1)/40.5 | 71.6 (1.6)/39.6 | 155.8/800 |
| Citric acid | 750 | 2.98 | 245.8 (0.1)/55.3 | 133.7 (1.5)/54.4 | 160.0/1000 |
With respect to the carbon precursors of sucrose, glucose and pitch, a protrudent feature of CA lies in the carboxyl groups which could strongly interact with TiO2 to form self-assembled carboxylate monolayers on the surface of TiO2.19 The high-affinity adsorption is conducive to yielding uniform few-layered carbon coating during carbonization, thus not only meliorating the electronic conductivity of TiO2 but also avoiding the reduction in ionic conductivity caused by the thick carbon layer and redundant carbon. So the few-layered carbon derived from CA is greatly different from the carbon yielded by sucrose, glucose and pitch. The carbon produced by glucose and sucrose usually exhibits porous structure, and the c-TiO2 particles are more like embedding in the porous carbon instead forming carbon layers on the surface of c-TiO2 particles. Carbon-coated c-TiO2 could be obtained using pitch as the carbon precursor, but the content of pitch is frequently high to form the full carbon coating around the c-TiO2 particles due to the poor interaction between pitch and c-TiO2, inevitably yielding some redundant loose carbon. As revealed by EIS, the redundant carbon will lead to more SEI films and elevated SEI resistance (Fig. 6), as well as decreased ionic conductivity owing to the inferior Li-ion conductivity of carbon materials (Table 5). As a consequence, the uniform few-layered carbon coating derived from the intense interaction between TiO2 and CA simultaneous meliorates the electronic and ionic conductivities of c-TiO2, giving rise to the markedly enhanced performance. This new strategy to achieve uniform and thin carbon coating on the c-TiO2 particles might be extended to other Ti-containing oxides by employing other carbon sources with carboxyl groups for optimizing the comprehensive electrochemical performance.
4. Conclusions
In summary, uniform thin carbon coating about 2–3 carbon layers in thickness could be easily formed on the c-TiO2 particles by adopting CA as the carbon source followed by carbonizing the mixture at 750 °C. Herein the high-affinity adsorption of TiO2 for carboxyl groups to form self-assembled carboxylate monolayers on the surface of TiO2 is conducive to yielding the uniform and thin carbon layers during carbonization which could further endow the c-TiO2 with the enhanced electronic and ionic conductivities, attenuated polarization, and thus the elevated capacity and excellent long-term cycling stability. The strategy might be extended to other Ti-containing oxides by employing other carbon sources with carboxyl groups for achieving uniform few-layered carbon coating to optimize the performance. Moreover, the simply processing with environmental benignity as well as the low cost carbon source of CA allows the carbon coating strategy applicable in industrial production of c-TiO2 anodes for LIBs.Conflicts of interest
There are no conflicts to declare.Acknowledgements
This work was supported by project ZR2019MEM029 of Natural Science Foundation of Shandong Province, PR China.References
- W. Wen, J.-M. Wu, Y.-Z. Jiang, S.-L. Yu, J.-Q. Bai, M.-H. Cao and J. Cui, Sci. Rep., 2015, 5, 11804 CrossRef.
- G.-N. Zhu, Y.-G. Wang and Y.-Y. Xia, Energy Environ. Sci., 2012, 5, 6652–6667 RSC.
- J. Zhang, X. Yan, J. Zhang, W. Cai, Z. Wu and Z. Zhang, J. Power Sources, 2012, 198, 223–228 CrossRef CAS.
- Z. Chen, I. Belharouak, Y. K. Sun and K. Amine, Adv. Funct. Mater., 2013, 23, 959–969 CrossRef CAS.
- Y.-M. Jiang, K.-X. Wang, X.-X. Guo, X. Wei, J.-F. Wang and J.-S. Chen, J. Power Sources, 2012, 214, 298–302 CrossRef CAS.
- M. Wagemaker, G. J. Kearley, A. A. van Well, H. Mutka and F. M. Mulder, J. Am. Chem. Soc., 2003, 125, 840–848 CrossRef CAS PubMed.
- Z. Ali, S. N. Cha, J. I. Sohn, I. Shakir, C. Yan, J. M. Kim and D. J. Kang, J. Mater. Chem., 2012, 22, 17625–17629 RSC.
- T. Song, H. Han, H. Choi, J. W. Lee, H. Park, S. Lee, W. I. Park, S. Kim, L. Liu and U. Paik, Nano Res., 2015, 7, 491–501 CrossRef.
- X. Chen and S.-S. Mao, Chem. Rev., 2007, 107, 2891–2959 CrossRef CAS.
- W. Li, F. Wang, Y. Liu, J. Wang, J. Yang, L. Zhang, A. A. Elzatahry, D. M. Aldhayan, Y. Xia and D. Zhao, Nano Lett., 2015, 15, 2186–2193 CrossRef CAS.
- L. Zhao, S. Wang, F. Pan, Z. Tang, Z. Zhang, S. Zhong and J. Zhang, J. Mater. Chem. A, 2018, 6, 11688–11693 RSC.
- G. D. Park, J. H. Hong, J. K. Lee and Y. C. Kang, Nanoscale, 2019, 11, 631–638 RSC.
- C. Wang, L. Wu, H. Wang, W. Zuo, Y. Li and J. Liu, Adv. Funct. Mater., 2015, 25, 3524–3533 CrossRef CAS.
- J.-Y. Liao, D. Higgins, G. Lui, V. Chabot, X. Xiao and Z. Chen, Nano Lett., 2013, 13, 5467–5473 CrossRef CAS.
- Y. Wu, C. Zhu, L. Shu, J. Duan, D. Wei, J. Xu, Z. Zhu, L. Li, Z. Peng and Z. Chen, Appl. Surf. Sci., 2019, 489, 528–537 CrossRef CAS.
- C. Zhao, L. Liu, Q. Zhang, J. Rogers, H. Zhao and Y. Li, Electrochim. Acta, 2015, 155, 288–296 CrossRef CAS.
- L.-Y. Wang, Y. Wu, J.-P. Han, B. Zhang, X. Bai, Y.-X. Qi, N. Lun, Y.-M. Cao and Y.-J. Bai, Electrochim. Acta, 2017, 245, 186–192 CrossRef CAS.
- L.-Y. Wang, X. Bai, Y. Wu, N. Lun, Y.-X. Qi and Y.-J. Bai, Electrochim. Acta, 2016, 212, 155–161 CrossRef CAS.
- J. Balajka, M. A. Hines, D. B. Wji, M. Komora, J. Pavelec, M. Schmid and U. Diebold, Science, 2018, 361, 786–789 CrossRef CAS.
- N. Venkatachalam, M. Palanichamy and V. Murugesan, J. Mol. Catal. A: Chem., 2007, 273, 177–185 CrossRef CAS.
- B. Naik, K. M. Parida and C. S. Gopinath, J. Phys. Chem. C, 2010, 114, 19473–19482 CrossRef CAS.
- G. Trettenhahn and A. Köberl, Electrochim. Acta, 2007, 52, 2716–2722 CrossRef CAS.
- K. Umemura, T. Ueda, S. S. Munawar and S. Kawai, J. Appl. Polym. Sci., 2011, 123, 1991–1996 CrossRef.
- V. Swamy, A. Kuznetsov, L. S. Dubrovinsky, R. A. Caruso, D. G. Shchukin and B. C. Muddle, Phys. Rev. B: Condens. Matter Mater. Phys., 2005, 71, 184302 CrossRef.
- W. Zhang, Y. He, M. Zhang, Z. Yin and Q. Chen, J. Phys. D: Appl. Phys., 2000, 33, 912–916 CrossRef CAS.
- T. Zhao, D. Zhu, W. Li, A. Li and J. Zhang, J. Power Sources, 2019, 439, 227027 CrossRef CAS.
- C. Senthil, T. Kesavan, A. Bhaumik, M. Yoshio and M. Sasidharan, Electrochim. Acta, 2017, 255, 417–427 CrossRef CAS.
- H. Luo, C. Xu, B. Wang, F. Jin, L. Wang, T. Liu, Y. Zhou and D. Wang, Electrochim. Acta, 2019, 313, 10–19 CrossRef CAS.
- Y. Xing, S. Wang, B. Fang, G. Song, D. P. Wilkinson and S. Zhang, J. Power Sources, 2018, 385, 10–17 CrossRef CAS.
- W. Yan, Y. Yuan, J. Xiang, Y. Wu, T. Zhang, S. Yin and S. Guo, Electrochim. Acta, 2019, 312, 119–127 CrossRef CAS.
- G. Nuspl, K. Yoshizawa and T. Yamabe, J. Mater. Chem., 1997, 7, 2529–2536 RSC.
- M. S. Kim, B. Fang, J. H. Kim, D. Yang, K. K. Yun, T. S. Bae and J. S. Yu, J. Mater. Chem., 2011, 21, 19362–19367 RSC.
- D. Wang, D. Choi, J. Li, Z. Yang, Z. Nie, R. Kou, D. Hu, C. Wang, L. V. Saraf and J. Zhang, ACS Nano, 2009, 3, 907–914 CrossRef CAS PubMed.
- J. Wang, X.-M. Liu, H. Yang and X.-D. Shen, J. Alloys Compd., 2011, 509, 712–718 CrossRef CAS.
- A. J. Brad and L. R. Faulkner, Electrochemical methods: fundamentals and applications, vol. 2, Wiley-VCH, New York, 1980 Search PubMed.
- C. Zhao, L. Liu, Q. Zhang, J. Rogers, H. Zhao and Y. Li, Electrochim. Acta, 2015, 155, 288–296 CrossRef CAS.
- J.-X. Teng, R.-L. Bai, L.-Y. Wang and Y.-J. Bai, J. Alloys Compd., 2018, 762, 594–604 CrossRef.
Footnote |
| † Electronic supplementary information (ESI) available. See DOI: 10.1039/c9ra08141k |
| This journal is © The Royal Society of Chemistry 2019 |