 Open Access Article
Resonant waveguide grating based assays for colloidal aggregate detection and promiscuity characterization in natural products†
Rong Wangab,
Jixia Wangad,
Yanfang Liu*ad,
Xiuli Zhang*c and
Xinmiao Liang ad
ad
aKey Lab of Separation Science for Analytical Chemistry, Dalian Institute of Chemical Physics, Chinese Academy of Sciences, Dalian 116023, China. E-mail: liuyanfang@dicp.ac.cn
bUniversity of Chinese Academy of Sciences, Beijing 100049, China
cCollege of Pharmaceutical Science, Soochow University, Suzhou 215123, China. E-mail: zhangxl@suda.edu.cn
dDICP-CMC Innovation Institute of Medicine, Taizhou 225300, China
First published on 21st November 2019
Abstract
Small molecules, including natural compounds, in aqueous buffer that self-associate into colloidal aggregates is the main cause of false results in the early stage of drug discovery. Here we reported resonant waveguide grating (RWG) based assays to identify natural compound aggregation and characterize its influence on membrane receptors in living cells. We first applied a cell-free aggregation assay to determine compound critical aggregation concentration (CAC) values. Then we characterized the aggregators' influence on membrane receptors using three types of dynamic mass redistribution (DMR) assays. Results showed that colloidal aggregates may cause false activity in DMR desensitization assays; some of the false activities can be implied by the large response in DMR agonism assays and can further be identified by DMR antagonism assays. Furthermore, the aggregation mechanism was confirmed by addition of 0.025% tween-80, with cell signals attenuated and potency decreased. Finally, these observations were used for aggregate examination and promiscuity investigation of a traditional herbal medicine, Rhodiola rosea, which ultimately led to the revealing of the true target and reduced the risk of a bioactivity tracking process at the very first stage. This study highlights that the RWG based assays can be used as practical tools to distinguish between real and false hits to provide reliable results in the early stage of drug discovery.
1. Introduction
High-throughput screening (HTS) technologies are vital tools for discovering hit compounds in the pharmaceutical industry.1 However, the HTS programs are often challenged by the frequent occurrence of false activities when special care is not taken.2 The origins of false-active results include chemical reactivity,3 covalent binding,4 and interference in assay readout like absorbance,5 fluorescence,6 or luminescence.7 The dominant mechanism of the false activities, however, is the formation of colloidal aggregates in the aqueous assay buffer.8,9 It is reported that about 19% of compounds from a random selected library can form aggregators at the screen concentrations typically used in HTS.10 Once formed, these aggregators can cause artificial inhibition of soluble enzymes10,11 and membrane-bounded receptors12 through mechanisms like partial unfolding, dynamics restraining or protein sequestration,11,13,14 they can also affect cell growth by reducing compound penetration into cells.15Natural products (NPs), an important source of pharmaceutically interesting compounds, also suffered pains from aggregation phenomenon. Some compounds that are widely present in natural products have already been flagged as aggregators including flavanol, polyphenol, and other highly lipophilic or conjugated compounds.16,17 In the classical NP program for tracking active compounds, samples are often initially tested as multicomponent mixtures.18 Consequently, the false active compounds not only act as problematic hits in themselves, but also play as metabolic matrix, interfering with the screening results, wasting the separation efforts and masking the activities of real hits.19–23 Therefore, NPs need careful scrutiny for the elimination of potential false hits at the very beginning of the program.
Several methods can be used for the direct detection of compound aggregation, such as transmission electron microscopy (TEM),11,24 dynamic light scattering (DLS)10,25 and nuclear magnetic resonance (NMR).26–29 However, these approaches are lack of throughput or simplicity, and they need additional apparatus to screen assays, which may not be available in common pharmacological laboratory. Recently, the optical resonant waveguide grating (RWG) biosensor incorporated into 384-well microplate has been utilized for aggregate detection, which exhibited simplicity and high-throughput.30,31 Apart from aggregate detection, the RWG biosensor was well-known for its use in biomolecular interaction and cellular analysis,32 especially for the measurement of ligand-induced dynamic mass redistribution (DMR) signals in cells.33,34 The intrinsic sensitivity of the RWG is very high, and is very suitable for living cell sensing.35,36 In addition, the DMR assay can provide non-invasive, holistic, pathway sensitive and multi-assay format measurement,37,38 therefore a more comprehensive observation of aggregators’ behavior could be obtained.
Here we applied RWG based assays to first identify natural compound aggregation, and then characterized their influence on membrane receptors in living cells. We further asked if these observations could be used for screening real NP sample to avoid the useless efforts in NP-based research programs.
2. Experimental
2.1 Materials
Salvianolic acid C, proanthocyanidins, luteolin, physcion were purchased from Shanghai Yuanye Bio-technology Co., Ltd. (China). Quercetin, genistein, silybin and curcumin were purchased from Chengdu Push Bio-technology Co., Ltd. (China). All the above compounds were with the HPLC purities of more than 97%. Tween-80 was purchased from Beijing LabLead Biotech Co., Ltd. (China). Acetylcholine chloride, hyoscyamine and zaprinast were obtained from Sigma Chemical Co. (St Louis, MO, USA). ML145 was obtained from Tocris Bioscience Co. (St. Louis, MO, USA).Epic® 384-Well Cell Assay Microplate (Cat. no. 5040) was obtained from Corning Incorporated (Corning, NY, USA). Human colorectal adenocarcinoma HT-29 cell line was obtained from the Cell Bank of Shanghai Institute of Cell Biology, Chinese Academy of Sciences.
For aggregation assay, salvianolic acid C, proanthocyanidins, luteolin, physcion, quercetin, genistein, silybin, curcumin, Rhodiola rosea extract were stocked in at 100 mg mL−1. For cell assays, salvianolic acid C, proanthocyanidins, quercetin and curcumin were stocked at 200 mM, Rhodiola rosea extract was stocked at 100 mg mL−1. Acetylcholine was stocked at 1 M, zaprinast was stocked at 5 mM, ML145 and hyoscyamine were stocked at 100 mM. All compounds were dissolved in 100% dimethyl sulfoxide (DMSO).
The assay buffer was 1× Hank's balanced salt solution (HBSS), 20 mM HEPES, pH 7.2. The detergent assay buffer was 1× Hank's balanced salt solution (HBSS), 20 mM HEPES, 0.1% tween-80 (v/v), pH 7.2. All compounds were diluted with above buffers to assay concentrations.
2.2 Cell culture
HT-29 cells were cultured using McCoy's 5A Medium (#DY0324S0414L, Sango Biotech, Shanghai, China) with 10% fetal bovine serum (#10099141, Gibco, Life Technologies), 50 μg mL−1 penicillin and 100 μg mL−1 streptomycin in a humidified 37 °C/5% CO2 incubator.2.3 Cell-free aggregation assay
The aggregation assay was performed using an Epic BT system (Corning, NY, USA). The Epic 384-Well Cell Assay Microplates were first soaked with 30 μL assay buffer and equilibrated in the Epic reader for 1 hour. After a 2 min baseline measurement, 10 μL of compound dilution series in buffer were added to each well. A range of final DMSO concentrations was tested to establish the background response. The maximum final DMSO concentration was 1‰. After adding compounds, the microplate was returned immediately to the Epic reader and signals were recorded for 1 hour. Each of the assays was performed at least three times with excellent reproducibility.2.4 Dynamic mass redistribution assays
All DMR assays were performed using an Epic BT system (Corning, NY, USA).Cells were directly seeded in Epic 384-Well Cell Assay Microplates and cultured for ∼24 h to form a monolayer in the cell culture medium. After being washed, the cells were maintained with 30 μL assay buffer for 1 h in the Epic system.
For DMR agonism assay, a 2 min baseline was first established, followed by adding samples and monitoring the sample-induced DMR signals for 1 h. Then, the sample treated cells were reused immediately for DMR desensitization assay. A 2 min baseline was first established, followed by adding receptor agonists and monitoring the DMR signals for another 1 h. The receptor agonists for GPR35, M3, NTSR and EGFR were zaprinast (5 μM), acetylcholine (80 μM), neurotensin (2 nM), and EGF (2 nM), respectively.
For DMR antagonism assay, HT-29 cells were first pretreated with receptor antagonists for 10 min, then a 2 min baseline was established, followed by adding 100 μM compounds and monitoring the DMR signals for 1 h. The receptor antagonists for GPR35 and M3 were ML145 and hyoscyamine, respectively.
2.5 Data analysis
All DMR data were acquired using Epic Imager software (Corning, NY, USA) and processed with Imager Beta 3.7 (Corning), Microsoft Excel 2013 and GraphPad Prism 6.02 (GraphPad Software Inc., San Diego, CA, USA). All DMR signals were background corrected. All EC50 or IC50 values described were calculated based on the maximal amplitude of the DMR signals. All DMR data were from two independent measurements, each in at least duplicate (n = 4).2.6 Extraction and sample treatment of Rhodiola rosea
The root of Rhodiola rosea was crushed and extracted with 70% ethanol under ultrasonic for 1 h. Then, the solvent was removed by rotary evaporation to acquire the crude extract. The treated extract was obtained by processing the crude extract with a quaternary ammonium ion exchange resin.2.7 HPLC analysis of the crude extract and the treated extract of Rhodiola rosea
The chromatographic analysis was carried out on Alliance HPLC with UV detector (Waters, Milford, USA). The column used was Unitary C18 (4.6 × 250 mm, 7 μm, Acchrom, Beijing, China). The mobile phases were A: methanol; B: water (containing 0.1% formic acid, v/v). Mobile phase gradient was started at 5% A for 5 min, and then shifted from 5–95% A in 5–45 min, and finally kept at 95%A for another 10 min. The flow rate was 0.7 mL min−1. Column temperature were 30 °C. The UV detection wavelength was 270 nm.3. Results and discussion
3.1 Principles of cell-based DMR assay and cell-free aggregation assay
The major principle of RWG biosensor is to use evanescent wave to record the local refractive index change (Δn) about 150 nm depth near the sensor surface39 and output the signal as wavelength shift of reflected resonance light.40 The biosensor response, in terms of wavelength shift Δλ, is a linear function of the change in refractive index Δn:36| Δλ = (−47 ± 37) pm + Δn (113850 ± 1257) pm |
The imager is very sensitive and was reported to has a limit of detection down to 10−4 RIU for refractive index change under practical conditions.36
For cell environment, the refractive index of a given volume is largely determined by the concentrations of biomolecules such as proteins.33 When activated by compounds, the cellular proteins within the sensing volume will go through re-localization, resulting in shifted reflected wavelength (Fig. 1a). Generally, most GPCR receptors on native cells can obtain 100–500 pm saturated response, which corresponds to 1.3 × 10⁻³ to 4.8 × 10⁻³ RIU for refractive index change. The real-time signal induced by the cellular local density change is also termed as dynamic mass redistribution (DMR).
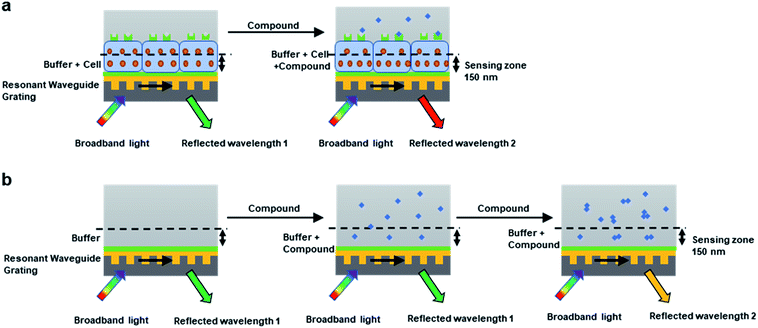 | ||
| Fig. 1 Principles of cell-based DMR assay and cell-free aggregation assay. (a) Cell-based DMR assay for biological test. (b) Cell-free aggregation assay for aggregates detection. | ||
For cell-free environment, the refractive index is mainly affected by the chemical or physical change like the formation of aggregators. When compound with low concentrations were added into the buffer to form soluble monomers, neglectable responses would be observed. Whereas upon increasing the concentration, the compound assembled into aggregators and caused a significant change in the local refractive index, leading to shifted reflected wavelength (Fig. 1b). The higher the aggregator concentration, the higher the response (Fig. 2a). However, not all compounds tend to display wavelength shift. For non-aggregate compounds that dissolve in monomer state across all the screening concentrations in the buffer, no wavelength shift would be observed for all the concentrations (Fig. 2b). Since the aggregation assay is a real-time measurement, the response curve indicates the local environment dynamics. The slightly fluctuation at 2 min indicated the solution disturbance right after adding sample (Fig. 2a and b), and the slow increase during 2–15 min indicated aggregator increasement near the bottom (Fig. 2a).
 | ||
| Fig. 2 Real time dose responses of representative aggregator and non-aggregator in aggregation assay. (a) Curcumin, aggregator. (b) Nicotinic acid, non-aggregator. | ||
3.2 Cell-free aggregation assay for CAC determination
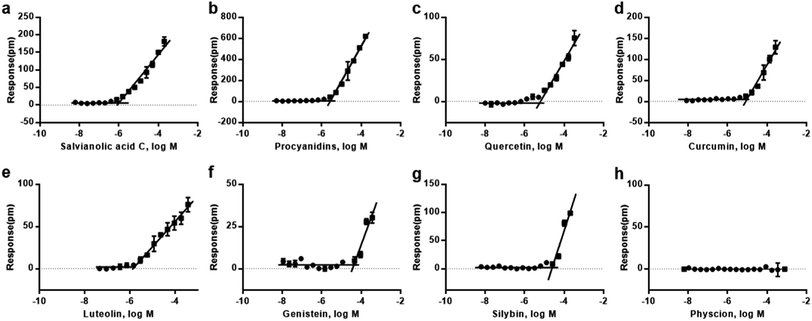
We first performed cell-free aggregation assay in 384-microplate that incorporated with RWG biosensors to investigated the critical aggregation concentrations (CACs) of eight natural compounds, including curcumin, genistein, luteolin, silybin, quercetin, procyanidins, salvianolic acid C and physcion. These compounds came from multiple high-throughput screening projects and the analogues of frequent aggregators.16,41,42 For each compound, a range of concentrations was tested. To determine the CAC values, the responses of different concentrations at fixed time were collected and analyzed, the responses as a function of compound concentration is illustrated in Fig. 3. The horizontal line represented non-aggregating state, and the oblique line represented aggregating state. The intersection of two straight lines was the critical aggregation concentration (CAC). Result showed that most of the compounds exhibited CAC values at micromolar scale (Table 1), which was nearly to previous reports.12,16Overall, the cell-free aggregation assay implementing 384-well microplate can examine compound aggregation and determine the CACs of small molecules in high throughput manner. Furthermore, the detection condition and process are exactly the same with the cell-environment and assay procedure, which can well mimic the external environment of cell surface.
3.3 Characterization of aggregators' effect on cell-based DMR assays
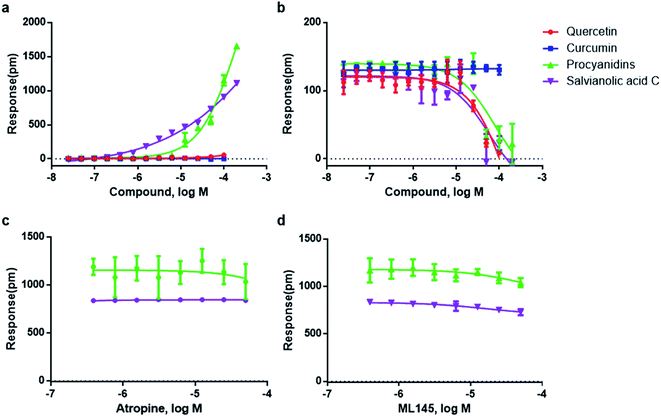
Four compounds, including procyanidin, salvianolic acid C, quercetin and curcumin, which represented the typical structures of the seven aggregation compounds, were used for the study. Three types of cell-based DMR assays, including DMR agonism assay, DMR desensitization assay and DMR antagonism assay, were adopted to characterize the aggregators' influence.DMR agonism assay, which records the signal directly stimulated by the screening compound, was used to characterize the aggregators' direct effect on HT-29 cells. Results showed that procyanidins and salvianolic acid C triggered unusually large DMR responses in HT-29 cells, with the highest response of more than 1000 and 1500 pm, respectively, while at lower concentrations, they exhibited much lower responses (Fig. 4a). Quercetin triggered very low DMR response with less than 100 pm at 100 μM, and curcumin barely triggered any cellular mass redistributions to its solubility limit (Fig. 4a). These results suggested that procyanidins and salvianolic acid C may non-specifically activated multiple ligands on cell surface and implied the promiscuity, while quercetin and curcumin did not.
After direct stimulation by the above four compounds, DMR desensitization assays were used to record receptor's response upon its agonist stimulation. Muscarinic M3 receptor, which is endogenously expressed on HT-29 cells,43 was chosen for this assay. Since the above four compounds bear little physical or topological similarity with known ligands of M3, we expected the monomeric forms of the compounds to be relatively inert to the target. Thus, the activity would be an indication of promiscuity in itself. Results showed that both procyanidins and salvianolic acid C (at concentrations above 50 μM) inhibited the DMR response of acetylcholine against muscarinic M3 receptor (Fig. 4b). Quercetin, which exhibited normal response in the agonism assay, was also observed to false inhibited acetylcholine response at concentrations above 50 μM (Fig. 4b). While the typical aggregator curcumin, did not inhibit acetylcholine response (Fig. 4b). These results indicated that aggregators may false inhibit membrane receptors. The IC50 values of the three promiscuous compounds were all greater than CAC value, which further suggested the aggregator-induced false activities (Table S1†). For procyanidins and salvianolic acid C with extremely high responses in the DMR agonism assay, the false inhibition could be derived from the aggregators' binding with M3 regions on cell surface. While for quercetin with low cell response in DMR agonism assay, this compound was more likely to interact with acetylcholine, and it was the experimental artifact that lead to the desensitization. The case of curcumin indicated that compound aggregation does not guarantee false inhibition of receptors.
The DMR antagonism assay records the response of screen compound on cells which is pre-blocked by receptor antagonist, therefore procyanidins and salvianolic acid C with high responses in agonism assay were chosen. The response of 100 μM procyanidins and salvianolic acid C were not dose-dependently blocked by M3 antagonist atropine (Fig. 4c), or by the GPR35 antagonist ML145 (Fig. 4d). This result suggested that the DMR antagonism assay can help to identify the false results.
The above three cell-based DMR assays demonstrated that, aggregation does not guarantee false activity on cell-based receptor assays, but it is a worry sign. Colloidal aggregates may cause false activity in DMR desensitization assays, some of the false activities can be implied by the large DMR response in DMR agonism assays and be identified by DMR antagonism assays. While for aggregators with low cell response, the identification could be more challenging.
Since the CAC was different for all the four compounds chosen, the relationship between CAC values and the DMR response was investigated (Fig. S1†). The responses of compounds at 100 μM which clearly reflected the aggregation influence were selected. Result showed that DMR responses was somewhat correlated with CAC values: the lower CAC value, the higher DMR agonism response and the lower DMR desensitization response. These results suggested that the lower CAC value, the higher possibility of false activity. However, the relationship was not strictly proportional, for example, although quercetin exhibited larger CAC value than salvianolic acid C and procyanidins, it triggered lower response in the desensitization assay and exhibited false activity anyway. The possible explanation was that, although CAC value is an indication of the compounds' tendency in aggregation, not all aggregators lead to false activities; even for the aggregators that do result in false activities, they vary degrees. In addition, since the aggregators may interact with the activity results through different mechanisms, they may result in very different DMR responses.
3.4 Detergent effect to colloidal aggregates' responses on cell-based DMR assays
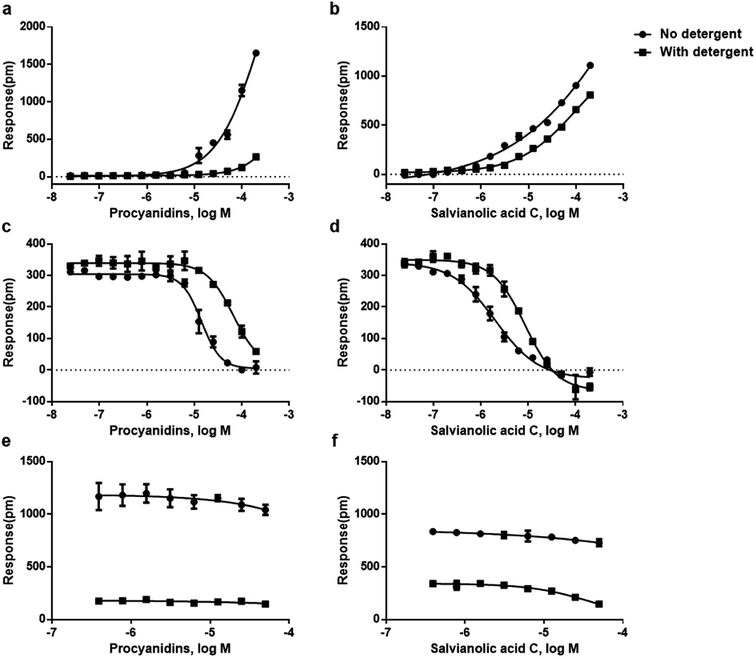
To further confirm the mechanism of the false results, we investigated the detergent effect on NP aggregates in three types of DMR assays. The detergent assay has been widely used for revealing the mechanism of aggregation induced false results.24,44,45 Tween-80 with the concentration of 0.025% which exhibited tolerable disturbance on cell response was adopted as the working solution.In the detergent-based DMR agonism assay, both procyanidins and salvianolic acid C showed decreased efficacy and potency (Fig. 5a and b). In the detergent-based DMR desensitization assay, GPR35 receptor with higher response and more robust signals was used to illustrate the effect. Results showed that both procyanidins and salvianolic acid C exhibited decreased potency on addition of tween-80, resulting in the increase of IC50 values from 14.13 to 65.64 μM, 2.03 to 8.65 μM, for procyanidins and salvianolic acid C, respectively (Fig. 5c and d). In the detergent-based DMR antagonism assay, the signals of salvianolic acid C and procyanidins were also declined significantly (Fig. 5e and f).
The above three cell-based detergent DMR assays further proved compound aggregation as the origin of false activities. At low concentration, soluble single molecule works on the real targets, while at high concentration, the colloidal aggregators bind other targets non-specifically, causing false results on agonism, desensitization and antagonism assays.
3.5 Application of RWG based assays to eliminate false result in NPs
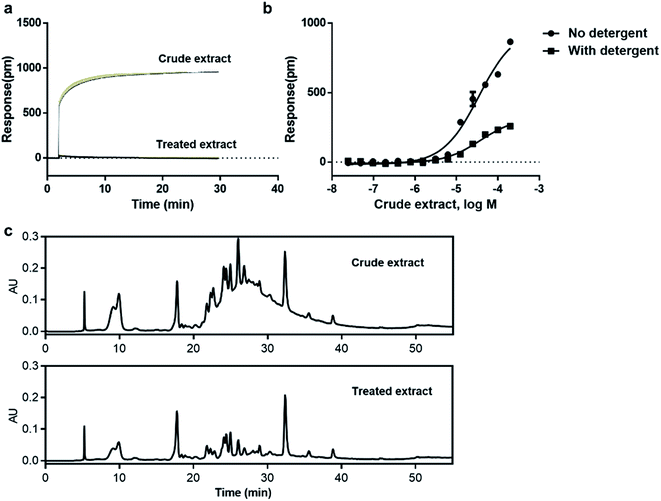
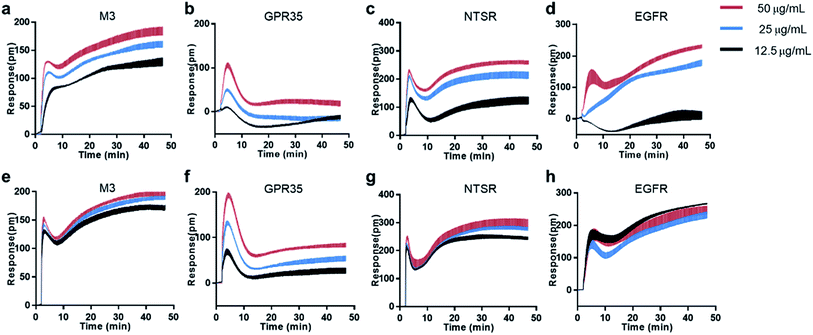
Natural products is one of the promising sources for new drugs.46 However, the presence of aggregate compounds in NPs may impede their further development. Herein, Rhodiola rosea, a famous traditional herbal medicine, which is rich in polyphenols and flavonoids,47 was taken as an example to test the feasibility of RWG based assays to eliminate the aggregates induced false active in complex mixtures.We first used cell-free aggregation assay to test if the crude extract of Rhodiola rosea easily gets self-aggregate, result showed that the crude extract triggered extremely high response at the concentration of 50 μg mL−1, suggesting the formation of aggregates (Fig. 6a). After that, cell-based DMR assays were used to evaluate the promiscuity. DMR agonism assay with high response suggested the high possibility of aggregate induced promiscuity, and this was further proved by the detergent assay (Fig. 6b). We next performed DMR desensitization assays on several unrelated targets including M3, GPR35, neurotensin receptor (NTSR) and epidermal growth factor receptor (EGFR). The concentrations selected were 50, 25, 12.5 μg mL−1, which were routinely used for natural extracts screening. Results showed that all the receptors were dose-dependent desensitized at theses concentrations (Fig. 7a–d). In combination with DMR agonism assay and the corresponding detergent assay, we believed that the desensitization of these targets was promiscuous result rather than the multi-target effect arising from the multi-components in the extract.
To eliminate the promiscuous activities, the crude extract was next processed with a positive charged resin. We then examined the response of the treated extract on cell-free aggregation assay at the concentration of 50 μg mL−1. Result showed that no significant response was observed (Fig. 6a). The HPLC analysis also proved the disappearance of the “hump” which was supposed to be polyphenols (Fig. 6c). These results suggested that the aggregators in the crude extract was successfully removed. A further examination of the treated extract on DMR desensitization assays indicated that only GPR35 receptor was dose-dependently desensitized, while other three targets remained unaffected (Fig. 7e–h).
Taken together, RWG based assays can detect NP aggregators and make the activity results more reliable in the discovery of lead compounds, and therefore reduce the risk in bioassay-guided drug discovery procedure.
4. Conclusions
In this work, a series of RWG based assays for colloidal aggregates detection and their promiscuity characterization were developed. Moreover, these assays were performed on a single platform, therefore the detecting and controls for aggregation could be readily conducted. Cell-free aggregation assay was first used to directly characterize eight well-known aggregate compounds and their critical aggregation concentrations. Then, cell-based DMR assays were performed to investigate the effect of natural compound aggregators on GPCRs. On addition of tween-80, the promiscuous compounds displayed decreased potency and efficacy. Finally, these assays were successfully applied to the detection of NP extract aggregators and made the activity result more reliable. This study highlights the great potential of RWG based assays in the detection of compound aggregators and helps to eliminate the false activities in drug discovery from natural products.Conflicts of interest
The authors declare no competing financial interest.Acknowledgements
This work was supported by the State Key Program of National Natural Science of China (U1508221), Project of National Science Foundation of China (81803706), Project of National Science Foundation of China (31670374), innovation program of science and research from DICP, CAS (DICP ZZBS201803) and the funding for the construction of DICP-CMC Innovation Institute of Medicine.References
- R. Macarron, M. N. Banks, D. Bojanic, D. J. Burns, D. A. Cirovic, T. Garyantes, D. V. Green, R. P. Hertzberg, W. P. Janzen and J. W. Paslay, Impact of high-throughput screening in biomedical research, Nat. Rev. Drug Discovery, 2011, 10, 188–195 CrossRef CAS PubMed.
- J. B. Baell, Screening-based translation of public research encounters painful problems, ACS Med. Chem. Lett., 2015, 6, 229–234 CrossRef CAS.
- R. F. Bruns and I. A. Watson, Rules for identifying potentially reactive or promiscuous compounds, J. Med. Chem., 2012, 55, 9763–9772 CrossRef CAS PubMed.
- S. Zhou, E. Chan, W. Duan, M. Huang and Y. Z. Chen, Drug bioactivation covalent binding to target proteins and toxicity relevance, Drug Metab. Rev., 2005, 37, 41–213 CrossRef CAS PubMed.
- A. B. Shapiro, G. K. Walkup and T. A. Keating, Correction for interference by test samples in high-throughput assays, J. Biomol. Screening, 2009, 14, 1008–1016 CrossRef CAS PubMed.
- A. Simeonov, A. Jadhav, C. J. Thomas, Y. Wang, R. Huang, N. T. Southall, P. Shinn, J. Smith, C. P. Austin and D. S. Auld, Fluorescence spectroscopic profiling of compound libraries, J. Med. Chem., 2008, 51, 2363–2371 CrossRef CAS.
- D. S. Auld, N. T. Southall, A. Jadhav, R. L. Johnson, D. J. Diller, A. Simeonov, C. P. Austin and J. Inglese, Characterization of chemical libraries for luciferase inhibitory activity, J. Med. Chem., 2008, 51, 2372–2386 CrossRef CAS.
- B. Y. Feng, A. Simeonov, A. Jadhav, K. Babaoglu, J. Inglese, B. K. Shoichet and C. P. Austin, A high-throughput screen for aggregation-based inhibition in a large compound library, J. Med. Chem., 2007, 50, 2385–2390 CrossRef CAS.
- N. Thorne, D. S. Auld and J. Inglese, Apparent activity in high-throughput screening: origins of compound-dependent assay interference, Curr. Opin. Chem. Biol., 2010, 14, 315–324 CrossRef CAS PubMed.
- B. Y. Feng, A. Shelat, T. N. Doman, R. K. Guy and B. K. Shoichet, High-throughput assays for promiscuous inhibitors, Nat. Chem. Biol., 2005, 1, 146–148 CrossRef CAS PubMed.
- S. L. McGovern, B. T. Helfand, B. Feng and B. K. Shoichet, A specific mechanism of nonspecific inhibition, J. Med. Chem., 2003, 46, 4265–4272 CrossRef CAS PubMed.
- M. F. Sassano, A. K. Doak, B. L. Roth and B. K. Shoichet, Colloidal aggregation causes inhibition of G protein-coupled receptors, J. Med. Chem., 2013, 56, 2406–2414 CrossRef CAS PubMed.
- K. E. Coan, D. A. Maltby, A. L. Burlingame and B. K. Shoichet, Promiscuous aggregate-based inhibitors promote enzyme unfolding, J. Med. Chem., 2009, 52, 2067–2075 CrossRef CAS PubMed.
- K. E. Coan and B. K. Shoichet, Stoichiometry and physical chemistry of promiscuous aggregate-based inhibitors, J. Am. Chem. Soc., 2008, 130, 9606–9612 CrossRef CAS.
- S. C. Owen, A. K. Doak, P. Wassam, M. S. Shoichet and B. K. Shoichet, Colloidal aggregation affects the efficacy of anticancer drugs in cell culture, ACS Chem. Biol., 2012, 7, 1429–1435 CrossRef CAS.
- D. Duan, A. K. Doak, L. Nedyalkova and B. K. Shoichet, Colloidal aggregation and the in vitro activity of traditional Chinese medicines, ACS Chem. Biol., 2015, 10, 978–988 CrossRef CAS PubMed.
- R. Sink, S. Gobec, S. Pecar and A. Zega, False positives in the early stages of drug discovery, Curr. Med. Chem., 2010, 17, 4231–4255 CrossRef CAS.
- M. G. Weller, A unifying review of bioassay-guided fractionation, effect-directed analysis and related techniques, Sensors, 2012, 12, 9181–9209 CrossRef CAS PubMed.
- D. Camp, R. A. Davis, E. A. Evans-Illidge and R. J. Quinn, Guiding principles for natural product drug discovery, Future Med. Chem., 2012, 4, 1067–1084 CrossRef CAS PubMed.
- J. B. Baell, Feeling nature's PAINS: natural products, natural product drugs, and pan assay interference compounds (PAINS), J. Nat. Prod., 2016, 79, 616–628 CrossRef CAS PubMed.
- J. Bisson, J. B. McAlpine, J. B. Friesen, S.-N. Chen, J. Graham and G. F. Pauli, Can invalid bioactives undermine natural product-based drug discovery?, J. Med. Chem., 2015, 59, 1671–1690 CrossRef PubMed.
- A. G. Atanasov, B. Waltenberger, E.-M. Pferschy-Wenzig, T. Linder, C. Wawrosch, P. Uhrin, V. Temml, L. Wang, S. Schwaiger and E. H. Heiss, Discovery and resupply of pharmacologically active plant-derived natural products: A review, Biotechnol. Adv., 2015, 33, 1582–1614 CrossRef CAS PubMed.
- C. J. Henrich and J. A. Beutler, Matching the power of high throughput screening to the chemical diversity of natural products, Nat. Prod. Rep., 2013, 30, 1284–1298 RSC.
- S. L. McGovern, E. Caselli, N. Grigorieff and B. K. Shoichet, A common mechanism underlying promiscuous inhibitors from virtual and high-throughput screening, J. Med. Chem., 2002, 45, 1712–1722 CrossRef CAS PubMed.
- J. Seidler, S. L. McGovern, T. N. Doman and B. K. Shoichet, Identification and prediction of promiscuous aggregating inhibitors among known drugs, J. Med. Chem., 2003, 46, 4477–4486 CrossRef CAS PubMed.
- C. Dalvit, D. Caronni, N. Mongelli, M. Veronesi and A. Vulpetti, NMR-based quality control approach for the identification of false positives and false negatives in high throughput screening, Curr. Drug Discovery Technol., 2006, 3, 115–124 CrossRef CAS PubMed.
- S. R. LaPlante, R. Carson, J. Gillard, N. Aubry, R. Coulombe, S. Bordeleau, P. Bonneau, M. Little, J. O'Meara and P. L. Beaulieu, Compound aggregation in drug discovery: implementing a practical NMR assay for medicinal chemists, J. Med. Chem., 2013, 56, 5142–5150 CrossRef CAS PubMed.
- S. R. LaPlante, N. Aubry, G. Bolger, P. Bonneau, R. Carson, R. Coulombe, C. Sturino and P. L. Beaulieu, Monitoring drug self-aggregation and potential for promiscuity in off-target in vitro pharmacology screens by a practical NMR strategy, J. Med. Chem., 2013, 56, 7073–7083 CrossRef CAS.
- J. R. Huth, R. Mendoza, E. T. Olejniczak, R. W. Johnson, D. A. Cothron, Y. Liu, C. G. Lerner, D. Chen and P. J. Hajduk, ALARM NMR: a rapid and robust experimental method to detect reactive false positives in biochemical screens Huth, J. Am. Chem. Soc., 2005, 127, 217–224 CrossRef CAS.
- D. H. Randle, K. A. Krebs, H. J. Gitschier and T. M. Upton, Label-Free Detection of Compound Aggregation Using Corning® Epic® Technology, https://www.corning.com/media/worldwide/cls/documents/snappshots_Label-Free_Detection_of_Compound_Aggregation_using_Corning_Epic_technology.pdf, 2011 Search PubMed.
- J. M. Blevitt, M. D. Hack, K. L. Herman, P. F. Jackson, P. J. Krawczuk, A. D. Lebsack, A. X. Liu, T. Mirzadegan, M. I. Nelen and A. N. Patrick, Structural basis of small-molecule aggregate induced inhibition of a protein-protein interaction, J. Med. Chem., 2017, 60, 3511–3517 CrossRef CAS PubMed.
- Y. Fang, Label-free cell-based assays with optical biosensors in drug discovery, Assay Drug Dev. Technol., 2006, 4, 583–595 CrossRef CAS.
- A. M. Ferrie, Q. Wu and Y. Fang, Resonant waveguide grating imager for live cell sensing, Appl. Phys. Lett., 2010, 97, 223704 CrossRef PubMed.
- Y. Fang, A. M. Ferrie, N. H. Fontaine and P. K. Yuen, Characteristics of dynamic mass redistribution of epidermal growth factor receptor signaling in living cells measured with label-free optical biosensors, Anal. Chem., 2005, 77, 5720–5725 CrossRef CAS PubMed.
- Y. Fang, A. M. Ferrie, N. H. Fontaine, J. Mauro and J. Balakrishnan, Resonant waveguide grating biosensor for living cell sensing, Biophys. J., 2006, 91, 1925–1940 CrossRef CAS PubMed.
- N. Orgovan, B. Kovacs, E. Farkas, B. l. SzabÃ, N. Zaytseva, Y. Fang and R. Horvath, Bulk and surface sensitivity of a resonant waveguide grating imager, Appl. Phys. Lett., 2014, 104, 083506 CrossRef.
- Y. Fang, G. Li and A. M. Ferrie, Non-invasive optical biosensor for assaying endogenous G protein-coupled receptors in adherent cells, J. Pharmacol. Toxicol. Methods, 2007, 55, 314–322 CrossRef CAS.
- Y. Fang, A. G. Frutos and R. Verklereen, Label-free cell-based assays for GPCR screening, Comb. Chem. High Throughput Screening, 2008, 11, 357–369 CrossRef CAS PubMed.
- R. Schröder, J. Schmidt, S. BlÃttermann, L. Peters, N. Janssen, M. Grundmann, W. Seemann, D. Kaufel, N. Merten and C. Drewke, Applying label-free dynamic mass redistribution technology to frame signaling of G protein-coupled receptors noninvasively in living cells, Nat. Protoc., 2011, 6, 1748–1760 CrossRef PubMed.
- Y. Fang, Non-invasive optical biosensor for probing cell signaling, Sensors, 2007, 7, 2316–2329 CrossRef CAS PubMed.
- J. Baell and M. A. Walters, Chemistry: Chemical con artists foil drug discovery, Nature, 2014, 513, 481–483 CrossRef CAS PubMed.
- L. Pohjala and P. i. Tammela, Aggregating behavior of phenolic compounds-a source of false bioassay results?, Molecules, 2012, 17, 10774–10790 CrossRef CAS PubMed.
- H. Deng, C. Wang, M. Su and Y. Fang, Probing biochemical mechanisms of action of muscarinic M3 receptor antagonists with label-free whole cell assays, Anal. Chem., 2012, 84, 8232–8239 CrossRef CAS PubMed.
- A. J. Ryan, N. M. Gray, P. N. Lowe and C.-w. Chung, Effect of detergent on “promiscuous” inhibitors, J. Med. Chem., 2003, 46, 3448–3451 CrossRef CAS PubMed.
- B. Y. Feng and B. K. Shoichet, A detergent-based assay for the detection of promiscuous inhibitors, Nat. Protoc., 2006, 1, 550–553 CrossRef CAS PubMed.
- A. L. Harvey, R. Edrada-Ebel and R. J. Quinn, The re-emergence of natural products for drug discovery in the genomics era, Nat. Rev. Drug Discovery, 2015, 14, 111–129 CrossRef CAS PubMed.
- A. Panossian, G. Wikman and J. Sarris, Rosenroot (Rhodiola rosea): traditional use, chemical composition, pharmacology and clinical efficacy, Phytomedicine, 2010, 17, 481–493 CrossRef CAS PubMed.
Footnote |
| † Electronic supplementary information (ESI) available. See DOI: 10.1039/c9ra06466d |
| This journal is © The Royal Society of Chemistry 2019 |

