DOI:
10.1039/C9RA06133A
(Paper)
RSC Adv., 2019,
9, 33222-33228
NCPCDA: network consistency projection for circRNA–disease association prediction†
Received
7th August 2019
, Accepted 3rd October 2019
First published on 16th October 2019
Abstract
A growing body of evidence indicates that circular RNAs (circRNAs) play a pivotal role in various biological processes and have a close association with the initiation and progression of diseases. Moreover, circRNAs are considered as promising biomarkers for disease diagnosis owing to their characteristics of conservation, stability and universality. Inferring disease–circRNA relationships will contribute to the understanding of disease pathology. However, it is costly and laborious to discover novel disease–circRNA interactions by wet-lab experiments, and few computational methods have been devoted to predicting potential circRNAs for diseases. Here, we advance a computational method (NCPCDA) to identify novel circRNA–disease associations based on network consistency projection. For starters, we make use of multi-view similarity data, including circRNA functional similarity, disease semantic similarity, and association profile similarity, to construct the integrated circRNA similarity and disease similarity. Then, we project circRNA space and disease space on the circRNA–disease interaction network, respectively. Finally, we can obtain the predicted circRNA–disease association score matrix by combining the above two space projection scores. Simulation results show that NCPCDA can efficiently infer disease–circRNA relationships with high accuracy, obtaining AUCs of 0.9541 and 0.9201 in leave-one-out cross validation and five-fold cross validation, respectively. Furthermore, case studies also suggest that NCPCDA is promising for discovering new disease–circRNA interactions. The NCPCDA dataset and code, as well as the detailed readme file for our code, can be downloaded from Github (https://github.com/ghli16/NNCPCD).
Introduction
Circular RNAs (circRNAs), a new category of noncoding endogenous RNA molecules, are generated by back-splicing of a single pre-mRNA and have a closed loop structure.1 For many years, circRNAs were initially thought to be splicing errors.2 Nonetheless, as high-throughput sequencing technology has developed, circRNAs have been shown to be widespread in various living organisms and garnered wide attention.3–6 Previous studies showed that circRNAs play a part in regulating the expression of genes as they function as microRNA sponges.7 For instance, Cdr1as has been experimentally verified to work as a miR-7a sponge and to be involved in regulating the expression of SP1 and PARP.8 Importantly, the expression levels of circRNAs are generally tissue-specific and cell-type-specific.9 Consequently, circRNA misexpression can lead to abnormal physiological processes and account for the initiation and progression of most diseases.10
In recent years, an increasing number of circRNAs have been shown to function as tumor suppressors or oncogenes in various cancers.11,12 For example, Han et al. found that hsa_circ_0007874 inhibits the progression of hepatocellular carcinoma and promotes p21 expression by sponging miR-9.13 Likewise, hsa_circRNA_000479 serves as a sponge for miR-6809 and miR-4753 to modulate the expression of oncogene BCL11A, which can promote the proliferation of triple-negative breast cancer cells.14 CircCCDC66 is found to be correlated with poor prognosis of colorectal carcinoma and is up-regulated in various tumor tissues.15 High expression of circPVT1 in gastric cancer is closely related to a longer survival rate, suggesting that it is a prognostic marker for the disease.16 To summarise, both down-regulation and up-regulation of circRNAs in tumor cells shows that they may have the potential to be novel biomarkers and therapeutic targets. However, the current research on disease–circRNA relationships is highly dependent on biological experiments, such as qRT-PCR and circRNAs chips, which are time-consuming and costly. In this case, only a limited number of relationships can be discovered.
Encouragingly, several manually curated databases of disease–circRNA interactions have become available, such as circRNADisease17 and CircR2Disease,18 which both collect experimentally verified associations by reviewing published literature. The establishment of disease–circRNA association datasets could provide an important foundation for predicting potential disease-related circRNAs using computational models. Recently, a lot of effort has gone into mining latent disease–circRNA pairs under the hypothesis that similar circRNAs are likely to have similar association profiles with the same disease. Lei et al.19 conducted a pioneer study in which they integrated a known disease–circRNA interaction network and multiple similarity networks for circRNAs and diseases into a heterogeneous network and presented a path-weighted method to excavate underlying disease-related circRNAs by counting the accumulative weights from paths with limited lengths in the constructed network. Likewise, Fan et al.20 devised a KATZ-based model to quantify the association probability for each disease–circRNA pair by counting the number of walks with limited lengths between them on an established heterogeneous network, which was made up of a known disease–circRNA interaction matrix, a disease similarity matrix and a circRNA similarity matrix. Afterwards, Yan et al.21 designed a semi-supervised model based on Kronecker regularized least squares, which made predictions on a single circRNA–disease space by Kronecker product and capitalized on a preprocessing step to improve predictions for new circRNA nodes and disease nodes. Xiao et al.22 developed a novel model to recover the missing disease–circRNA interactions based on a low-rank approximation algorithm, which effectively combined manifold regularized constraints and produced reliable predictions. Recently, Wei et al.23 constructed a circRNA–disease association probability matrix based on the neighbor interaction profiles. Specifically, this method prioritized disease-associated circRNAs by applying matrix factorization to the reconstructed association probability matrix. Zhang et al.24 used a linear neighborhood to reconstruct the disease and circRNA similarity data, and then employed label propagation to measure the relevance between disease nodes and circRNA nodes. In addition, the advances in link prediction research in bioinformatics have also provided some valuable insights into the development of disease–circRNA interaction prediction (e.g., synergistic drug combinations,25 disease–lncRNA,26,27 disease–miRNA,28,29 and drug–target interaction prediction).30 However, because of the incompleteness of the current datasets, it is still a challenge to achieve sufficiently accurate results for the prediction task.
In the present study, we advance a network consistency projection method (NCPCDA) for undiscovered circRNA–disease interaction predictions. In particular, NCPCDA implements a network consistency projection on the integrated circRNA similarity and disease similarity network to score circRNA–disease pairs. Simulation results under leave-one-out cross validation and five-fold cross validation evidently demonstrate that NCPCDA performs better than previous models. Moreover, the case study carried out on lung cancer also suggests that our method is promising for identifying novel prognostic biomarkers.
Materials and methods
Human circRNA–disease associations
The known circRNA–disease association dataset was retrieved from the CircR2Disease database,18 which contains 739 experimentally confirmed interactions for 100 diseases and 661 circRNAs. After removing redundant entries from different literature and those relationships associated with mice and rats, we finally obtained a dataset consisting of 88 diseases, 585 circRNAs and 650 associations for humans. Formally, let C = {c1, c2, …, cm} and D = {d1, d2, …, dn} be the sets of m circRNAs and n diseases in the dataset, respectively. Thus, the binary matrix Y ∈ Rm×n of circRNA–disease interactions can be constructed, where Y(i, j) = 1 if circRNA ci is connected to disease dj, and 0 otherwise.
Disease semantic similarity
Inspired by the successful application of disease semantic similarity in prioritizing reliable disease-associated ncRNAs,31–36 we also capitalize on this similarity to enhance our predictions. As described in,37 semantic similarities among diseases can be calculated according to their corresponding disease ontology,38 which is organized as a directed acyclic graph. The disease ontology term for each disease in our analysis is retrieved from http://disease-ontology.org/. For two sets of disease ontology terms, we computed their similarity scores by using the “doSim” function in the DOSE software package.39 For convenience, we use SS ∈ Rn×n to represent the semantic similarity matrix among n diseases.
CircRNA functional similarity
To quantify the functional similarity between circRNAs, the previous methods used for calculating the functional similarity between lncRNAs or miRNAs are extended.34,37 According to the previous work, evaluating the semantic similarity of two disease sets, which are linked with two circRNAs, can infer the function similarity of these two circRNAs. Particularly, we assumed that Di and Dj were respectively the disease groups associated with circRNA ci and circRNA cj. Denote FS as the circRNA function similarity matrix, then the similarity between circRNA ci and circRNA cj can be computed by the following formulas:| |
 | (1) |
| |
 | (2) |
where S(dp, Dj) is the similarity between disease dp related to circRNA ci and disease set Dj related to circRNA cj.
As stated in the previous section, the disease semantic similarity can be calculated based on disease ontology terms. However, we cannot obtain a disease ontology term for each disease. This means we are unable to measure the semantic similarities for those diseases without disease ontology terms. Therefore, association profile similarity is further introduced.
Association profile similarity for circRNAs and diseases
Association profile similarity is an effective topology similarity for diseases and circRNAs. For a specific circRNA ci, the association profile of ci is a binary vector, which is extracted from the i-th row vector of the circRNA–disease interaction matrix Y, i.e. Y(i, :). Then, according to the Gaussian kernel function, we calculate the similarity between circRNA ci and circRNA cj as follows:| | |
KC(ci, cj) = exp(−γc‖Y(i, :) − Y(j, :)‖2)
| (3) |
| |
 | (4) |
where γc, which is used to control the kernel bandwidth, is computed by normalizing the average number of diseases related to each circRNA.
Similarly, we also define disease association profile similarity as follows:
| | |
KD(di, dj) = exp(−γd‖Y(:, i) − Y(:, j)‖2)
| (5) |
| |
 | (6) |
where
Y(:,
i) indicates the interaction profile of disease
di and
γd is computed similarly to
γc.
Integrated similarity for circRNAs and diseases
Considering that we cannot obtain circRNA functional similarity for all circRNAs in our dataset, we integrate functional similarity FS and association profile similarity KC to construct the circRNA similarity matrix CS. Particularly, for a given circRNA ci and circRNA cj, the value of CS(ci, cj) is KC(ci, cj) if FS(ci, cj) = 0, otherwise FS(ci, cj). The integration can be written as follows:| |
 | (7) |
Similarly, for disease, we combine semantic similarity SS with association profile similarity KD to obtain the disease similarity matrix DS, which can be presented as follows:
| |
 | (8) |
NCPCDA method
In this work, we develop a novel computational method NCPCDA to identify undiscovered circRNA–disease interactions by using network consistency projection,40,41 which is under the assumption that similar circRNAs (or diseases) may well associate with the same disease (or circRNA). Fig. 1 illustrates the implementation framework of NCPCDA, which is implemented based on known circRNA–disease association information and the integrated circRNA similarity and disease similarity.
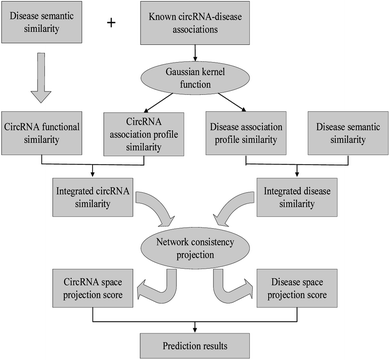 |
| | Fig. 1 The overall workflow of the NCPCDA method. | |
NCPCDA is composed of disease space projection and circRNA space projection. Specifically, we use disease space projection and circRNA space projection to denote the projection of the disease similarity network and the circRNA similarity network on the disease–circRNA interaction network, respectively. By using vector form, circRNA space projection can be computed by:
| |
 | (9) |
where CS(
i, :), which indicates the similarities between circRNA
ci and all circRNAs, is the
i-th row vector of matrix CS;
Y(:,
j), which encodes the correlations between disease
dj and all circRNAs, is the
j-th column of matrix
Y; |
Y(:,
j)| denotes the norm of vector
Y(:,
j). As a result, the vector projection of CS(
i, :) on
Y(:,
j) can be obtained, represented as CSP(
i,
j), and we use CSP ∈
Rm×n to denote the circRNA space projection matrix. According to vector space theory, the projection score CSP(
i,
j) is positively related to the similarities between circRNA
ci and all circRNAs, to the number of circRNAs associated with disease
dj, while it is negatively related to the angle between CS(
i, :) and
Y(:,
j).
In a similar manner, disease space projection can be presented as follows:
| |
 | (10) |
where DS(:,
j) and
Y(
i, :) are two vectors extracted from the
j-th column of disease similarity matrix DS and the
i-th row of interaction matrix
Y, respectively. As a result, the vector projection of DS(:,
j) on
Y(
i, :) can be obtained, denoted as DSP(
i,
j), and we use DSP ∈
Rm×n to represent the disease space projection matrix.
Based on network consistency projection theory, the above two projections scores CSP and DSP could be integrated and normalized by the following formula:
| |
 | (11) |
where NCP(
i,
j) is the final predictive score of circRNA
ci and disease
dj. Since
i and
j represent any row and column in matrix NCP separately, we can simultaneously obtain the relevance of each circRNA–disease pair.
Results and discussion
Evaluation metrics
We used leave-one-out cross validation and five-fold cross validation to investigate the general prediction performance of NCPCDA. In each leave-one-out cross validation trial, we select a known disease–circRNA association from our dataset in turn as the test sample and suppose this selected pair is unknown in our training samples. All other labeled disease–circRNA pairs and those unobserved pairs are taken as the training set and candidate samples, respectively. For five-fold cross validation, all labeled disease–circRNA pairs are partitioned into five parts at random. One of them is chosen as the test data and the other four parts as training data in turn. In order to eliminate the sampling deviation, we performed ten repetitions of this process. The predictive performance is explained by the receiver operating characteristic (ROC) curve, which draws the false positive rate (FPR) and the true positive rate (TPR) over different score thresholds. Then, we can calculate the area under the curve (AUC) and utilize it as the main metric for prediction accuracy. Given that association profile similarity and circRNA functional similarity depend on known disease–circRNA relationships, they should be recalculated in each fold.
Comparison with other methods
To comparatively illustrate the superiority of NCPCDA, we compare it with PWCDA,19 KATZHCDA,20 DWNN-RLS,21 and CD-LNLP24 as state-of-the-art disease–circRNA interaction prediction approaches. All five prediction methods are evaluated based on the CircR2Disease dataset by adopting leave-one-out cross validation and five-fold cross validation. In Fig. 2, we show the ROC curves of the methods considered here and report their respective AUC values in terms of leave-one-out cross validation. It shows that the ROC curve of NCPCDA is above those of PWCDA, KATZHCDA, DWNN-RLS, and CD-LNLP in most cases, and the AUC score of NCPCDA is up to 0.9541, which is superior to those of the others (PWCDA: 0.9000; KATZHCDA: 0.8672; DWNN-RLS: 0.9180; CD-LNLP: 0.9012). Furthermore, we compared the ROC curves based on five-fold cross validation, which are shown in Fig. 3. The average AUC of NCPCDA reaches 0.9201, while the average AUCs of PWCDA, KATZHCDA, DWNN-RLS, and CD-LNLP are 0.8900, 0.8632, 0.6503, and 0.7996, respectively. All the above results suggest that NCPCDA provides a great improvement in prioritizing disease–circRNA candidates.
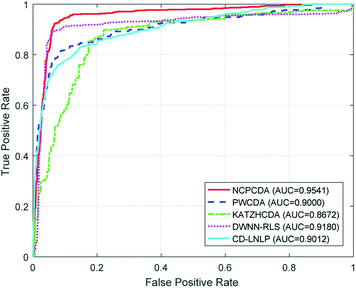 |
| | Fig. 2 The ROC curves of different models under leave-one-out cross validation. | |
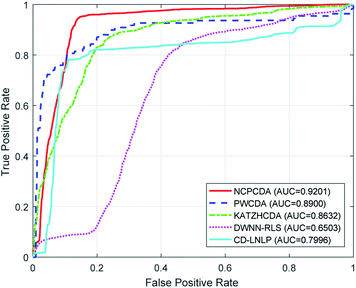 |
| | Fig. 3 The ROC curves of different models under five-fold cross validation. | |
Case studies
In order to examine the ability of NCPCDA to prioritize novel circRNA biomarkers for some cancers, we mainly investigated the following two groups of case studies of lung neoplasms. In the first group, we build the NCPCDA model by using all known disease–circRNA associated pairs from the CircR2Disease dataset and then verify our predictions in another two databases: circRNADisease and Circ2Disease.42 Meanwhile, the experimental literature was searched using PubMed for evidence. The top 20 candidate circRNAs for lung cancer are detailed in Table 1, and we confirm four candidates contained in circRNADisease. These four candidate circRNAs, hsa_circ_0043256, hsa_circ_0013958, circHIPK3, and circRNA_100876, are all found to be up-regulated in lung cancer cells,43–46 three of which are also found in Circ2Disease. Besides, we found literature to support nine predicted circRNAs; see the prediction lists marked as ‘PMID’ in Table 1. As a result, 13 of 20 predictions are validated to be associated with this disease.
Table 1 The top-20 newly discovered circRNAs for lung cancer predicted by NCPCDA
| Rank |
circRNAs |
Evidence |
| 1 |
hsa_circ_0007385 |
PMID: 29372377 |
| 2 |
hsa_circ_0014130 |
PMID: 29440731 |
| 3 |
hsa_circ_0016760 |
Unconfirmed |
| 4 |
hsa_circ_0043256 |
circRNADisease |
| 5 |
hsa_circ_0012673 |
PMID: 29366790 |
| 6 |
hsa_circRNA_404833 |
PMID: 29241190 |
| 7 |
hsa_circRNA_006411 |
PMID: 29241190 |
| 8 |
hsa_circRNA_401977 |
PMID: 29241190 |
| 9 |
hsa_circ_0013958 |
circRNADisease, Circ2Disease |
| 10 |
circ-Foxo3/hsa_circ_0006404 |
PMID: 29620202 |
| 11 |
hsa_circRNA_100782/circHIPK3/hsa_circ_0000284 |
circRNADisease, Circ2Disease |
| 12 |
hsa_circ_0023404/circRNA_100876/circ-CER |
circRNADisease, Circ2Disease |
| 13 |
circPRKCI/hsa_circ_0067934 |
PMID: 29588350 |
| 14 |
hsa_circRNA_100855/hsa_circ_0023028 |
Unconfirmed |
| 15 |
hsa_circRNA_104912/hsa_circ_0088442 |
Unconfirmed |
| 16 |
hsa_circRNA_103110/hsa_circ_103110/hsa_circ_0004771 |
Unconfirmed |
| 17 |
hsa_circ_0001313/circCCDC66 |
Unconfirmed |
| 18 |
hsa_circRNA_102049 |
Unconfirmed |
| 19 |
hsa_circ_0001649 |
Unconfirmed |
| 20 |
CDR1as/ciRS-7/hsa_circ_0001946 |
PMID: 30841451 |
In the second group, by removing all known associated pairs of a certain disease from our training samples, we establish the NCPCDA model and make some necessary predictions for such a disease. The top-ranked predictions for lung cancer are listed in Table 2. As the results show, 4 of the top 20 potential circRNAs are known to be associated in CircR2Disease. Note that there are only six known circRNAs associated with this cancer in our benchmark dataset. Thus, the recall rate is 66.67% for the top 20 candidates. Moreover, circRNAs circHIPK3 and circZFR are supported by the two aforementioned databases (i.e., circRNADisease and Circ2Disease) or the literature. In addition, we select all known associated pairs of each disease in turn as test samples and carry out predictions. Finally, NCPCDA obtains comparable results with an AUC of 0.9147. These case studies further manifest the applicability of NCPCDA in predicting unobserved disease–circRNA relationships with confidence. The predicted circRNAs for all diseases are provided in ESI Table S1.†
Table 2 The top-20 candidate circRNAs for lung cancer predicted by NCPCDA by eliminating all known associated pairs of this disease
| Rank |
circRNAs |
Evidence |
| 1 |
circMAN2B2/hsa_circRNA_103595 |
CircR2Disease |
| 2 |
circRNA_102231 |
CircR2Disease |
| 3 |
hsa_circ_0000064 |
CircR2Disease |
| 4 |
hsa_circRNA_100782/circHIPK3/hsa_circ_0000284 |
circRNADisease, Circ2Disease |
| 5 |
hsa-circRNA 2149 |
Unconfirmed |
| 6 |
circular RNA100783/hsa_circ_0008887 |
Unconfirmed |
| 7 |
circDLGAP4 |
Unconfirmed |
| 8 |
circR-284 |
Unconfirmed |
| 9 |
circRNA_104983/hsa_circ_0089974 |
Unconfirmed |
| 10 |
circRNA_001059/hsa_circ_0000554 |
Unconfirmed |
| 11 |
circRNA_100984/hsa_circ_0002019 |
Unconfirmed |
| 12 |
circRNA_100367/hsa_circ_0014879 |
Unconfirmed |
| 13 |
circRNA_101877/hsa_circ_0004519 |
Unconfirmed |
| 14 |
circRNA_000695/hsa_circ_0001336 |
Unconfirmed |
| 15 |
circRNA_101419/hsa_circ_0032832 |
Unconfirmed |
| 16 |
circFUT8/hsa_circRNA_101368/hsa_circ_0003028 |
Unconfirmed |
| 17 |
circIPO11/hsa_circRNA_103847/hsa_circ_0007915 |
Unconfirmed |
| 18 |
hsa_circ_0001313/circCCDC66 |
Unconfirmed |
| 19 |
circPVT1/hsa_circ_0001821 |
CircR2Disease |
| 20 |
circZFR/hsa_circRNA_103809/hsa_circ_0072088 |
PMID: 29698681 |
We further count the number of true positives under different top portions. As exhibited in Fig. 4, among the 650 true positives, 539 (or 82.92%) interactions are successfully detected in the top 20 predicted pairs. Additionally, we count the results based on the circRNADisease dataset, which collects 332 human disease–circRNA interactions between 40 diseases and 313 circRNAs. As shown in Fig. 5, NCPCDA can detect 260 (or 78.31%) true positives in the top 20 predicted pairs. In order to demonstrate the robustness of our model, five-fold cross validation is also implemented on the circRNADisease dataset. As a result, the average AUC of NCPCDA is up to 0.9367, which is superior to those of three state-of-the-art predictors (KATZHCDA:20 0.8608; MRLDC:22 0.8798; CD-LNLP:24 0.9007). This finding illustrates that NCPCDA is effective in identifying true disease–circRNA associations with high rankings.
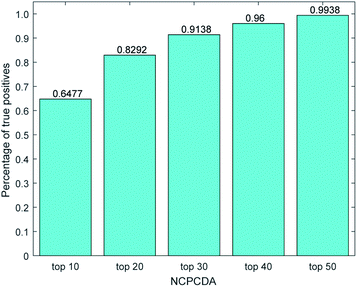 |
| | Fig. 4 The percentage of predicted true positives by NCPCDA under different rankings based on the CircR2Disease dataset. | |
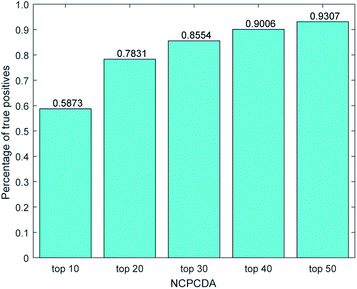 |
| | Fig. 5 The percentage of predicted true positives by NCPCDA under different rankings based on the circRNADisease dataset. | |
Complexity analysis of NCPCDA
The running time of the NCPCDA algorithm is mainly dominated by the computation of the similarity matrix and the network consistency projection score. With regard to similarity data, constructing the circRNA similarity matrix and the disease similarity matrix needs O(m2n) and O(n2m), respectively, where m is the size of the circRNA set and n is the size of the disease set in our dataset. For the NCPCDA method, computing the circRNA space projection matrix and the disease space projection matrix also requires O(m2n) and O(n2m), respectively. Thus, the computational complexity of the NCPCDA algorithm is O(m2n + n2m).
Conclusions
It has been found that circRNAs are associated with various human diseases and have introduced a new dawn in disease diagnosis and prognosis. In this paper, circRNA functional similarity, disease semantic similarity, and association profile similarity are integrated to construct the integrated circRNA similarity and disease similarity. Subsequently, a network consistency projection model is employed to uncover the potential connections between circRNAs and diseases by projecting circRNA space and disease space on the circRNA–disease association network, respectively. We compared NCPCDA with PWCDA, KATZHCDA, and DWNN-RLS. The comparative experiments illustrate that our method is powerful in inferring more disease-associated circRNA candidates. Besides, two groups of case studies on lung cancer were implemented, which further showed the good prediction ability of NCPCDA.
The superiorities of NCPCDA over other alternatives are three-fold: (1) it inherits the advantages of a network algorithm, which can fully make use of the topological information of a heterogeneous network; (2) it is a non-parametric algorithm, which can simplify the process of prediction and shorten the prediction time; and (3) it can simultaneously excavate underlying circRNAs for all diseases in our dataset, especially for isolated diseases. Though NCPCDA is simple and effective, it still has several limitations. For starters, the final integrated score is obtained by averaging the circRNA space projection and the disease space projection, which may result in suboptimal predictions. In addition, as the calculation of circRNA similarity is connected with known circRNA–disease links, NCPCDA fails to infer interactions for new circRNAs that do not have any relationship with diseases. Therefore, integrating different types of circRNA data sources, like circRNA sequence data and miRNA-circRNA association data, may aid in expanding our model to predict new circRNAs and improve prediction accuracy.
Conflicts of interest
There are no conflicts to declare.
Acknowledgements
This work was supported by the National Natural Science Foundation of China (Grant No. 61862025, 61873089, 61602283, 11862006, 61861017, and 61862023), the Jiangxi Provincial Natural Science Foundation (Grant No. 20181BAB211016, 2018ACB21032, 20181BAB211013, and 20181BAB202007), the Scientific and Technological Research Project of the Education Department in Jiangxi Province (Grant No. GJJ170383), and the Hunan Provincial Natural Science Foundation (Grant No. 2018JJ2024).
References
- Y. Zhang, X.-O. Zhang, T. Chen, J.-F. Xiang, Q.-F. Yin, Y.-H. Xing, S. Zhu, L. Yang and L.-L. Chen, Mol. Cell, 2013, 51, 792–806 CrossRef CAS.
- C. Cocquerelle, B. Mascrez, D. Hétuin and B. Bailleul, FASEB J., 1993, 7, 155–160 CrossRef CAS.
- M. Danan, S. Schwartz, S. Edelheit and R. Sorek, Nucleic Acids Res., 2011, 40, 3131–3142 CrossRef.
- S. Memczak, M. Jens, A. Elefsinioti, F. Torti, J. Krueger, A. Rybak, L. Maier, S. D. Mackowiak, L. H. Gregersen, M. Munschauer, A. Loewer, U. Ziebold, M. Landthaler, C. Kocks, F. le Noble and N. Rajewsky, Nature, 2013, 495, 333–338 CrossRef CAS.
- L. Chen, C. Huang, X. Wang and G. Shan, Curr. Genomics, 2015, 16, 312–318 CrossRef CAS.
- Q. Chu, X. Zhang, X. Zhu, C. Liu, L. Mao, C. Ye, Q.-H. Zhu and L. Fan, Mol. Plant, 2017, 10, 1126–1128 CrossRef CAS.
- T. B. Hansen, T. I. Jensen, B. H. Clausen, J. B. Bramsen, B. Finsen, C. K. Damgaard and J. Kjems, Nature, 2013, 495, 384–388 CrossRef CAS.
- H.-H. Geng, R. Li, Y.-M. Su, J. Xiao, M. Pan, X.-X. Cai and X.-P. Ji, PLOS One, 2016, 11, e0151753 CrossRef PubMed.
- D. Liang and J. E. Wilusz, Genes Dev., 2014, 28, 2233–2247 CrossRef.
- Z. Zhang, T. Yang and J. Xiao, EBioMedicine, 2018, 34, 267–274 CrossRef.
- Q. Shang, Z. Yang, R. Jia and S. Ge, Mol. Cancer, 2019, 18, 6 CrossRef.
- M. Zhang and Y. Xin, J. Hematol. Oncol., 2018, 11, 21 CrossRef.
- D. Han, J. Li, H. Wang, X. Su, J. Hou, Y. Gu, C. Qian, Y. Lin, X. Liu, M. Huang, N. Li, W. Zhou, Y. Yu and X. Cao, Hepatology, 2017, 66, 1151–1164 CrossRef CAS.
- B. Chen, W. Wei, X. Huang, X. Xie, Y. Kong, D. Dai, L. Yang, J. Wang, H. Tang and X. Xie, Theranostics, 2018, 8, 4003–4015 CrossRef CAS.
- K.-Y. Hsiao, Y.-C. Lin, S. K. Gupta, N. Chang, L. Yen, H. S. Sun and S.-J. Tsai, Cancer Res., 2017, 77, 2339–2350 CrossRef CAS.
- J. Chen, Y. Li, Q. Zheng, C. Bao, J. He, B. Chen, D. Lyu, B. Zheng, Y. Xu, Z. Long, Y. Zhou, H. Zhu, Y. Wang, X. He, Y. Shi and S. Huang, Cancer Lett., 2017, 388, 208–219 CrossRef CAS.
- Z. Zhao, K. Wang, F. Wu, W. Wang, K. Zhang, H. Hu, Y. Liu and T. Jiang, Cell Death Dis., 2018, 9, 475 CrossRef.
- C. Fan, X. Lei, Z. Fang, Q. Jiang and F.-X. Wu, Database, 2018, 2018, bay044 CrossRef.
- X. Lei, Z. Fang, L. Chen and F.-X. Wu, Int. J. Mol. Sci., 2018, 19, 3410 CrossRef.
- C. Fan, X. Lei and F.-X. Wu, Int. J. Biol. Sci., 2018, 14, 1950–1959 CrossRef CAS.
- C. Yan, J. Wang and F.-X. Wu, BMC Bioinf., 2018, 19, 520 CrossRef CAS.
- Q. Xiao, J. Luo and J. Dai, IEEE J. Biomed. Health, 2019 DOI:10.1109/JBHI.2019.2891779.
- H. Wei and B. Liu, Briefings Bioinf., 2019 DOI:10.1093/bib/bbz057.
- W. Zhang, C. Yu, X. Wang and F. Liu, IEEE Access, 2019, 7, 83474–83483 Search PubMed.
- X. Chen, B. Ren, M. Chen, Q. Wang, L. Zhang and G. Yan, PLoS Comput. Biol., 2016, 12, e1004975 CrossRef.
- X. Chen and G.-Y. Yan, Bioinformatics, 2013, 29, 2617–2624 CrossRef CAS PubMed.
- X. Chen, C. C. Yan, X. Zhang and Z.-H. You, Briefings Bioinf., 2017, 18, 558–576 CAS.
- X. Chen, L. Wang, J. Qu, N.-N. Guan and J.-Q. Li, Bioinformatics, 2018, 34, 4256–4265 CAS.
- X. Chen, C.-C. Zhu and J. Yin, PLoS Comput. Biol., 2019, 15, e1007209 CrossRef.
- X. Chen, C. C. Yan, X. Zhang, X. Zhang, F. Dai, J. Yin and Y. Zhang, Briefings Bioinf., 2016, 17, 696–712 CrossRef CAS.
- X. Chen, D. Xie, L. Wang, Q. Zhao, Z.-H. You and H. Liu, Bioinformatics, 2018, 34, 3178–3186 CrossRef CAS.
- X. Chen, J. Yin, J. Qu and L. Huang, PLoS Comput. Biol., 2018, 14, e1006418 CrossRef PubMed.
- L. Wang, Z.-H. You, X. Chen, Y.-M. Li, Y.-N. Dong, L.-P. Li and K. Zheng, PLoS Comput. Biol., 2019, 15, e1006865 CrossRef PubMed.
- X. Chen, C. Clarence Yan, C. Luo, W. Ji, Y. Zhang and Q. Dai, Sci. Rep., 2015, 5, 11338 CrossRef.
- C. Liang, S. Yu and J. Luo, PLoS Comput. Biol., 2019, 15, e1006931 CrossRef.
- G. Li, J. Luo, Q. Xiao, C. Liang and P. Ding, J. Biomed. Inf., 2018, 82, 169–177 CrossRef.
- D. Wang, J. Wang, M. Lu, F. Song and Q. Cui, Bioinformatics, 2010, 26, 1644–1650 CrossRef CAS.
- L. M. Schriml, C. Arze, S. Nadendla, Y.-W. W. Chang, M. Mazaitis, V. Felix, G. Feng and W. A. Kibbe, Nucleic Acids Res., 2011, 40, D940–D946 CrossRef PubMed.
- G. Yu, L.-G. Wang, G.-R. Yan and Q.-Y. He, Bioinformatics, 2014, 31, 608–609 CrossRef.
- C. Gu, B. Liao, X. Li and K. Li, Sci. Rep., 2016, 6, 36054 CrossRef CAS PubMed.
- G. Li, J. Luo, C. Liang, Q. Xiao, P. Ding and Y. Zhang, IEEE Access, 2019, 7, 58849–58856 Search PubMed.
- D. Yao, L. Zhang, M. Zheng, X. Sun, Y. Lu and P. Liu, Sci. Rep., 2018, 8, 11018 CrossRef.
- F. Tian, C. T. Yu, W. D. Ye and Q. Wang, Biochem. Biophys. Res. Commun., 2017, 493, 1260–1266 CrossRef CAS.
- X. Zhu, X. Wang, S. Wei, Y. Chen, Y. Chen, X. Fan, S. Han and G. Wu, FEBS J., 2017, 284, 2170–2182 CrossRef CAS.
- F. Tian, Y. Wang, Z. Xiao and X. Zhu, Chin. J. Lung Cancer, 2017, 20, 459–467 Search PubMed.
- J.-T. Yao, S.-H. Zhao, Q.-P. Liu, M.-Q. Lv, D.-X. Zhou, Z.-J. Liao and K.-J. Nan, Pathol., Res. Pract., 2017, 213, 453–456 CrossRef CAS.
Footnote |
| † Electronic supplementary information (ESI) available: One supplemental table is available as an excel file. See DOI: 10.1039/c9ra06133a |
|
| This journal is © The Royal Society of Chemistry 2019 |
Click here to see how this site uses Cookies. View our privacy policy here.  Open Access Article
 *a,
Yingjie Yueb,
Cheng Liangc,
Qiu Xiaod,
Pingjian Dinge and
Jiawei Luo*f


