
 Open Access Article
 This Open Access Article is licensed under a Creative Commons Attribution-Non Commercial 3.0 Unported Licence
16-Tigloyl linked barrigenol-like triterpenoid from Semen Aesculi and its anti-tumor activity in vivo and in vitro†
Yiren
Yang
a,
Liping
Long
a,
Xinxin
Zhang
a,
Kairu
Song
a,
Da
Wang
c,
Xin
Xiong
a,
Huiyuan
Gao
 *a and
Luping
Sha
*b
*a and
Luping
Sha
*b
aSchool of Traditional Chinese Materia Medica, Shenyang Pharmaceutical University, Benxi 117004, People's Republic of China. E-mail: sypugaohy@163.com
bSchool of Pharmaceutical Engineering, Shenyang Pharmaceutical University, Benxi 117004, People's Republic of China. E-mail: shaluping1988@163.com
cSchool of Pharmacy, Shenyang Pharmaceutical University, Shenyang 110016, People's Republic of China
First published on 7th October 2019
Abstract
Barrigenol-like triterpenoids (BATs) showed promising anti-tumor, anti-inflammatory and anti-Alzheimer's activities, while, the inhibitory strength was usually affected by their states with aglycones or glycosides. In order to find more BATs as new anti-tumor agents with much more efficiency, the chemical and pharmaceutical studies were carried out on the acid hydrolysate product (AHP) of Semen Aesculi crude extract. Thirteen BATs, including three new aglycones (1–3), two new glycosides (4, 5) and eight known glycosides (6–13) were obtained. Compound 1, as the main product in AHP, with a tigloyl unit linked at the C-16 position was an unusual aglycone. All compounds exhibited various degrees of inhibitory activity against human breast cell line (MCF-7) and cervical cancer cell line (HeLa) growth, moreover, new aglycones 1 and 2, and the known glycoside 6 (escin Ia) and 9 were found to exhibit potent inhibitory activity which were similar to the positive control (doxorubicin hydrochloride). Compound 1, named 16-tigloyl-O-protoaescigenin, could suppress tumor progression and decreased lung metastasis focuses in mice, and no pathological change was observed at the end of the treatment course. Besides that, the hemolysis experiment between 1 and 6 revealed that the hemolysis toxicity of 1 was much less than that of 6. According to these results, 16-tigloyl-O-protoaescigenin, with the powerful anti-tumor activity and cancer cell apoptosis induction, might be considered as a new promising anti-tumor agent.
1. Introduction
Barrigenol-like triterpenoids (BATs), the dominant compounds in Semen Aesculi (the seeds of Aesculus chinensis Bge.), have attracted much attention from many researchers due to their diverse chemical structures and promising bioactivities.1–3 Multiple hydroxyl binding sites of BATs could be substituted by different kinds of acyl groups such as angeloyl, tigloyl or acetyl groups at C-3, 15, 16, 21, 22 or 28 positions, and the hydroxyls at C-3, 21 and 28 were usually found glycosylated by sugar units, including glucose, glucuronic acid, galactose, arabinose, rhamnose and fucose.4 The features of these chemical structures endowed BATs with significant bioactivities, such as anti-tumor, anti-inflammatory, anti-edema, hypoglycaemic and anti-obesity activity, and an increase of venous tension.5–8 Escin, one kind of typical BAT in Semen Aesculi, has been widely applied in the clinic as a treatment for chronic venous insufficiency, postoperative oedema and haemorrhoids.3,9,10For years our team has devoted effort towards the isolation and bioactivities of BATs from natural plants. BATs with tigloyl or angeloyl substitutes were found to show potent anti-tumor activity in vitro and could be treated as promising anti-tumor agents.11 However, the presence of sugar units in BATs glycosides could cause molecular weight increase, poor oral bioavailability and many side-effects especially tissue irritation, hemolysis, anaphylaxis or acute renal failure, which limit the clinical application of these compounds.12 These limitations and our desire to further develop the medicinal value of BATs propelled us to focus on the acquisition of aglycones from Semen Aesculi.1
Therefore, in this research, the chemical and pharmaceutical studies on the acid hydrolysate product (AHP) of Semen Aesculi crude extract were carried out. The results of in vitro and in vivo anti-metastasis and anti-tumor activities for the compounds were exhibited. Additionally, the comparisons between aglycones and saponins were also discussed and showed obvious difference, comparatively. We hope this research could be valuable and inspirational for the future new drug design.3,13
2. Experimental
2.1 Materials
The involved animal experiments in this research were approved by Animal Ethics Committee and performed in compliance with NIH guidelines.
![[thin space (1/6-em)]](https://www.rsc.org/images/entities/char_2009.gif) 258 was bought from Molecular Probes Inc. (Eugene, OR, USA).; TUNEL FITC Apoptosis Detection Kit was purchased from Nanjing Vazyme Biotech Co., Ltd (Nanjing, China); 0.1% Crystal Violet was purchased from Dalian Meilun Biotech Co., Ltd (Dalian, China).; 6.5 mm Transwell® with 8 μm pore Polycarbonate Membrane Insert, Sterile was purchased from Corning Incorporated (USA); Optimal cutting temperature compound was purchased from Sakura Finetek Japan Co., Ltd (Tokyo); D-α-tocopherol polyethylene glycol 1000 succinate (TPGS, >99%) was purchased from Shanghai Aladdin Biochemical Technology Co., Ltd.(Shanghai, China); all other chemicals were analytical grade and used without further purification.
258 was bought from Molecular Probes Inc. (Eugene, OR, USA).; TUNEL FITC Apoptosis Detection Kit was purchased from Nanjing Vazyme Biotech Co., Ltd (Nanjing, China); 0.1% Crystal Violet was purchased from Dalian Meilun Biotech Co., Ltd (Dalian, China).; 6.5 mm Transwell® with 8 μm pore Polycarbonate Membrane Insert, Sterile was purchased from Corning Incorporated (USA); Optimal cutting temperature compound was purchased from Sakura Finetek Japan Co., Ltd (Tokyo); D-α-tocopherol polyethylene glycol 1000 succinate (TPGS, >99%) was purchased from Shanghai Aladdin Biochemical Technology Co., Ltd.(Shanghai, China); all other chemicals were analytical grade and used without further purification.
2.2 Acid hydrolysis, isolation and purification
100 g of Semen Aesculi total saponin extracts were incubated in 2 L of 2 M HCl under stirring and reflux for 3 h at 80 °C. The reaction mixture was equably suspended and then extracted with isopyknic chloroform three times to yield total sapogenin (42.7 g).The sapogenin (40.0 g) was subjected to silica gel column chromatography (petroleum ether:ethyl acetate, 100:0 to 100:100) to yield 10 fractions (A1-A10). Compounds 1 (120 mg), 9 (140 mg), 10 (40 mg), 11 (8 mg), and 12 (32 mg) were purified from fraction A5 by RP-18 HPLC (MeOH:water, 80:20). Compounds 2 (63 mg), 3 (11 mg), and 13 (110 mg) were obtained from fraction A7 by RP-18 HPLC (MeOH: ater, 85:15). Compounds 4 (18 mg), 5 (17 mg), 6 (80 mg), 7 (30 mg) and 8 (11 mg) were separated from fraction A10 by RP-18 HPLC (MeOH:water:trifluoroacetic acid, 70:30:0.03).
| No. | 1 a | 4 a | 5 b | |||
|---|---|---|---|---|---|---|
| δ H J (Hz) | δ C | δ H J (Hz) | δ C | δ H J (Hz) | δ C | |
| a “o” overlapped. “a” 400 MHz for 1H-NMR, 100 MHz for 13C-NMR. “b” 600 MHz for 1H-NMR, 150 MHz for 13C-NMR. | ||||||
| 1 | 1.01 (dd, 13.1, 3.3) | 38.9 | 0.77 m | 3.85 | 0.79 o | 3.85 |
| 1.55 o | 1.36 m | 1.36 o | ||||
| 2 | 2.07 (dd, 15.9, 3.8) | 28.4 | 1.88 m | 26.6 | 1.90 m | 26.6 |
| 1.97 o | 2.21 o | 2.26 m | ||||
| 3 | 3.60 (dd, 11.7, 4.3) | 80.0 | 3.37 (dd, 11.8, 4.2) | 91.2 | 3.40 (dd, 11.6, 4.7) | 91.1 |
| 4 | — | 43.2 | — | 43.7 | — | 43.7 |
| 5 | 0.94 (d, 11.2) | 56.4 | 0.82 (d, 11.8), 1.29 o | 56.1 | 0.83 (d, 11.8) | 56.1 |
| 6 | 1.66 m, 1.72 m | 19.0 | 1.52 o | 18.5 | 1.22 o, 1.52 o | 18.5 |
| 7 | 1.15 (dd, 7.1, 1.8) | 33.5 | 1.20 o | 33.2 | 1.28 o | 33.2 |
| 1.36 o | 1.36 o | 1.55 o | ||||
| 8 | — | 40.0 | — | 39.9 | — | 39.9 |
| 9 | 1.70 m | 42.7 | 1.63 o | 46.8 | 1.65 o | 46.8 |
| 10 | — | 37.0 | — | 36.4 | — | 36.4 |
| 11 | 1.97 (dd, 10.2, 4.7) | 24.0 | 1.83 m | 24.1 | 1.85 m | 24.1 |
| 1.84 (dd, 10.2, 2.5) | 1.75 o | 1.77 o | ||||
| 12 | 5.44 brs | 124.0 | 5.44 brs | 123.0 | 5.44 brs | 123.2 |
| 13 | — | 142.3 | — | 142.7 | — | 143.3 |
| 14 | — | 41.4 | — | 41.8 | — | 41.9 |
| 15 | 1.76 m, 2.05 o | 31.3 | 1.64 (d, 13.5), 1.88 o | 34.6 | 1.65 (d, 113.4), 1.92 o | 34.6 |
| 16 | 6.28 brs | 71.5 | 4.75 brs | 67.6 | 4.80 brs | 68.0 |
| 17 | — | 46.6 | — | 47.0 | — | 46.5 |
| 18 | 2.90 (dd, 14.2, 3.9) | 40.1 | 2.83 (dd, 13.9, 4.0) | 40.5 | 2.85 (dd, 13.5, 3.8) | 40.8 |
| 19 | 1.52 (dd, 13.6, 4.3) | 48.0 | 1.40 (dd, 14.2, 3.8) | 47.3 | 1.41 (dd, 14.0, 3.8) | 47.8 |
| 2.71 (dd, 14.2, 13.6) | 3.10 (dd, 14.2, 13.9) | 3.02 (dd, 14.0, 13.5) | ||||
| 20 | — | 36.5 | — | 36.0 | — | 36.4 |
| 21 | 4.22 (dd, 9.0, 2.6) | 77.5 | 6.39 (d, 9.9) | 81.7 | 4.79 o | 78.5 |
| 22 | 4.62 (d, 9.0) | 75.3 | 4.47 brs | 70.8 | 4.42 (d, 9.6) | 73.7 |
| 23 | 1.56 s | 23.6 | 1.28 s | 22.4 | 1.31 s | 22.5 |
| 24 | 3.69 (d, 10.7) | 64.6 | 3.32 (d, 11.4) | 63.2 | 3.32 (d, 11.4) | 63.3 |
| 4.5 (d, 10.7) | 4.26 (d, 11.4) | 4.29 (d, 9.6) | ||||
| 25 | 0.84 s | 16.7 | 0.67 s | 15.6 | 0.67 s | 15.6 |
| 26 | 0.90 s | 16.2 | 0.92 s | 16.8 | 0.94 s | 16.9 |
| 27 | 1.47 s | 27.1 | 1.80 s | 27.4 | 1.83 s | 27.4 |
| 28 | 3.75 (d, 10.4) | 67.3 | 4.32 (d, 10.6) | 66.3 | 4.29 o | 67.0 |
| 4.05 (d, 10.4) | 4.22 (d, 10.6) | 4.39 o | ||||
| 29 | 1.38 s | 30.3 | 1.11 s | 29.8 | 1.33 s | 30.5 |
| 30 | 1.40 s | 19.5 | 1.31 s | 20.0 | 1.38 s | 19.3 |
| C-21-Tig | C-21-OAc | C-28-OAc | ||||
| 1′ | — | 167.0 | — | 171.4 | — | 170.8 |
| 2′ | — | 130.0 | 2.10 s | 21.3 | 1.98 | 20.8 |
| 3′ | 7.10 (qd, 7.08, 1.28) | 137.0 | C-28-OAc | |||
| 4′ | 1.58 (d, 7.0) | 14.2 | — | 170.7 | ||
| 5′ | 1.91 s | 12.6 | 2.00 s | 20.7 | ||
| C-3-GlcUA-1′ | 4.88 (d, 7.6) | 104.7 | 4.92 (d, 7.8) | 104.6 | ||
| 2′ | 79.5 | 79.7 | ||||
| 3′ | 76.2 | 76.4 | ||||
| 4′ | 81.6 | 81.7 | ||||
| 5′ | 74.9 | 75.7 | ||||
| 6′ | 169.5 | 172.0 | ||||
| C6′-OCH3 | 3.92 s | 52.7 | — | |||
| C-2′-Glc-1′′ | 5.62 (d, 77) | 104.3 | 5.62 (d, 7.7) | 104.3 | ||
| 2′′ | 74.5 | 75.7 | ||||
| 3′′ | 78.5 | 78.4 | ||||
| 4′′ | 69.7 | 69.7 | ||||
| 5′′ | 78.4 | 78.1 | ||||
| 6′′ | 61.6 | 61.6 | ||||
| C-4′-Glc-1′′′ | 5.03 (d, 7.9) | 105.0 | 5.24 (d, 7.8) | 104.7 | ||
| 2′′′ | 75.7 | 74.9 | ||||
| 3′′′ | 78.2 | 78.6 | ||||
| 4′′′ | 71.5 | 71.5 | ||||
| 5′′′ | 78.1 | 78.1 | ||||
| 6′′′ | 62.3 | 62.4 | ||||
| No. | 2 b | 3 c | ||
|---|---|---|---|---|
| δ H J (Hz) | δ C | δ H J (Hz) | δ C | |
| a “o” overlapped. b 600 MHz for 1H-NMR, 150 MHz for 13C-NMR. c 400 MHz for 1H-NMR, 100 MHz for 13C-NMR. | ||||
| 1 | 1.07 o | 39.1 | 1.60 o | 38.8 |
| 1.61 (d, 13.2) | 1.04 o | |||
| 2 | 1.89 m | 28.5 | 2.05 m | 28.3 |
| 2.00 m | 1.93 m | |||
| 3 | 3.64 m | 80.2 | 3.69 (dd, 11.7, 4.0) | 79.9 |
| 4 | — | 43.2 | — | 42.9 |
| 5 | 1.07 (d, 11.8) | 56.2 | 1.05 o | 56.0 |
| 6 | 1.62 o, 1.76 o | 19.3 | 1.47 (dd, 12.6, 3.9), 1.80 m | 19.2 |
| 7 | 2.04 (d, 13.4), 2.12 (dd, 13.4, 3.5) | 37.2 | 2.09 m, 2.20 m | 36.9 |
| 8 | — | 41.5 | — | 41.1 |
| 9 | 1.80 o | 47.4 | 1.80 o | 47.2 |
| 10 | — | 37.1 | — | 37.0 |
| 11 | 1.87 o, 1.94 m | 24.4 | 1.81 m, 1.96 m | 24.1 |
| 12 | 5.63 brs | 124.0 | 5.55 brs | 124.5 |
| 13 | — | 144.1 | — | 144.2 |
| 14 | — | 48.1 | — | 47.7 |
| 15 | 4.35 (dd, 8.3, 4.5) | 67.6 | 4.33 (dd, 8.3, 4.3) | 67.3 |
| 16 | 4.77 brs | 72.7 | 4.81 brs | 72.3 |
| 17 | — | 47.5 | — | 48.2 |
| 18 | 2.97 (dd, 14.1, 3.8) | 41.8 | 2.99 (dd, 14.2, 3.8) | 41.2 |
| 19 | 1.50 (dd, 13.3, 3.8) | 47.2 | 1.47 (dd, 13.6, 3.9) | 47.2 |
| 3.10 (dd, 14.1, 13.8) | 3.13 (dd, 14.2, 13.6) | |||
| 20 | — | 36.4 | — | 36.1 |
| 21 | 4.89 (d, 9.5) | 78.4 | 6.51 (d, 10.0) | 81.5 |
| 22 | 4.48 (d, 9.5) | 73.5 | 4.87 (d, 10.0) | 72.5 |
| 23 | 1.54 s | 23.6 | 1.56 s | 23.3 |
| 24 | 3.70 (d, 10.5), 4.52 (d, 10.5) | 64.6 | 4.54 (d, 10.4), 3.71 (d, 10.4) | 64.4 |
| 25 | 0.94 s | 16.4 | 0.96 s | 16.2 |
| 26 | 1.20 s | 17.7 | 1.06 s | 17.3 |
| 27 | 1.87 s | 21.1 | 1.87 s | 20.9 |
| 28 | 4.43 (d, 10.6) | 66.3 | 4.08 (dd, 10.2, 4.6) | 65.1 |
| 4.60 (d, 10.6) | 3.81 (dd, 10.2, 3.2) | |||
| 29 | 1.39 s | 30.6 | 1.15 s | 29.6 |
| 30 | 1.45 s | 19.4 | 1.37 s | 20.1 |
| C-21-Tig-1′ | — | 167.0 | ||
| 2′ | — | 130.0 | ||
| 3′ | 7.03 (qd, 7.08, 1.4) | 137.0 | ||
| 4′ | 1.61 (d, 7.0) | 14.2 | ||
| 5′ | 1.87 s | 12.6 | ||
| C-28-Tig-1′ | — | 167.7 | ||
| 2′ | — | 129.1 | ||
| 3′ | 6.98 (qd, 7.12, 1.4) | 137.1 | ||
| 4′ | 1.56 (d, 7.0) | 14.1 | ||
| 5′ | 1.80 s | 12.2 | ||
2.3 Cytotoxicity assay
000 cells and allowed to attach for 24 h. Then cells were incubated with fresh medium containing 0, 3, and 9 μM of compound 1. After incubation for 48 h, the cells were stained with both calcein acetoxymethyl ester and propidium iodide, and were observed immediately using laser scanning confocal microscope.18
2.4 Apoptosis assay
![[thin space (1/6-em)]](https://www.rsc.org/images/entities/b_char_2009.gif) 258 staining assay.
In order to study the variation of nuclear morphology after incubating by compound 1, Hoechst 33256 staining was carried out. Briefly, MCF-7 and HeLa cells (5 × 10⁴ cells per well) were seeded in 24-well plates and allowed to attach for 24 h. Then cells were incubated with fresh medium containing 3, 9, and 27 μM of compound 1. 48 h later, the cells were fixed by paraformaldehyde for 10 min, then the cells were stained by Hoechst 33258 (10 μg mL−1) for 5 min, and were observed using laser scanning confocal microscope.19
258 staining assay.
In order to study the variation of nuclear morphology after incubating by compound 1, Hoechst 33256 staining was carried out. Briefly, MCF-7 and HeLa cells (5 × 10⁴ cells per well) were seeded in 24-well plates and allowed to attach for 24 h. Then cells were incubated with fresh medium containing 3, 9, and 27 μM of compound 1. 48 h later, the cells were fixed by paraformaldehyde for 10 min, then the cells were stained by Hoechst 33258 (10 μg mL−1) for 5 min, and were observed using laser scanning confocal microscope.19
2.5 Cell migration assay
4T1 cells were cultured in 6-well plates at the density of 4 × 10⁵ cells in each well overnight to get 90% of confluence. Then a vertical scratch wound was formed using a 10 μL plastic pipet tip with a ruler after the medium was removed. Then the cells were washed with PBS three times, and were incubated in serum-free medium with compound 1 at concentrations of 1, 3 and 6 μM for 48 h. Images were taken using a microscope at the beginning and after 48 h of incubation to monitor the wound healing status. For cell migration assay, the cells were trypsinized and suspended in medium without serum, then seeded to the top transwell chambers at a density of 1 × 10⁵ cells and complete medium was added to the lower chambers. After 48 h, the medium on the top chambers was removed and the cells on the top of the polycarbonate membrane were erased with a cotton swab. On the contrary, the cells on the bottom surface were fixed by 90% ethanol for 10 min and then stained using 0.1% crystal violet for 15 min followed by washing with PBS three times. Finally, a microscope was used to take images to evaluate the anti-migration ability.212.6 In vivo tumor growth inhibition
A tumor model was established by a subcutaneous injection of 5 × 10⁶ 4T1 cells into the right armpit of 7–8 week-old female BALB/c mice.22 When the average tumor size reached about 80 mm3, the mice were randomly grouped into five groups (n = 5) and intravenously injected with 200 μL of saline, compound 1 at a dose of 3 mg kg−1 and a lower dose of 1 mg kg−1 respectively, blank TPGS micelles at a dose equivalent to compound 1 of 3 mg kg−1 and compound 6 at a dose of 2 mg kg−1 (the molar of 6 approximately equal to low dose 1) as positive control. The treatment was repeated five times every other day. The tumor proliferation rates were monitored every three days with a caliper and the body weights were examined using an electronic balance. The tumor volume was calculated by the following formula: V = (L × W2)/2 (L, longest dimension; W, shortest dimension). All the mice were killed on day 16 counting from the first day of the drug administration. The tumors were collected and cut into slices in a cryostat, fixed with 4% paraformaldehyde, then stained by TUNEL kit.23,24 The heart, liver, spleen, lung, and kidney, including the tumor were fixed in 10% formalin, embedded into paraffin, then cut into slices and stained with hematoxylin-eosin (H&E).24The lung-metastasis model was established by tail intravenous injection of 5 × 10⁶ 4T1 cells. Three days later, the mice were grouped and administered as the methods described above. At the end of the treatment, the mice were killed and the lungs were collected to observe and count the pulmonary metastasis focuses.25
2.7 Hemolysis of red blood cells assay
Heparinized blood was collected from healthy NewZealand rabbit (Experimental Animal Center of Shenyang Pharmaceutical University, China). The erythrocytes were washed three times in saline and then diluted with saline to obtain a 10% suspension. Due to the low solubility, the test compounds were dissolved in DMSO at a concentration of 10 mM, then saline was added to dilute the solution to the testing concentrations ranging from 3 to 48 μM. 2 mL 10% erythrocyte suspension and 2 mL sample solution were mixed, then stood for 4 hours at room temperature. Finally, hemolysis was observed.26,313. Results
3.1 Acid hydrolysis for total saponins
The total saponins obtained from Semen Aesculi were dealt with 2 M HCl for two hours, accordingly, the further chemical investigation on the hydrolysis residue resulted in thirteen barrigenol-like triterpenoids (BATs), including three new aglycones 1–3, two new glycosides 4 and 5, and eight known glycosides (6–13). Compound 1, as one of main products in AHP, with a tigloyl unit linked at C-16 position was an unusual aglycone. Except new compounds 4, 5, the known structures (9–13) were the crude components of total saponins.3.2 Structural identification
New compounds 1–3 were afforded as white acicular crystallization (methanol), and compounds 4, 5 were obtained as white amorphous powder (methanol), respectively.The molecular formula of compound 1 was C35H56O7 with 11 degrees of unsaturation, as deduced by a pseudo molecular ion peak of positive HR-ESI-MS spectrum (m/z 611.3914 [M + Na]+, calcd for C35H56O7Na, 611.3924). The IR spectrum of 1 showed the absorptions of carbonyl (1693 cm−1) and hydroxyl (3425 cm−1) groups. 1H-NMR (400 MHz, pyridine-d5) of 1 displayed six methyl signals of oleanane at δH 0.84, 0.90, 1.38, 1.40, 1.47 and 1.56 (each 3H, s), respectively; one proton signal of H-12 at δH 5.44 (1H, brs); six proton signals of oxygenated carbon at δH 3.60 (1H, dd, J = 11.7, 4.3 Hz, H-3), 6.28 (1H, brs, H-16), 3.69 (1H, d, J = 10.7 Hz, H1-24), 4.50 (1H, d, J = 10.7 Hz, H2-24), 3.75 (1H, d, J = 10.4 Hz, H1-28) and 4.05 (1H, d, J = 10.4 Hz, H2-28); proton signals of a tigloyl unit were δH 7.10 (1H, qd, J = 7.1, 1.3 Hz), 1.91 (3H, s), 1.58 (3H, d, J = 7.0 Hz) (Table 1). Correspondingly, the 13C-NMR (100 MHz, pyridine-d5) (Table 1) spectrum showed the presence of 35 carbon signals, including six methyl carbon signals at δC 16.2 (C-26), 16.7 (C-25), 19.5 (C-30), 23.6 (C-23), 27.1 (C-27), 30.3 (C-29); a pair of olefinic carbon resonance at δC 124.0 (C-12), 142.3 (C-13); six oxygenated carbon resonances at δC 80.0 (C-3), 77.5 (C-21), 75.3 (C-22), 71.5 (C-16), 67.3 (C-28), 64.6 (C-24), respectively; and five carbon signals assigned to the tigloyl unit at δC 12.6, 14.2, 130.0, 137.0 and 167.0. All NMR spectral data indicated compound 1 was a derivative of 24-hydroxyl-barringtogenol C.14 Direct connections between protons and carbon signals were determined by HSQC experiment. The HMBC correlation between δH 6.28 (H-16) and δC 167.0 (Tig-1′) suggested that the tigloyl unit was linked at C-16–OH position (Fig. 1B).
 | ||
| Fig. 1 Structures of compounds 1–13 (A); key HMBC correlations of compounds 1–5 (B); major NOESY correlations of compounds 1 and 3 (C). | ||
The stereochemistry of compound 1 was determined by NOESY experiment (Fig. 1C). The cross-peaks between δH 3.60 (H-3) and δH 1.56 (H-23), δH 3.60 (H-3) and δH 0.94 (H-5), δH 0.94 (H-5) and δH 1.70 (H-9), as well as δH 2.90 (H-18) and δH 1.40 (H-30) were in good agreement with the ring conjunction reported for oleanane type triterpenes. Meanwhile, the existence of NOE correlations between δH 6.28 (H-16) and δH 4.62 (H-22), δH 4.62 (H-22) and δH 1.40 (H-30) indicated that H-16 and H-22 were with β orientations. The NOE correlation between δH 4.22 (H-21) and δH 1.38 (H-29), confirmed H-21 was presented an α orientation. Based on the above analysis, compound 1 was elucidated to be 16-tigloyl-O-3β, 16α, 21β, 22α, 24β, 28-hexahydroxyl-olean-12-ene and subsequently was named as 16-tigloyl-O-protoaescigenin.
The molecular formula of compound 2 was determined as C35H56O8 (8 degrees of unsaturation) by HR-ESI-MS analysis with a pseudo-molecular ion peak at m/z at 627.3866 (calcd for C35H56O8Na, 627.3873). Characteristic absorption bands at 1699 and 3425 cm−1 in the IR spectrum were assigned to absorptions of carbonyl and hydroxyl groups. 1H-NMR (600 MHz, pyridine-d5, Table 2) displayed six methyl signals of an oleanane at δH, 0.94, 1.20, 1.39, 1.45, 1.54 and 1.87 (each 3H, s), respectively; a signal for H-12 at δH 5.63 (1H, brs); nine signals of proton linked with the oxygenated carbon at δH 3.64 (1H, m, H-3), 4.35 (1H, dd, J = 8.3, 4.5, H-15), 4.77 (1H, brs, H-16), 3.70 (1H, d, J = 10.5 Hz, H1-24), 4.52 (1H, d, J = 10.5 Hz, H2-24), 4.89 (1H, d, J = 9.5 Hz, H-21), 4.48 (1H, d, J = 9.5 Hz, H-22), 4.43 (1H, d, J = 10.6 Hz, H1-28) and 4.60 (1H, d, J = 10.6 Hz, H2-28) were also shown; and signals at δH 6.98 (1H, qd-like), 1.80 (3H, s), 1.56 (3H, d, J = 7.0 Hz) were assigned to a tigloyl unit. The presence of 35 carbon resonances were showed in the 13C-NMR (150 MHz, pyridine-d5, Table 2) spectrum, and 5 signals at δC 12.2, 14.1, 129.1, 137.1, 167.7 were assigned to a tigloyl group. Two carbon signals at δC 124.0, 144.1 were assigned to C-12, 13 positions of the oleanene; seven oxygenated carbon signals at δC 64.6 (C-24), 66.3 (C-28), 67.6 (C-15), 72.7 (C-16), 73.5 (C-22), 78.4 (C-21) and 80.2 (C-3). The characters on NMR spectral data indicted compound 2 was a aglycone of barrigenol triterpenoid. All spectral data were assigned by HSQC experiment. The tigloyl group was confirmed to be located at the C-28 position by a long-range correlation between δH 4.43, 4.60 (H-28) and δC 167.7 (Tig-1′) in the HMBC spectrum (Fig. 1B).
The stereochemistry of 2 was also determined by NOESY experiment. Cross-peaks between δH 4.35 (H-15), 1.45 (H-30) and δH 4.48 (H-22); δH 1.07 (H-5), 1.54 (H-23) and δH 3.64 (H-3); δH 2.97 (H-18), 4.11 (H-16) and δH 4.43, 4.60 (H-28), as well as between δH 4.89 (H-21) and δH 1.39 (H-29) suggested compound 2 showed the same stereochemistry to that of 1. Based on the 2D-NMR experiments (Fig. 1B and C), the structure for 2 was identified as 28-O-tigloyl-3β, 15α, 16α, 21β, 22α, 24β, 28-heptahydroxyl-olean-12-ene.
Compound 3 exhibited a pseudo-molecular ion peak at m/z 627.3866 [M + Na]+ (calcd for C35H56O8Na, 627.3873) in HR-ESI-MS spectrum in agreement with a molecular formula of C35H56O8 with 8 degrees of unsaturation. Absorptions at 1699 and 3390 cm−1 in the IR spectrum were ascribed to carbonyl and hydroxyl groups. 1H-NMR (400 MHz, pyridine-d5) and 13C-NMR (100 MHz, pyridine-d5) data of compound 3 (Table 2) were similar to that of 2. The carbon signals at δC 78.4 (C-21), 73.5 (C-22) and 66.3 (C-28) in compound 2 were changed as δC 81.5 (C-21), δC 72.5 (C-22) and δC 65.1 (C-28) respectively in compound 3, which indicated that the tigloyl group was linked at the C-21 position in compound 3, meanwhile, a long-range correlation between δH 6.51 (1H, d, J = 10.0 Hz, H-21) and δC 168.3 (C-1′) in HMBC spectrum was also found. Based on the analysis of NOESY (Fig. 1C), HMBC, and HSQC spectral data, compound 3 was determined as 21-O-tigloyl-3β, 15α, 16α, 21β, 22α, 24β, 28-heptahydroxyl-olean-12-ene, at finally.
Compound 4 exhibited a molecular formula of C53H84O24 with 12 degrees of unsaturation being based on a pseudo-molecular ion peak of positive HR-ESI-MS m/z 1127.5243 [M + Na]+ (calcd for C53H84O24Na, 1127.5250). The IR spectrum showed the absorptions for the presence of carbonyl (1644 and 1723 cm−1) and hydroxyl (3427 cm−1) groups. The NMR data of 4 indicted the presence of two acetoxy groups [δH 2.00 (3H, s), δC 171.4, 21.3; δH 2.10 (3H, s), δC 170.7, 20.7] and three sugar units in the structure. Three anomeric proton signals at δH 4.88 (1H, d, J = 7.8 Hz, C-3-GlcUA-1′), 5.03 (1H, d, J = 7.8 Hz, C-4′-Glc-1′′′), 5.62 (1H, d, J = 7.8 Hz, C-2′-Glc-1′′) were assigned to a D-glucuronic acid (δC 74.9, 76.2, 79.5, 81.6, 104.7, and 169.5) and two D-glucose units (δC 61.6, 69.7, 74.5, 78.4, 78.5, 104.3; δC 62.3, 71.5, 75.7, 78.1, 78.2, 105.0). Meanwhile, six characterized methyl proton signals [δH 0.67, 0.92, 1.11, 1.28, 1.31, 1.80 (each 3H, s)] in 1H-NMR spectrum, a pair of oleanene carbons (δC 123.0, 142.7) of C-12, 13 in 13C-NMR were also found. All spectral data of compound 4 indicted it was a derivative of Aesculiside A. In the HMBC spectrum (Fig. 1B), a methoxy group was confirmed to be located at the C-6′ position of the glucuronic acid unit by a long-range correlation between δH 3.92 (3H, s, –OCH3) and the carbonyl carbon δC 169.5 (Glu UA-C-6′). Moreover, the anomeric proton signal δH 4.88 (1H, d, J = 7.8 Hz, H-1′) of glucuronic acid showed a long-range correlation with δC 91.2 (C-3) position of aglycone; the anomeric proton signal δH 5.62 (Glc-H-1′′) and δH 5.03 (Glc-H-1′′′) of two D-glucose units showed long-range correlations with δC 79.5 (GlcUA-C-2′) and δC 81.6 (GlcUA-C-4′) respectively. HMBC correlations between H-21, 28 (δH 6.39, 4.32) and two carbonyl carbons assigned to two acetoxy group at δC 171.4 and 170.7, respectively, were also observed (Fig. 1B). Additionally, the proton resonance at δH 6.39 (H-21) revealed the NOE correlation with the resonance at δH 1.11 (CH3-29), suggesting that H-21 possesses an α-orientation. Similarly, the H-16 at δH 4.75 showed NOE correlation with H-22 at δH 4.47, whereas H-22 showed NOE correlation with CH3-30 at δH 1.31. These findings suggested that H-16 and H-22 exhibited β-orientations. Based on these results, the structure of 4 was identified as 3-O-(2′-O-β-D-glucopyranosyl-4′-D-O-β-D-glucopyranosyl)-β-D-6′-methyl-O-glucuronic acid-21-O-acetyl-28-O-acetyl-3β, 16α, 21β, 22α, 24β, 28-hexahydroxyl-olean-12-ene, and subsequently as 6′-methyleter-O-aesculiside A.15
The molecular formula of compound 5 was verified as C50H80O23 (11 degree of unsaturation), from a pseudo-molecular ion peak [M − H]− at 1047.5041 (calcd for C35H55O8, 1047.5012) in the negative HR-ESI-MS. The 1H-NMR (600 MHz, pyridine-d5) and 13C-NMR (150 MHz, pyridine-d5) spectral data (Table 1) suggested structure of compound 5 was similar to that of compound 4. The differences lies in the carbon signals of C-21 (δC 81.7), C-22 (δC 70.8) in 4 were shifted to δC 78.5 (C-21), δC 73.7 (C-22) in compound 5, besides that, the acetoxy group linked with C-28 could be verified by a long-range correlation between H-28 signals (δH 4.29, 4.39) and the carbonyl carbon δC 170.8 (Glc-C-1′′′′) in HMBC spectrum (Fig. 1B). In addition, the long-range correlations between δH 4.92 (GlcUA-H-1′) and δC 91.1 (C-3); δH 5.62 (Glc-H-1′′) and δC 79.7 (GlcUA-C-2′), δH 5.24 (Glc-H-1′′′) and δC 81.7 (GlcUA -C-4′) showed the location and the linkage sequence of the sugar units; the remaining HMBC correlations in compound 5 were consistent with those in compound 4. Eventually, based on all spectral data, especially on HMBC and NOESY spectral data (Fig. 1B and C), structure of 5 was elucidated as 3-O-(2′-O-β-D-glucopyranosyl-4′-O-β-D-glucopyranosyl)-β-D-glucuronic acid-28-O-acetyl-3β, 16α, 21β, 22α, 24β, 28-hexahydroxyl-olean-12-ene.
3.3 In vitro anti-tumor and anti-metastasis activity
| Compd | IC50 (μM) | |
|---|---|---|
| MCF-7 | HeLa | |
| 1 | 4.3 | 1.8 |
| 2 | 11.6 | 14.4 |
| 3 | 51.5 | 45.1 |
| 4 | >80 | >80 |
| 5 | 52.4 | 56.1 |
| 6 | 3.6 | 3.2 |
| 7 | >80 | 55.0 |
| 8 | 53.9 | 48.7 |
| 9 | 6.3 | 7.3 |
| 10 | >80 | 80.0 |
| 11 | 38.2 | 33.0 |
| 12 | 48.4 | 47.3 |
| 13 | >80 | 80 |
| Doxorubicin hydrochloride | 1.1 | 3.5 |
 | ||
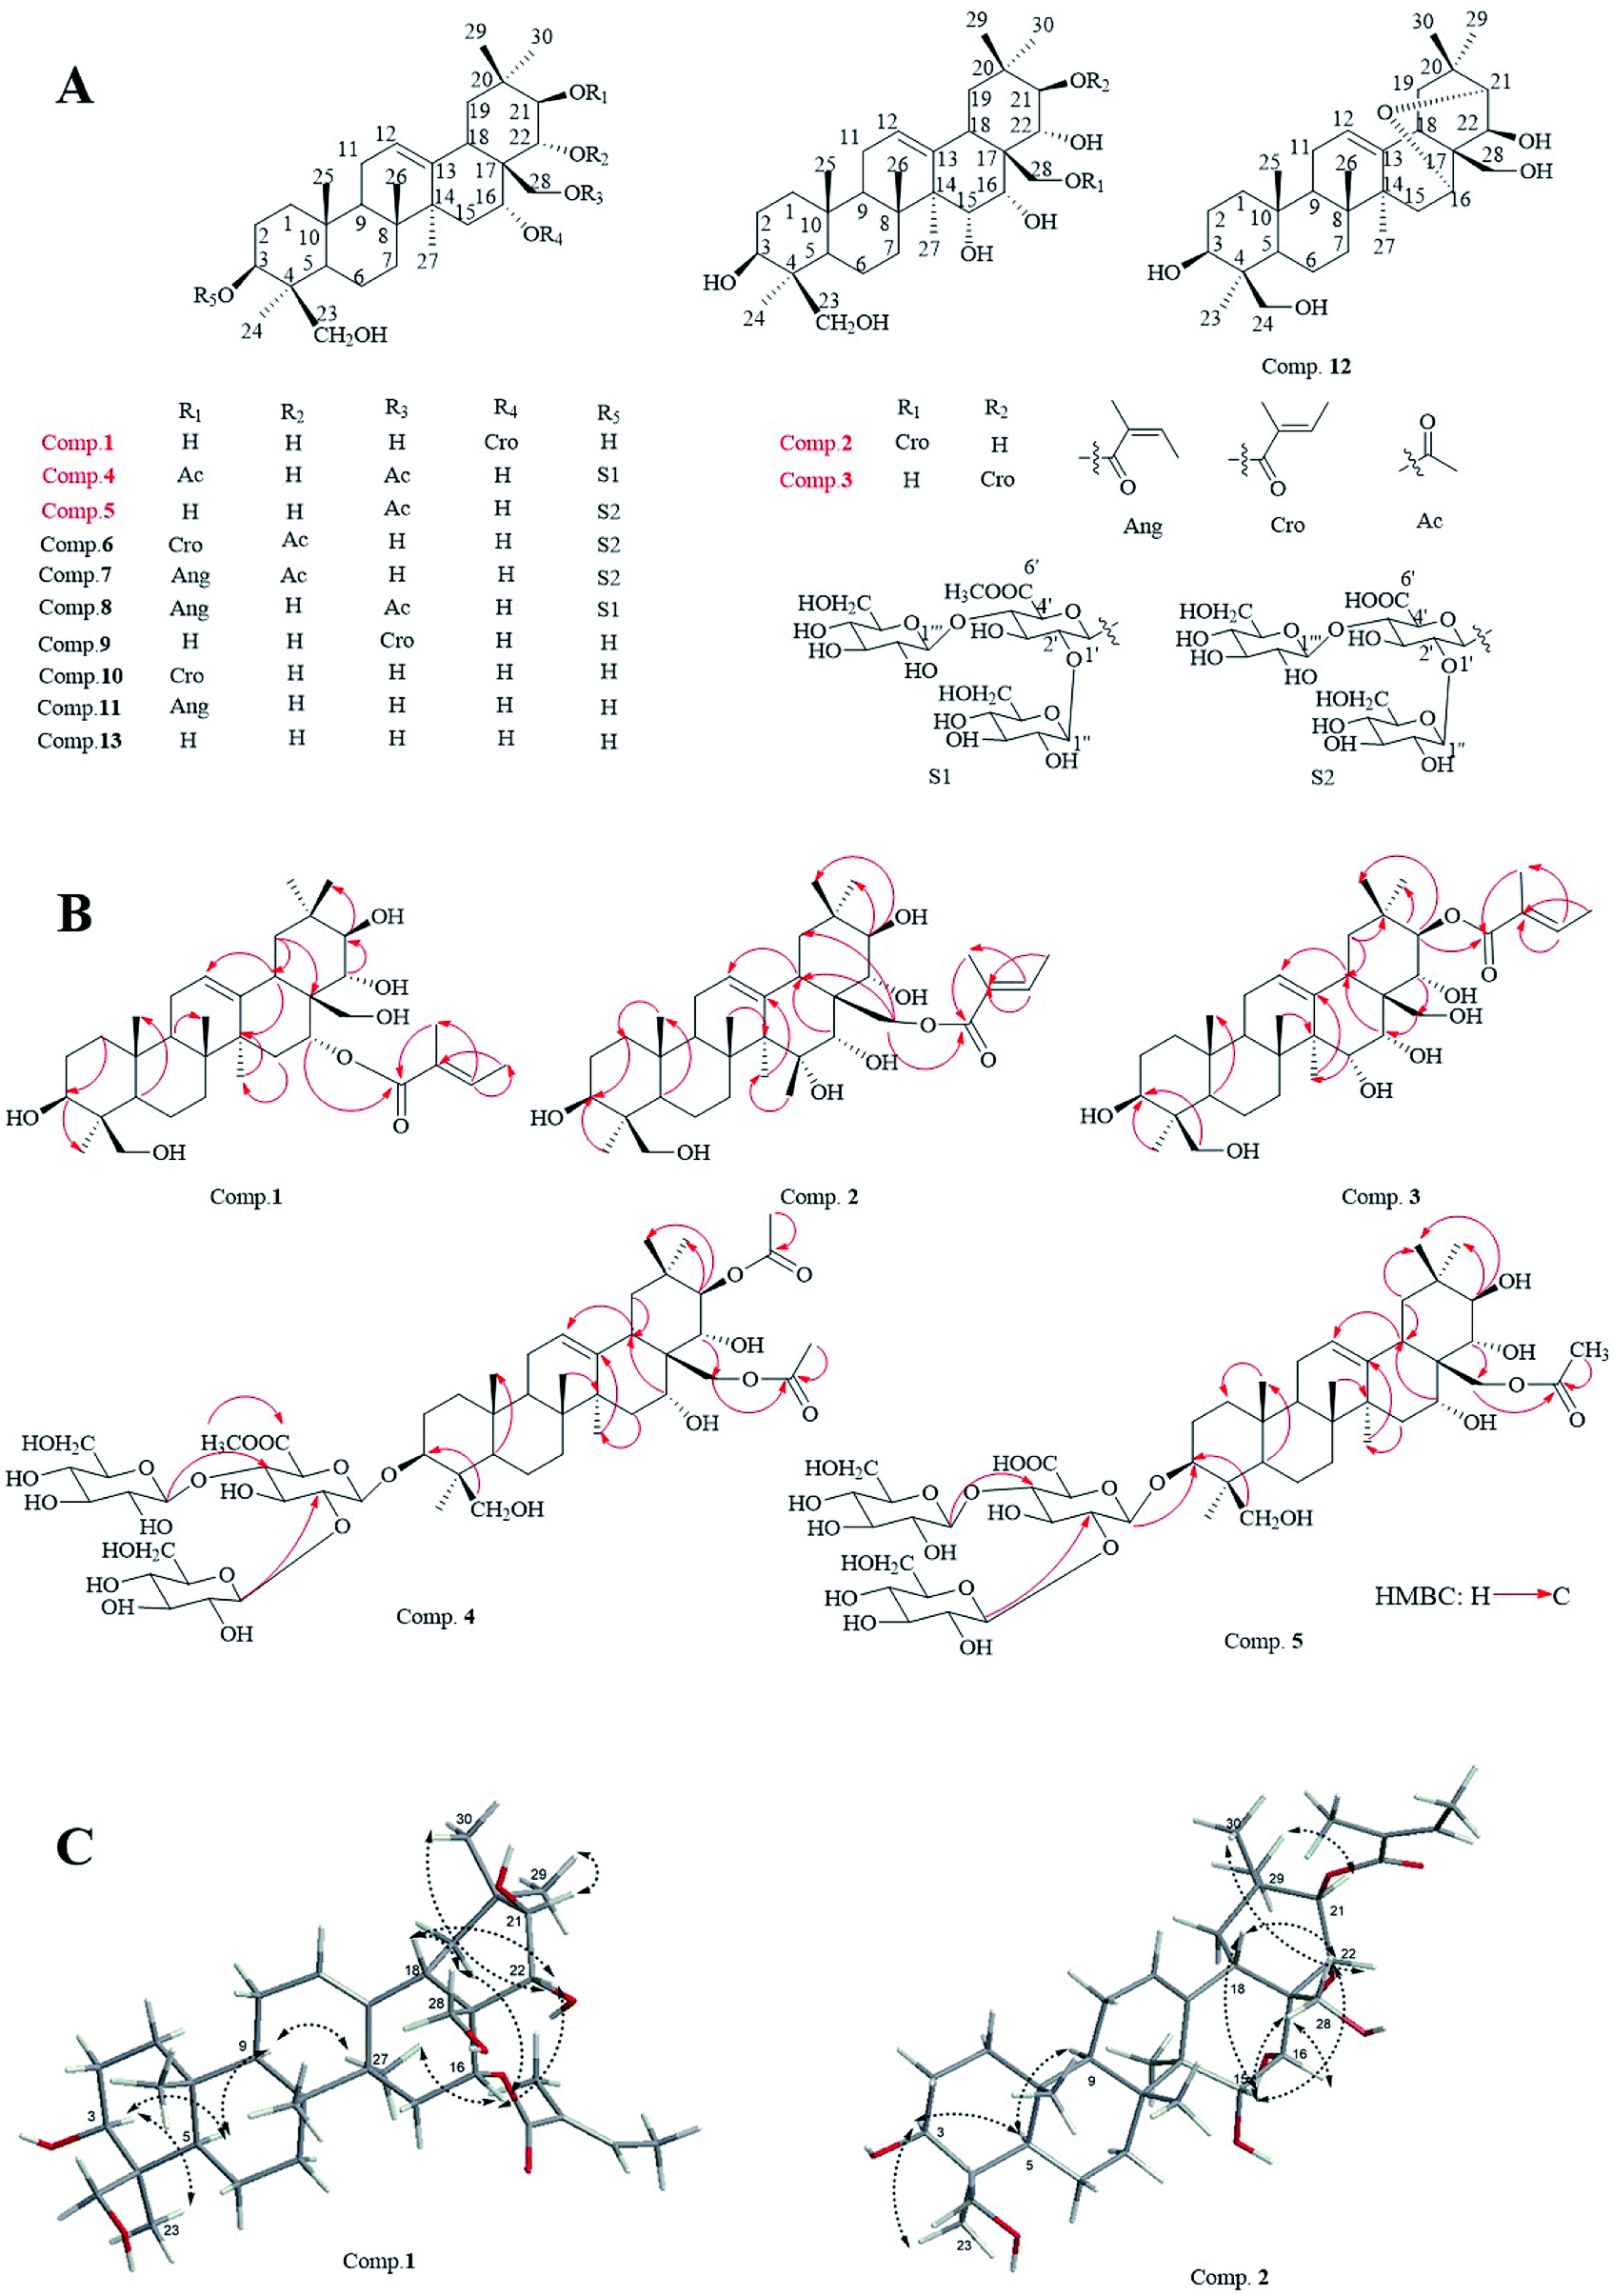
| Fig. 2 (A) Cytotoxicity assay of compound 1, 2 and 6 against MCF-7 and HeLa cells. (B) LSCM images of calcein-AM and PI co-stained cells after treated with different concentration of compound 1 (scale bar 50 μm). | ||
As shown in Table 3 and Fig. 2A, compounds 1, 2 as aglycones, and two glycosides 6 and 9, showed potent cytotoxicity on two cell lines, with the IC50 values less than 15 μM. In these products, 1 (IC50 MCF-7 = 4.3 μM, IC50 HeLa = 1.8 μM) has shown the similar effect on cytotoxicity as doxorubicin hydrochloride (IC50 MCF-7 = 1.1 μM, IC50 HeLa = 3.5 μM). Glycosides, 3, 5, 7, 8, 11 and 12 showed moderate anti-proliferation against MCF-7 and HeLa cells (Table 3, 30 μM < IC50 < 80 μM), while, compounds 4, 10, and 13 exhibited no inhibitory activity on two tested cells growth.
In order to observe the apoptotic capacity of compound 1 more directly, the living and dead cells were labeled by calcein acetoxymethyl ester (calcein-AM) and propidium iodide (PI), respectively, then, were immediately imaged by laser scanning confocal microscope (LSCM), green fluorescence for living and red fluorescence for death. Fig. 2B vividly illustrated that after treated with compound 1, the amount of living MCF-7 and HeLa cells fell sharply with the increasing of 1 (0 μM, 3 μM, and 9 μM), and green labeled cells were hardly found in 27 μM (data not shown) treated MCF-7 and HeLa cells. In addition, as shown in Fig. 2B, the nucleus of cells with incomplete membrane were labeled by PI, and the shapeless red fluorescence indicated that the nucleus of both compound 1 treated MCF-7 and HeLa cells were fragmented.
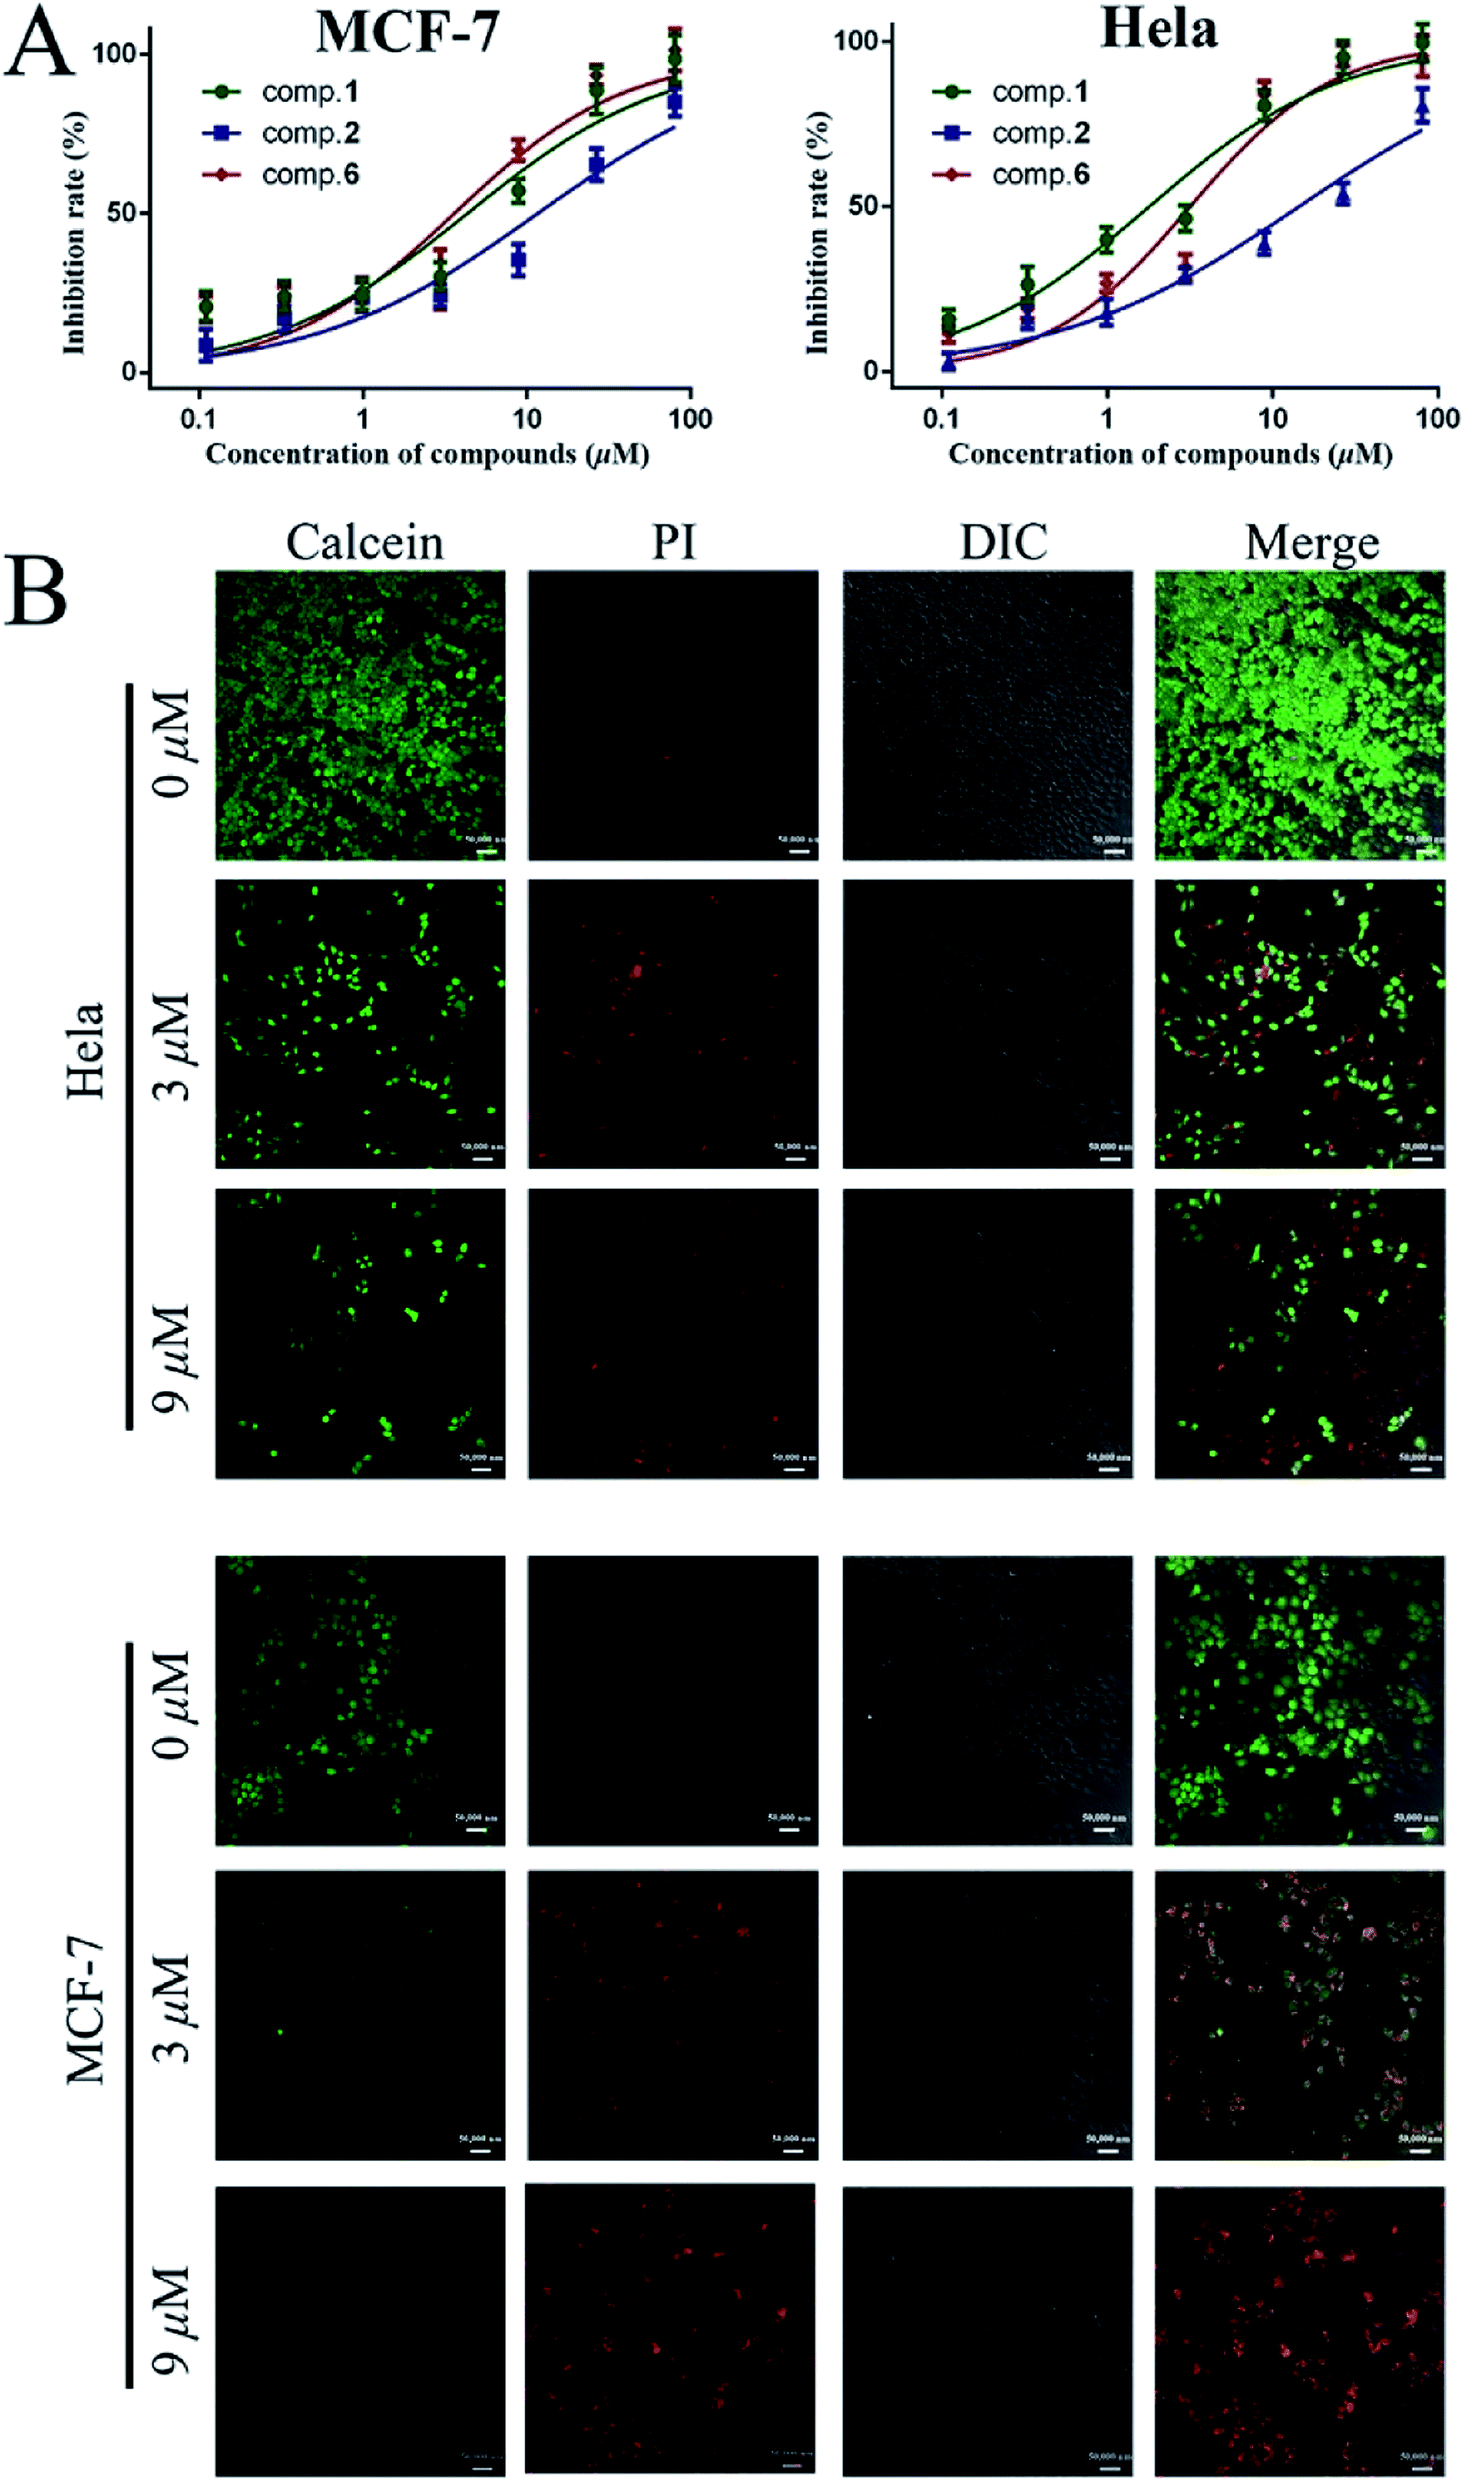
258 staining. When MCF-7 and HeLa cells were incubated with compound 1 for 48 h, the fragments of nucleus were predominantly observed by all concentrations within the test range (Fig. 3). Moreover, as shown in Fig. 3, compared with normal cells, the incompact and shrinking morphology of cells incubated with 1 were observed in differential interference contrast (DIC) images.
 | ||
| Fig. 3 LSCM images of Hoechst 33258 stained cell nucleus after being treated with different concentrations of compound 1 (scale bar 20 μm). | ||
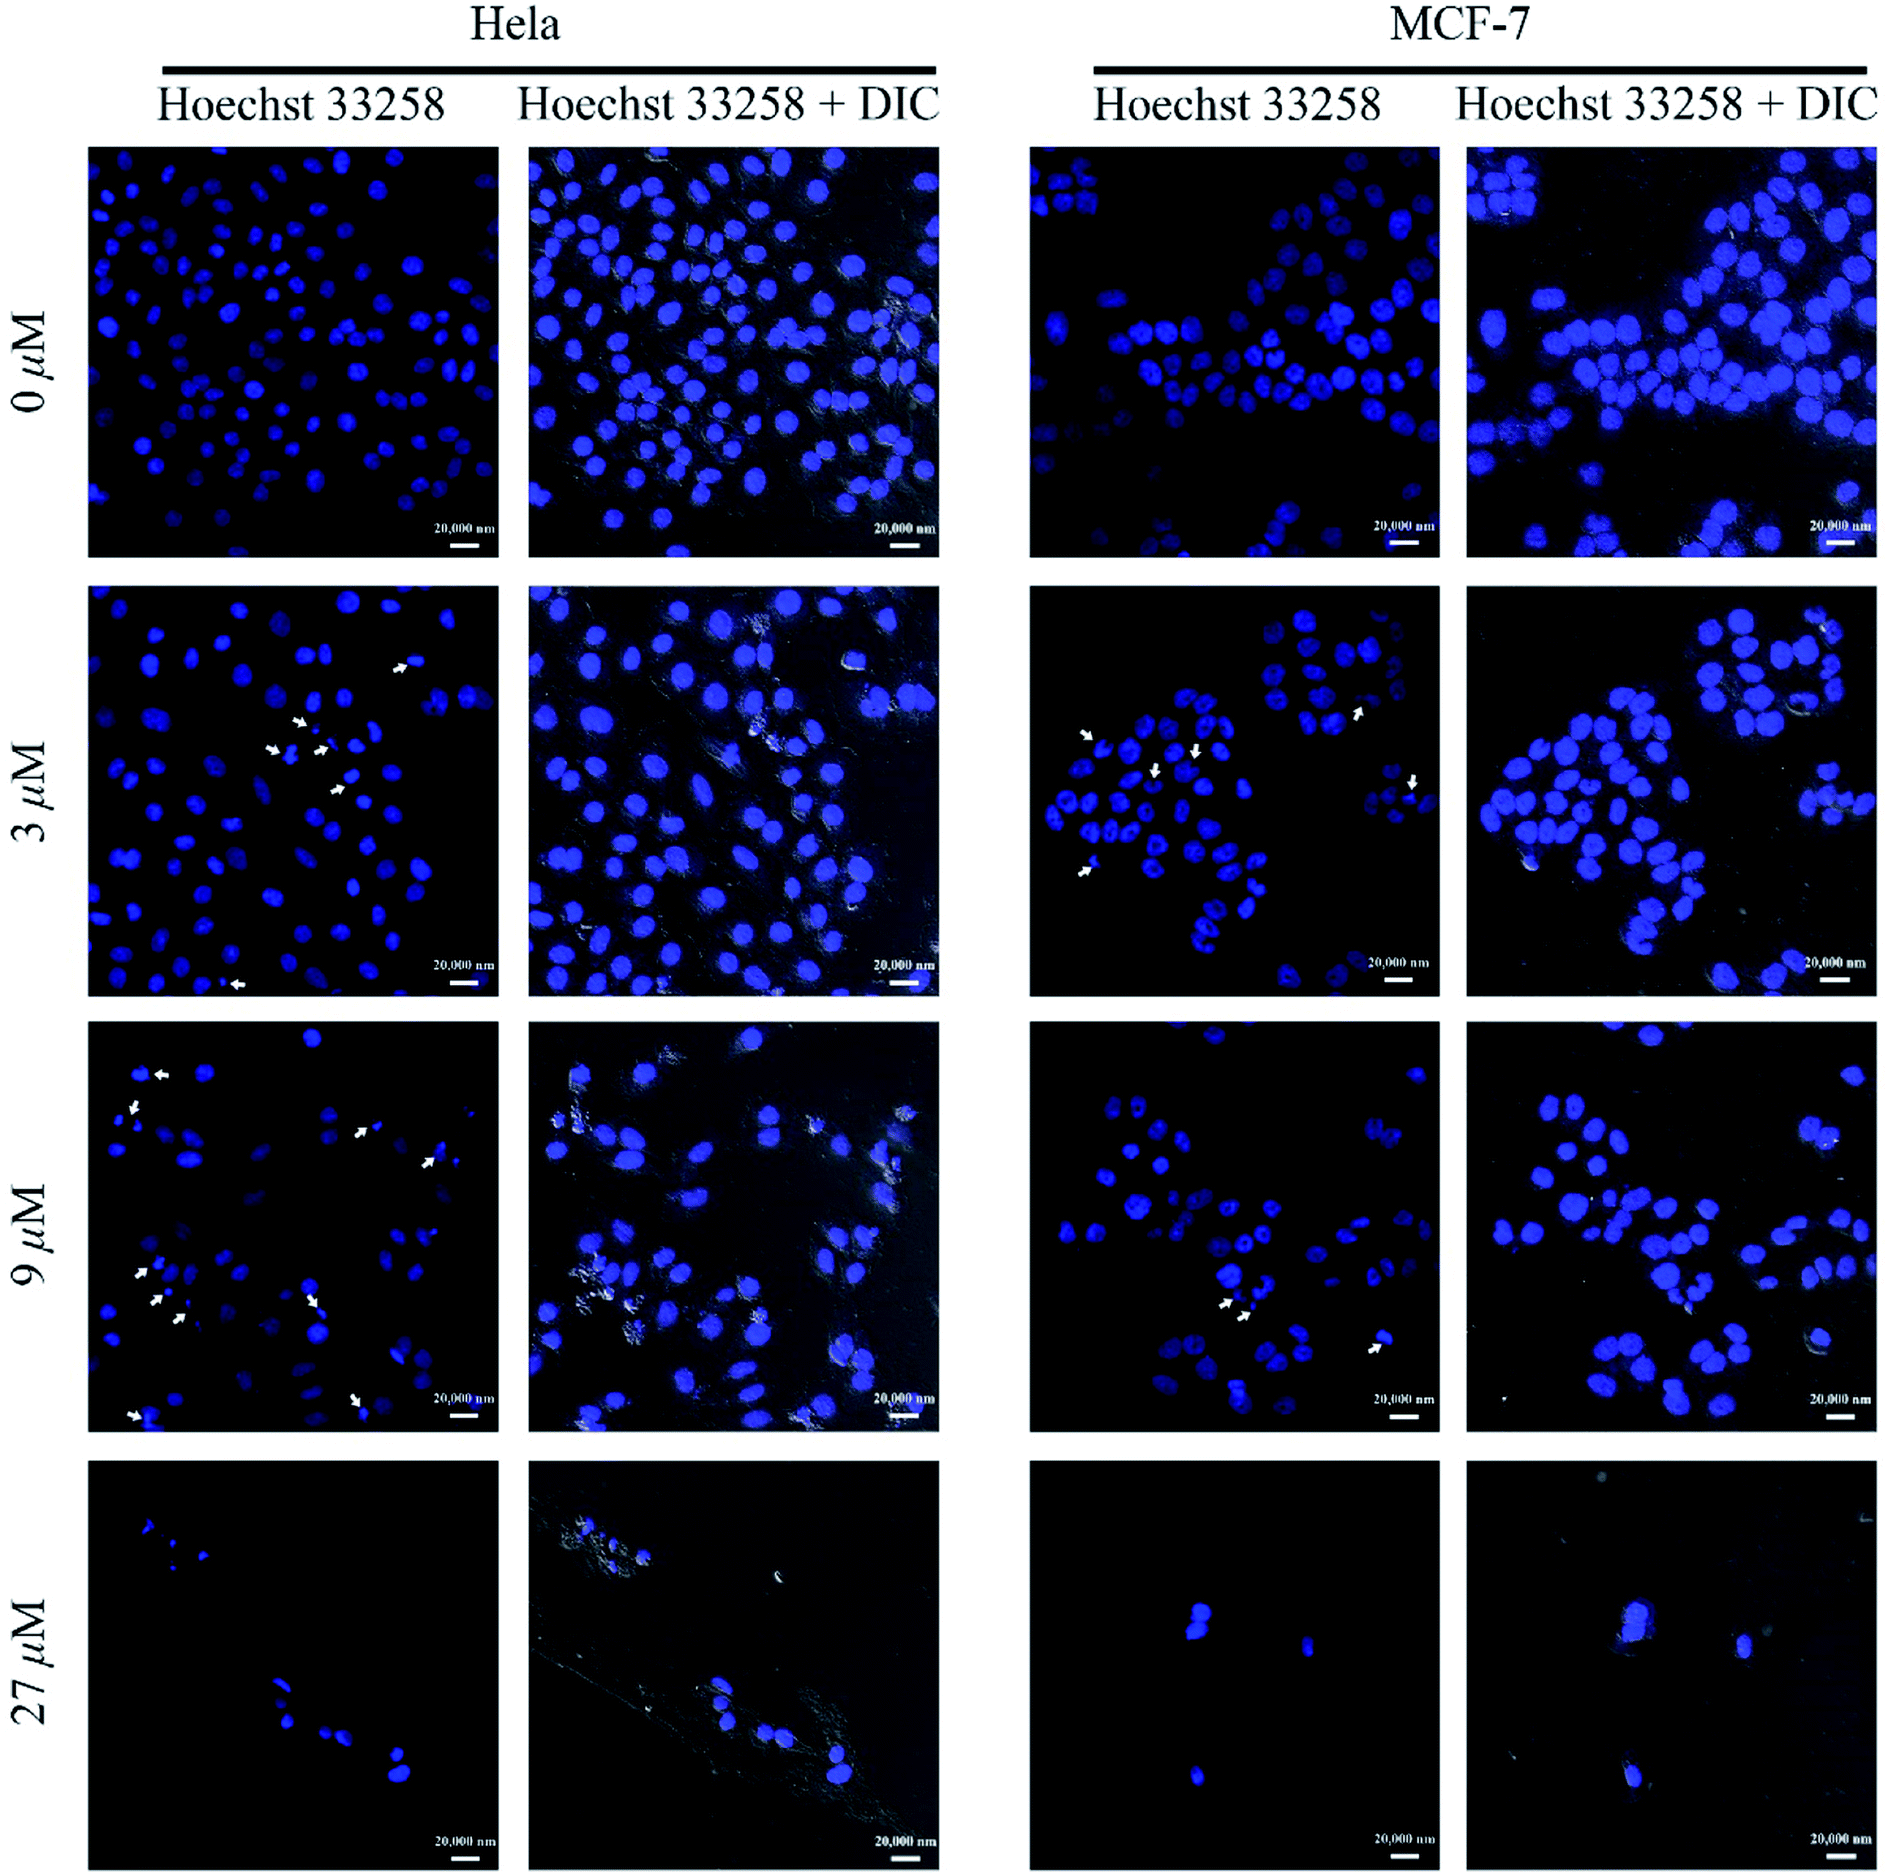
The apoptosis-mediated anti-proliferative activities of compound 1 was further analyzed by Annexin V-FITC/PI staining combining with flow cytometry (FCM) technology. As shown in Fig. 4, when MCF-7 and HeLa cells were incubated with compound 1 for 48 h, different levels of apoptosis, especially late apoptosis, were observed. Late apoptosis rates of 46.9 ± 3.8%, 45.5 ± 5.5%, and 82.5 ± 8.3% were observed in MCF-7 cells at concentrations of 3, 9, and 27 μM, respectively. Parallelly, late apoptosis rates of 15.8 ± 3.6%, 54.4 ± 10.3%, and 79.9 ± 8.8% were ensured in HeLa cells at concentrations of 3, 9, and 27 μM of compound 1, respectively.
 | ||
| Fig. 4 The scatter diagrams of cell apoptosis after being treated with different concentrations of compound 1. | ||
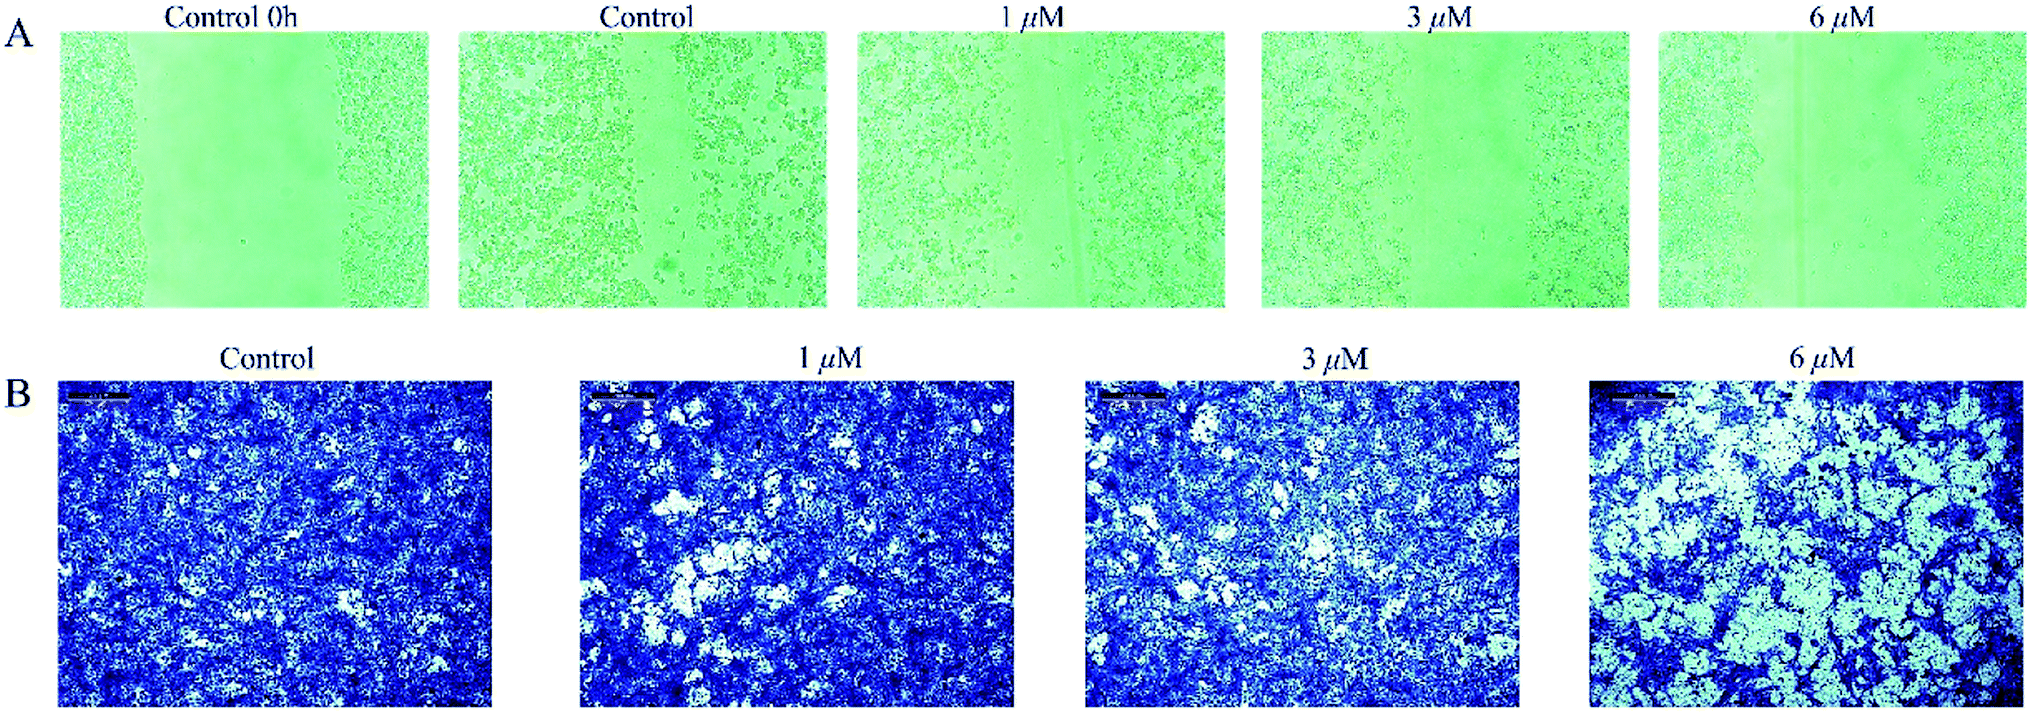 | ||
| Fig. 5 (A) The wound healing and (B) cell migration images (Scale bar 200 μm). Cells were treated with 1, 3 and 6 μM compound 1. | ||
3.4 In vivo anti-tumor activity
For the saline group, the tumors grew continuously to around 660 mm3 at the end of the experiment. TPGS group exhibited weak anti-tumor effect. While the tumors of low dose compound 1 treated mice grow slowly to around 380 mm3 on day 16 exhibiting a certain antineoplastic activity in vivo (Fig. 6A and B). Unfortunately, the same molar escin of Ia (6) with low dose 1 group treated mice all died in the second day after the administration. Similar trend was found for the tumor weight data (Fig. 6C). The TUNEL staining images of the saline and TPGS groups showed that little cell apoptosis was induced in the tumors. The green fluorescence of compound 1 treated tumors displayed strong intensity and was distributed widely in the images, exhibiting large area of cell apoptosis (Fig. 6D). There was no significant change in mice weight during the treatment course (Fig. 6E).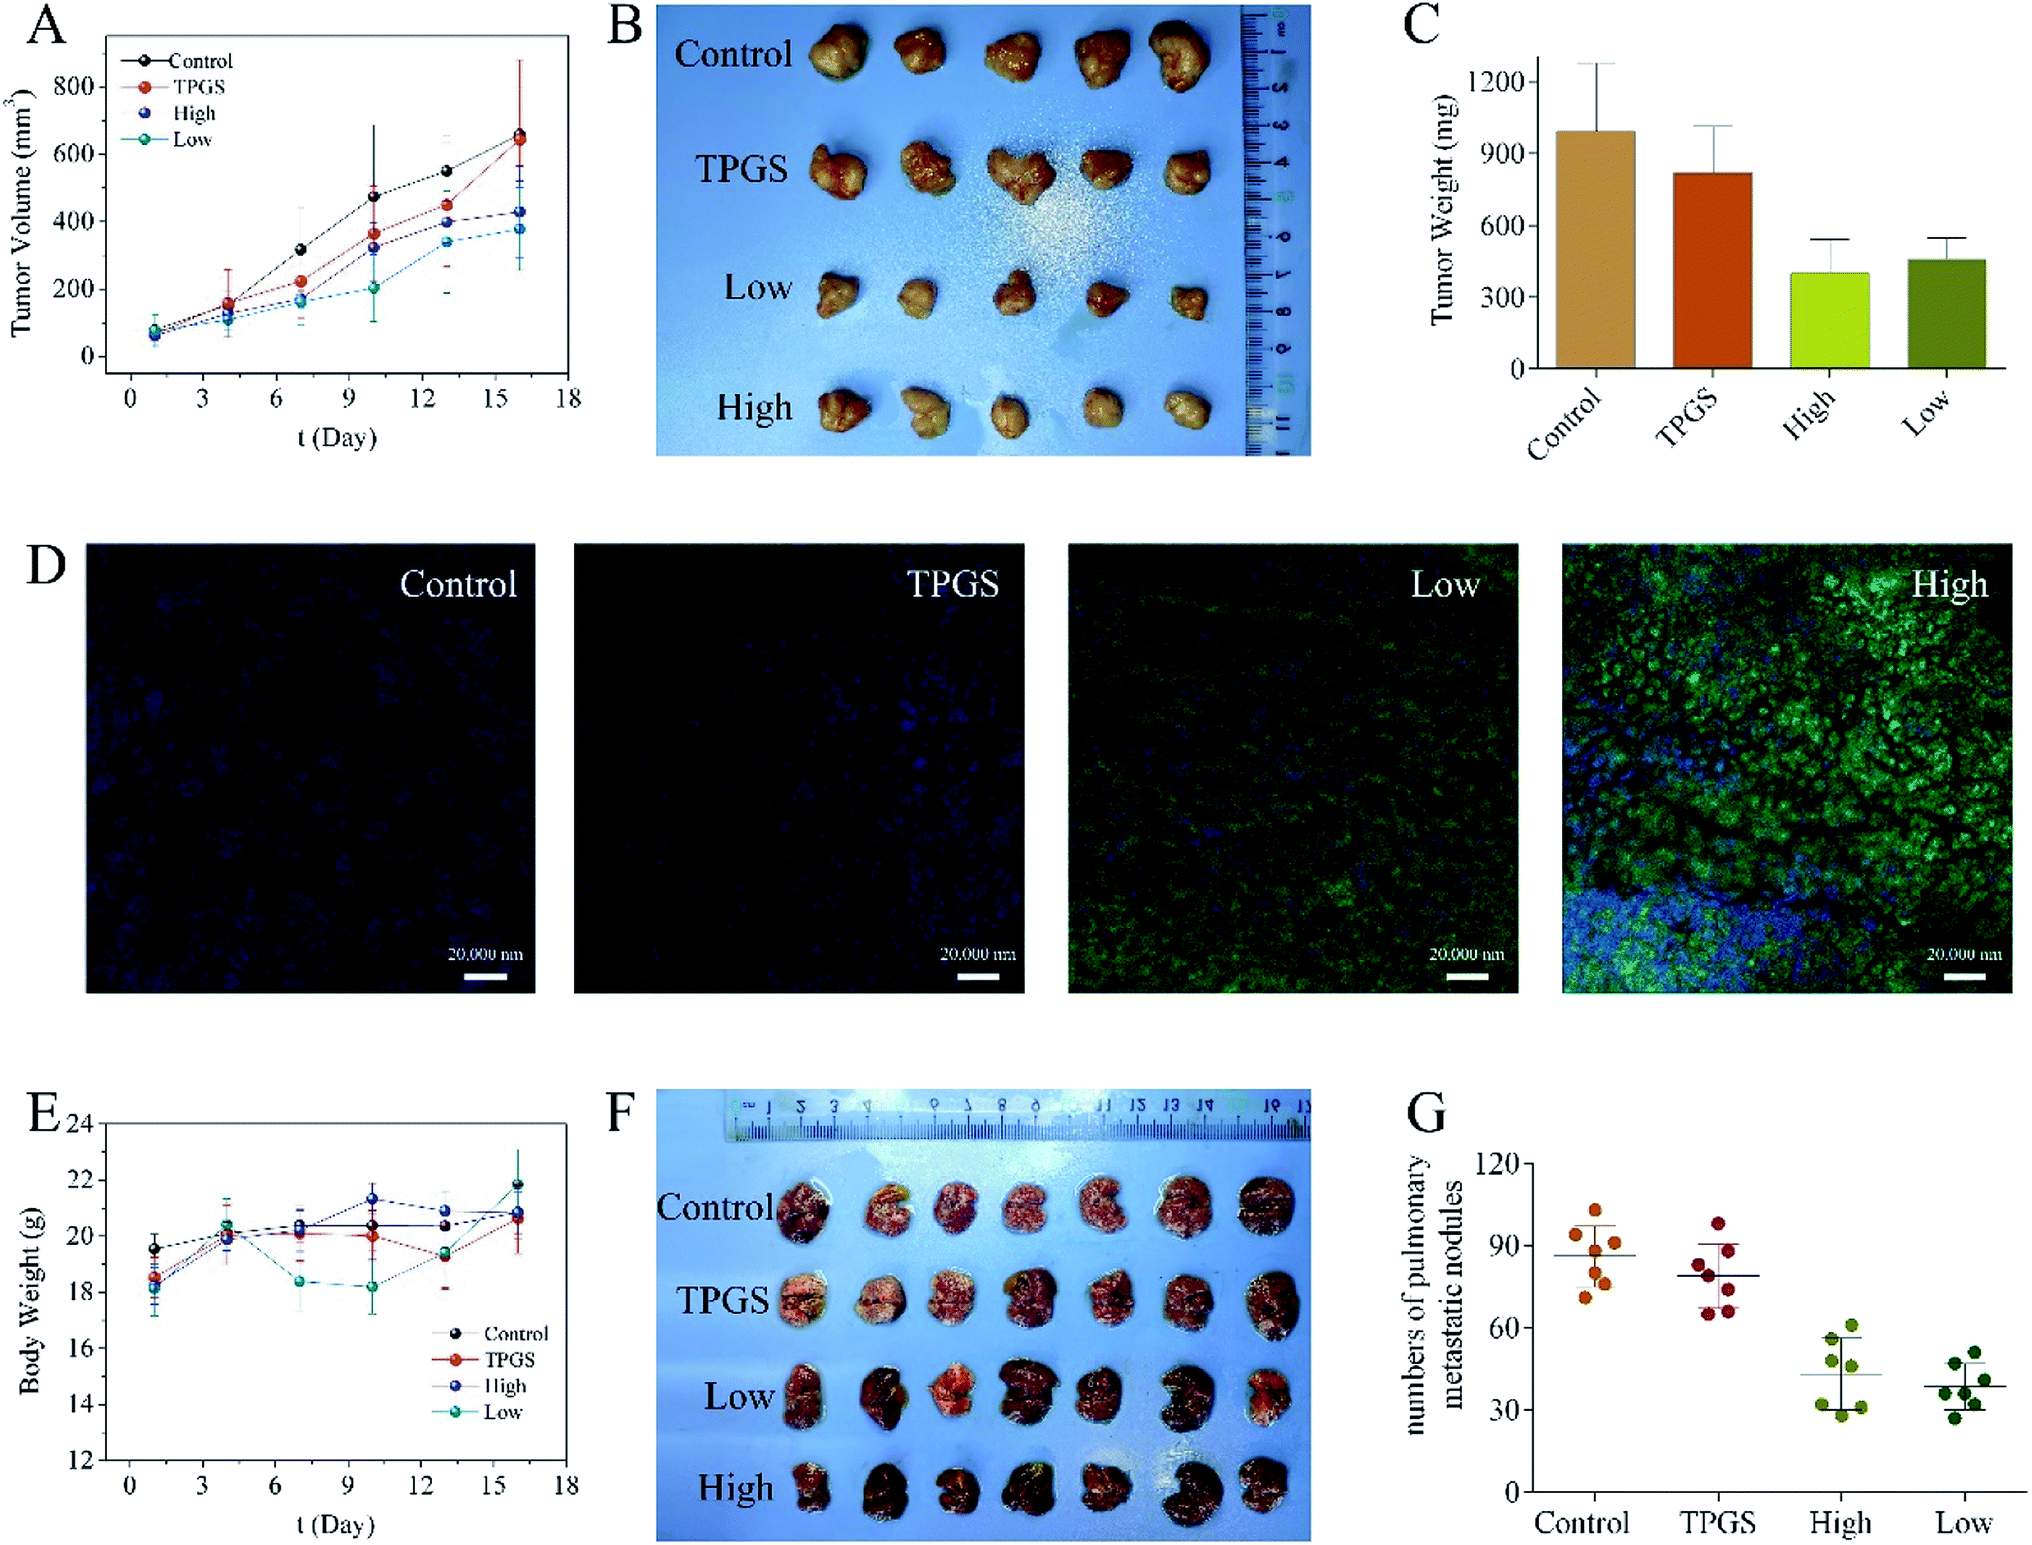 | ||
| Fig. 6 (A) Tumor growth curves after different treatments (n = 5). (B) Tumor image at the end of the whole therapy period. (C) Tumor weight of mice at the end of the whole therapy period. (D) TUNEL images of tumors after different treatment (scale bar 20 μm). (E) Body weight changes of mice after different treatments. (F) Lung tissues at the end of the whole therapy (n = 7). (G) Quantitative analysis of pulmonary metastatic nodules for every group. | ||
Meanwhile, notable metastatic nodules were found in the lungs of the saline and TPGS groups, suggesting that the injected 4T1 cells achieved in localization in lung tissues. The lungs of compound 1 treated mice were smoother with decreased numbers of tumor nodules, which demonstrated that compound 1 could inhibit tumor metastasis (Fig. 6F and G).
H&E staining revealed that the tumor tissues of the control group were filled with dysregulated cells possessing large hyperchromatic nuclei and highly proliferative. While compound 1 treated tumors showed large area of nucleus pycnosis and some tiny cell fragments stained blue, which again confirmed the pro-apoptosis efficacy of compound 1. In addition, H&E staining of the major organs of compound 1 treated mice did not show pathological injuries (Fig. 7).
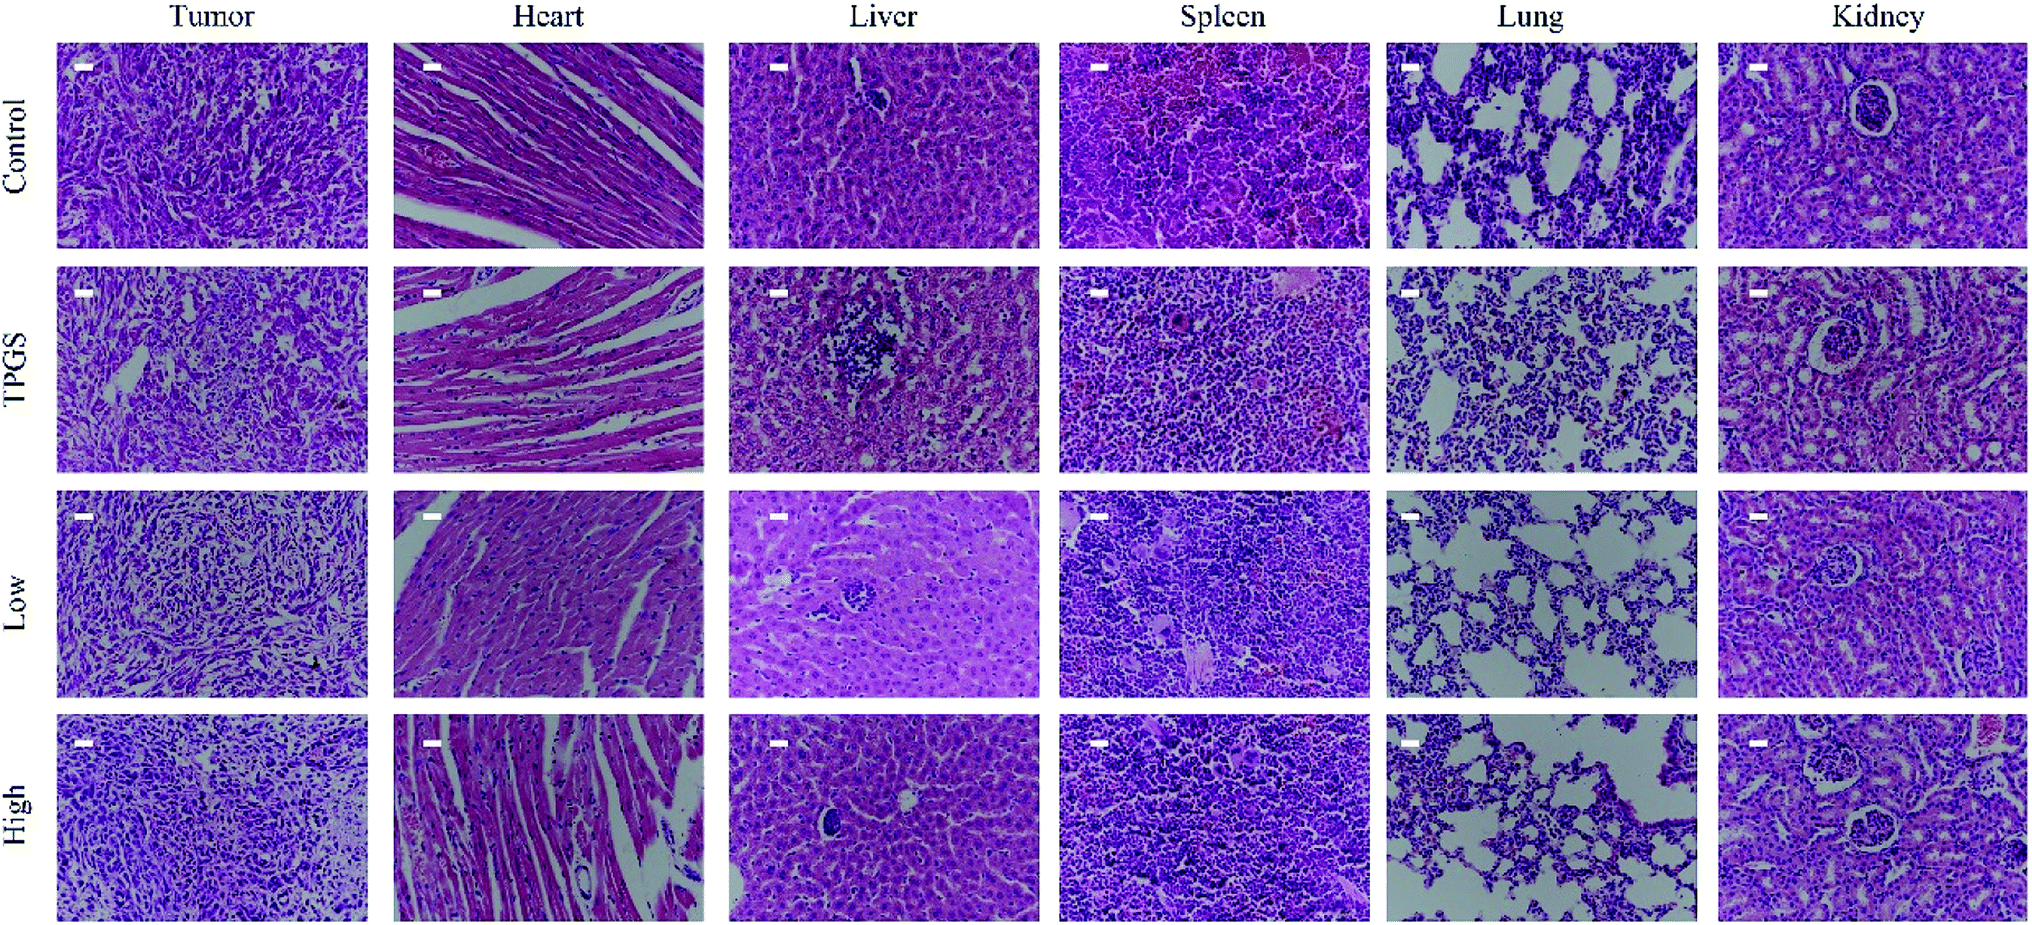 | ||
| Fig. 7 The H&E staining of the organs and the tumors for every group (scale bar 250 μm). | ||
3.5 Hemolysis of red blood cells assay
In order to determine the influence of tested compounds on the process of hemolysis, compound 1 and compound 6 were chosen to carry out the hemolysis assay. The test concentration was in the range of 0–48 μM. As shown in Fig. 8, compound 6 showed hemolytic effect at 24 and 48 μM, and the hemolytic degree was concentration-dependent. While compound 1 did not exhibit hemolytic effect in the test concentration. Hence, this experiment proved that some saponins with the similar parent nucleus possessed stronger hemolysis than sapogenin.16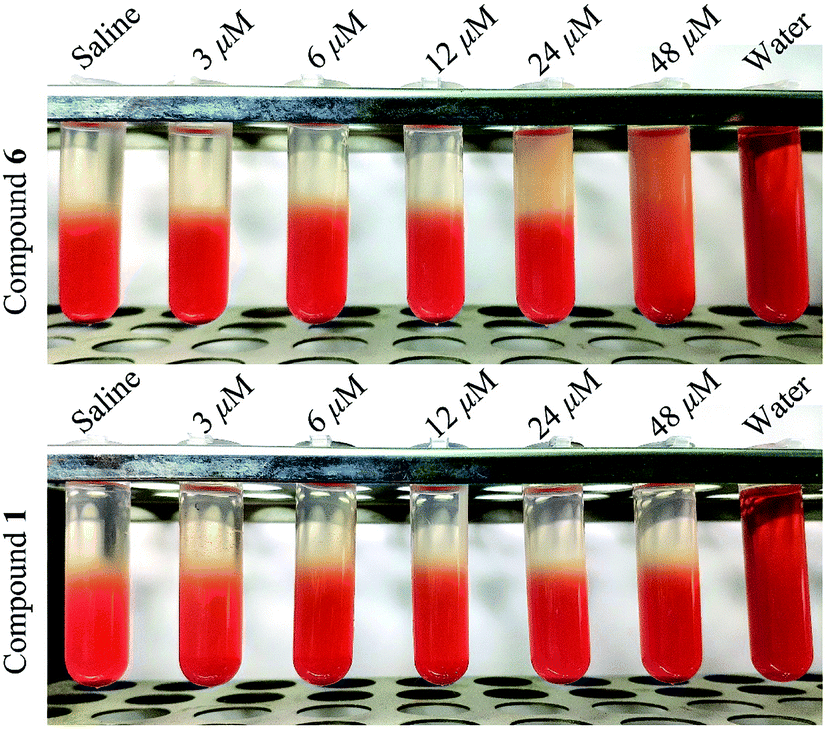 | ||
| Fig. 8 Hemolysis images of compound 1 and compound 6 treated red blood cell under different concentration. | ||
4. Discussion
BATs are one of the most valuable secondary metabolites from natural world. In most cases, BATs exhibit many kinds of biological activities.28 However, the presence of sugar units in BATs glycosides also cause the molecular weight increasing, poor oral bioavailability and many side-effects especially tissue irritation, anaphylaxis or acute renal failure.4 In addition, the saponin can combine with the cholesterol located at cytomembrane of erythrocyte and form insoluble complex, which increase the intracellular osmotic pressure and eventually induce hemolysis. Therefore, in this research, we aim to obtain new barrigenol-type aglycones with lower side-effects and stronger efficacies for the potential anti-tumor agents through the method of acid hydrolysis.In vitro cytotoxic research revealed that two aglycones 1, 2 and saponins 6, 9 showed potent proliferation inhibitory activities against MCF-7 and HeLa cells with the IC50 values lower than 15 μM, while, compound 1, as the main product in the AHP of Semen Aesculi crude extract and an unusual aglycone with a tigloyl unit linked at C-16 position, exhibited the strongest antitumor activity with the IC50 value less than 5 μM. FCM combined with LSCM experiment found that compound 1 could suppress tumor cell proliferation by inducing late apoptosis in a dose-dependent manner with the rate more than 80%.29 Interestingly, compound 1 with a tigloyl at C-16 was afforded from hydrolysate of total saponin, which showed excellent cytotoxicity against MCF-7 and HeLa cell lines. This finding suggested that the isopentenyl at C-16 of BATs plays a key role in inhibiting the proliferation of tumor cells. The tigloyl group in BATs might provide the π bond and the lone pair electrons, which was more likely to be oxidized and performed various nucleophilic reaction, respectively.
It was worth mentioning that although compound 6 (IC50 MCF-7 = 6.5 μM, IC50 HeLa = 4.9 μM) also exhibited strong cytotoxicity on the testing cells, the powerful hemolysis caused by saccharide groups would lead to series side-effects. In the in vivo experiment, the same molar escin of Ia (6) with low dose 1 group treated mice all died in the second day after the administration. While the intravenous administration of compound 1 was a relatively safe and efficacious approach to slow down cancer progression, and no pathological injuries were observed in in vivo experiment mice.
5. Conclusion
Thirteen BATs, including three new aglycones (1–3), two new glycosides (4, 5) and eight known glycosides (6–13) were isolated from the AHP of Semen Aesculi total saponins. Compound 1 was found to be an unusual aglycone with a tigloyl unit linked at C-16 position, which showed potent inhibitory activity against MCF-7 and HeLa cell lines growth, meanwhile, 1 could suppress tumor progression and decreased lung metastasis focuses in mice, and no pathological change was observed at the end of the treatment course, besides that, the hemolysis experiment between 1 and 6 revealed that the hemolysis toxicity of 1 was much less than that of 6. According to these results, compound 1 could be considered as a new promising anti-tumor agent, while the specific antineoplastic mechanism still need further elucidation.Conflicts of interest
There are no conflicts to declare.Acknowledgements
This study was supported by the Program for Liaoning Innovative Talents (No. LR2017041), China; the Project of State Key Laboratory of Bioactive Substance and Function of Natural Medicines (No. GTZK201703), China.References
- D. J. Newman, J. Med. Chem., 2007, 21, 2589–2599 Search PubMed.
- A. Deorukhkar, S. Krishnan, G. Sethi and B. B. Aggarwal, Expert Opin. Invest. Drugs, 2007, 16, 1753–1773 CrossRef CAS.
- D. H. J. Cheong, F. Arfuso, G. Sethi, L. Wang, K. M. Hui, A. P. Kumar and T. Tran, Cancer Lett., 2018, 422, 1–8 CrossRef CAS.
- X. Zhang, S. Zhang, Y. Yang, D. Wang and H. Gao, Phytochemistry, 2019, 161, 41–74 CrossRef CAS.
- H. Matsuda, Y. Li and M. Yoshikawa, Life Sci., 2000, 66, 2233–2238 CrossRef CAS.
- S. Satoh, R. Kreutz, C. Wilm, D. Ganten and G. Pfitzer, J. Clin. Invest., 1994, 94, 1397–1403 CrossRef CAS.
- R. M. Facino, M. Carini, R. Stefani, G. Aldini and L. Saibene, Arch. Pharm., 1995, 328, 720–724 CrossRef CAS.
- J. N. Hu, X. M. Zhu, L. K. Han, M. Saito, Y. S. Sun, M. Yoshikawa, Y. Kimura and Y. N. Zheng, Chem. Pharm. Bull., 20018, 56, 12–16 CrossRef.
- H. Matsuda, Y. Li, T. Murakami, K. Ninomiya, J. Yamahara and M. Yoshikawa, Biol. Pharm. Bull., 1997, 20, 1092–1095 CrossRef CAS.
- J. Y. Mei, M. J. Zhang, Y. Y. Wang and Y. H. Liu, Cancer Med., 2017, 6, 937–943 CrossRef CAS.
- D. Wang, B. Yu, C. Chen, J. Duan, D. Di, X. Xiong, Y. Yang and H. Gao, Nat. Prod. Res., 2018, 32, 997–1003 CrossRef CAS.
- D. Wang, D. Su, B. Yu, C. Chen, L. Cheng, X. Li, R. Xi, H. Gao and X. Wang, Fitoterapia, 2017, 116, 51–60 CrossRef CAS.
- X. Y. Zhou, F. H. Fu, Z. Li, Q. J. Dong, J. He and C. H. Wang, Planta Med., 2009, 75, 1580–1585 CrossRef CAS.
- D. Wang, D. Su, X.-Z. Li, D. Liu, R.-G. Xi, H.-Y. Gao and X.-B. Wang, RSC Adv., 2016, 6, 27434–27446 RSC.
- F. Wei, L. Y. Ma, W. T. Jin, S. C. Ma, G. Z. Han, I. A. Khan and R. C. Lin, Chem. Pharm. Bull., 2004, 52, 1246–1248 CrossRef CAS.
- J. A. Cancelas, S. J. Slichter, N. Rugg, P. G. Pratt, S. Nestheide, J. Corson, E. Pellham, M. Huntington and R. P. Goodrich, Transfusion, 2017, 57, 1218–1225 CrossRef CAS.
- G. Fontana, M. Bruno, M. Notarbartolo, M. Labbozzetta, P. Poma, A. Spinella and S. Rosselli, Bioorg. Chem., 2019, 90, 1218–1225 CrossRef.
- E. Wang, Y. Liu, C. Xu and J. Liu, Food Nutr. Res., 2017, 61, 1–14 Search PubMed.
- G. Guo, A. Tian, X. Lan, C. Fu, Z. Yan and C. Wang, Exp. Ther. Med., 2019, 17, 4080–4088 CAS.
- F. Liu, Q. Zhang, X. Yang, Y. Xi, X. Zhang, H. Wang, J. Zhang, M. Tuerhong, D. Q. Jin, D. Lee, J. Xu, Y. Ohizumi, L. Shuai and Y. Guo, Bioorg. Chem., 2019, 89, 102995 CrossRef CAS.
- Y. L. Ma, F. Chen and J. Shi, OncoTargets Ther., 2018, 11, 1385–1394 CrossRef.
- Y. Zhou, Y. Ji, H. Wang, H. Zhang and H. Zhou, Technol. Cancer Res. Treat., 2018, 17, 1–11 Search PubMed.
- S. Piao, M. Kang, Y. J. Lee, W. S. Choi, Y. S. Chun, C. Kwak and H. H. Kim, Urology, 2014, 84, 982.e1–982.e7 CrossRef.
- J. E. Chang, Y. Liu, T. H. Lee, W. K. Lee, I. Yoon and K. Kim, Int. J. Mol. Sci., 2018, 19, 1596–1613 CrossRef.
- H. S. Lee, J. E. Hong, E. J. Kim and S. H. Kim, Nutr. Cancer, 2014, 66, 938–945 CrossRef CAS.
- N. N. Q. Vo, E. O. Fukushima and T. Muranaka, J. Nat. Med., 2017, 71, 50–58 CrossRef CAS.
- V. Narayanaswamy, Y. Qurishi and S. Chandan, Nano Biomed. Eng., 2017, 9, 96–102 CAS.
- M. S. Butler, A. A. Robertsona and M. A. Cooper, Nat. Prod. Rep., 2014, 31, 1612–1661 RSC.
- G. Mojzisova, M. Kello, M. Pilatova, V. Tomeckova, J. Vaskova, L. Vasko, S. Bernatova, L. Mirossay and J. Mojzis, Acta Biochim. Pol., 2016, 63, 79–87 CrossRef CAS.
- H. Yao, T. Wang, Q. Wu, Y. Liu, P. Li, X. Li and Y. Jin, Chem. Res. Chin. Univ., 2018, 34, 61–66 CrossRef CAS.
- C. de Groot and C. C. Muller-Goymann, Planta Med., 2016, 82, 1496–1512 CrossRef CAS PubMed.
Footnote |
| † Electronic supplementary information (ESI) available. See DOI: 10.1039/c9ra06015d |
| This journal is © The Royal Society of Chemistry 2019 |