 Open Access Article
Identification of ceftazidime interaction with bacteria in wastewater treatment by Raman spectroscopic mapping†
Meng-Wen
Peng‡
,
Xiang-Yang
Wei‡
,
Qiang
Yu
,
Peng
Yan
,
You-Peng
Chen
 * and
Jin-Song
Guo
Key Laboratory of the Three Gorges Reservoir Region's Eco-Environments of MOE, Chongqing University, Chongqing 400045, China. E-mail: ypchen@cqu.edu.cn; Fax: +86-23-65935818; Tel: +86-23-65935818
First published on 15th October 2019
Abstract
Raman spectroscopy yields a fingerprint spectrum and is of great importance in medical and biological sciences as it is non-destructive, non-invasive, and available in the aqueous environment. In this study, Raman spectroscopy and Raman mapping were used to explore the dynamic biochemical processes in screened bacteria under ceftazidime stress. The Raman spectral difference between bacteria with and without antibiotic stress was analyzed by principal component analysis and characteristic peaks were obtained. The results showed that amino acids changed first and lipids were reduced when bacteria were exposed to ceftazidime stress. Furthermore, in Raman mapping, when bacteria were subjected to antibiotic stress, the peak at 1002 cm−1 (phenylalanine) increased, while the peak at 1172 cm−1 (lipids) weakened. This indicates that when bacteria were stimulated by antibiotics, the intracellular lipids decreased and the content of specific amino acids increased. The reduction of intracellular lipids may suggest a change of membrane permeability. The increase of specific amino acids suggests that bacteria resist external stimuli of antibiotics by regulating the activities of related enzymes. This study explored the processes of the action between bacteria and antibiotics by Raman spectroscopy, and provides a foundation for the further study of the dynamics of microbial biochemical processes in the future.
Introduction
With the large-scale use of antibiotics,1 the volume of antibiotics discharged into the aqueous environment is gradually increasing.2–5 The treatment of antibiotic wastewater has become a significant problem in the field of sewage treatment. A large body of research has explored the factors that affect the biological treatment of antibiotic wastewater, i.e., sludge age, reaction time and temperature,6 microbial community,7 and different co-metabolism substrates.8 These studies have explored the mechanism of biodegradation of antibiotics from a macro perspective. However, the morphological changes of single bacteria, and the interaction between microorganisms and antibiotics, are unavailable from a macro perspective. Therefore, a new method to explore the interaction from micro scale is urgently required.Single-cell techniques such as flow cytometry, scanning probe microscopy, and fluorescence microscopy have been used to explore the information in cells. Fast, high-throughput biological analysis could be achieved by flow cytometry. However, spatial information is missing.9,10 Morphological information of individual cell membranes and organelles could be obtained by scanning probe microscopy, while the cells were exposed to stress and the normal physiological functions of the cells were affected.11 Fluorescence microscopy provided a wealth of information for the study of cell biological processes at the single-cell level. However, fluorescence technology also requires the use of labeled molecules, which interfere with the microenvironment of the cells and the functions of labeled molecules. It is therefore difficult to obtain the correct intrinsic information of biomolecules.12 Raman spectroscopy, as a “fingerprint” spectrum of a material molecule,13 enables in situ, non-invasive, and label-free detection of samples,14,15 and has been increasingly used in biological and medical research.16–19
In recent years, Raman spectroscopy has successfully been applied to investigate bacteria–antibiotics interactions. For example, the interaction of vancomycin with Enterococci20,21 and the interaction between fluoroquinolones and Gram-positive bacteria22,23 were observed by Raman spectroscopy, as was the inhibition of β-lactamase by tazobactam.24 Furthermore, the interaction of ceftazidime with Pseudomonas aeruginosa biofilms was obtained by Raman spectroscopy.25 However, little attention has been focused on the Raman mapping technique. By integrating large-scale, multi-acquisition Raman spectroscopy data, Raman mapping no longer yields only a simple spectrogram, but enables a statistical description of the entire region. The generated pseudo-color maps directly reflect the distributions and concentrations of the targets in the samples, and realize real-time monitoring of the targets.26,27 This Raman mapping technique yields the distributions of particles in a single living cell, the structure and distributions of DNA, proteins, and lipids.28–31 In the present study, the Raman mapping technique was used to explore the dynamics of microbial biochemical processes, shown for the interaction of nilotinib with chloroquine in lysosome32 and the dynamics of lipid uptake in macrophages.33
Here, the Raman mapping technique was employed to monitor the interaction between microorganisms and antibiotics. Since cephalosporins were first produced in China,1 and cephalosporins are one of the most widely used in agricultural production and disease cure, thus, cephalosporins were used as experimental antibiotics in this study. The antibiotic-resistant strain Bacillus was isolated from activated sludge. A systematic characterization of the effects of Bacillus and ceftazidime was conducted by both Raman spectroscopy and Raman mapping. The changes in spectrum over time are presented. This study demonstrates the potential of monitoring the bacteria–antibiotics dynamic interaction by Raman spectroscopy, and lays a foundation for the further study of microbial biochemical dynamic processes in the future.
Materials and methods
Culture and screening of resistant bacteria
In this study, ceftazidime (Solarbio, Beijing, China) was used as the antibiotic. It can inhibit the transpeptidase action during the last step of cross-linking of cell wall synthesis, thus affecting cell wall synthesis and leading to bacterial lysis death. 100 µL of ordinary activated sludge was inoculated in Luria–Bertani (LB) media (Tryptone: 10 g L−1, yeast extract: 5 g L−1, NaCl: 10 g L−1) at 1000 mg L−1 of ceftazidime for 48 h at 30 °C under shaking at 120 rpm. Four strains of antibiotic-resistant bacteria were isolated from activated sludge by the streak-plate method. These four strains were identified by 16S rRNA sequencing (Majorbio, Shanghai, China) and the results showed that C10 belonged to Bacillus sp., Gram-negative bacteria, C1 and C2 belonged to Aeromonas sp., and C12 belonged to Rhodococcus sp. A special spore structure was found in C10 and therefore, C10 was chosen for subsequent experiments.Ceftazidime degradation performance of screened resistant bacteria
C10 and the other three strains were cultured in liquid LB medium overnight. Then, 200 µL of the strains were inoculated in the inorganic medium with 250 mg L−1 ceftazidime for 48 h at 30 °C. 1.5 mL of samples were filtered through 0.22 µm filters, and then, the degradation performance of ceftazidime were determined by liquid chromatograph (Agilent 1260, Germany). The mobile phase was prepared with 0.1 M phosphate buffer (pH 7.4) and methanol at a ratio of 4![[thin space (1/6-em)]](https://www.rsc.org/images/entities/char_2009.gif) :
:![[thin space (1/6-em)]](https://www.rsc.org/images/entities/char_2009.gif) 1. The flow rate was 1.0 mL min−1 and the detection wavelength was 254 nm. The experiment was performed in triplicate.
1. The flow rate was 1.0 mL min−1 and the detection wavelength was 254 nm. The experiment was performed in triplicate.
Raman spectroscopy
Raman spectroscopic analysis was performed with an inVia Reflex micro-Raman spectrometer (Renishaw, UK) equipped with diffraction grating at 1200 lines per mm and four back-illuminated Charge Coupled Device (CCD) cameras (1024 × 256 pixels) cooled to −70 °C. A frequency doubled Nd:YAG solid-state laser with a wavelength of 532 nm was used to excite the Raman signal. The laser light was focused onto the sample using a 100× objective. The spectral resolution was 1 cm−1 and the single-point exposure time was 10 s. The laser power was 50 mW and the scanning wavenumbers ranged from 700 to 1800 cm−1. Calcium fluoride was used as substrate.Raman mapping of bacteria under ceftazidime stress
After addition of ceftazidime (1000 mg L−1) to the bacterial culture, C10 was cultured in liquid LB medium at 30 °C under shaking at 120 rpm. 1 mL bacterial culture was sampled at 0, 30, 60, 90, and 120 min, respectively. Samples were centrifuged (5000g, 5 min, room temperature) and washed three times with deionized water. Raman spectra were extracted immediately after sample preparation.Raman mapping was performed in the same test conditions as Raman spectra detection. The spectral resolution was 1 cm−1 and the single-point exposure time was 10 s. The spot size is 1 µm. The scanning step was 0.5 µm and the laser power was 50 mW. The scanning wavenumbers ranged from 700 to 1800 cm−1. The scan area depended on the target bacterium size and the scan time span increased with increasing scan size.
Scanning electron microscopy (SEM)
SEM images were used to analyze the surface morphology of resistant bacteria C10 after exposure to ceftazidime. At each time point of the short-term exposure experiments, the aliquots were centrifuged at 3000g for 5 min. The pellets were washed three times with 0.1 M phosphate buffer (pH 7.4), and fixed in 0.1 M phosphate buffer (pH 7.4) containing 2.5% glutaraldehyde at 4 °C for 4 h. After rinsing twice with 0.1 M phosphate buffer (pH 7.4), the pellets were dehydrated in acetone serials (30%, 50%, 70%, 80%, 90%, and 100%) and isoamyl acetate (15 min per step), and then air-dried. The images were obtained using the JSM-7800F SEM (JEOL, Japan) at 5.0 kV.Results and discussion
Antibiotic degradation of the screened bacteria
The concentration changes of ceftazidime in the medium are shown in Fig. 1. The concentration of antibiotics in the control group (media without bacteria) decreased, indicating that ceftazidime itself degraded slowly under cultured conditions, which was consistent with a previous report.34 As shown in Fig. 1, the concentration of ceftazidime in the media with Strain C10 declined faster than that of the control group, suggesting that a subset of ceftazidime was degraded by C10. After subtracting the self-degradation of ceftazidime, the degradation efficiency of ceftazidime by C10 at 48 h was 28.96%. Ceftazidime in the medium with three other strains C1 (Aeromonas sp.), C2 (Aeromonas sp.), and C12 (Rhodococcus sp.) was also obviously biodegraded, and the degradation ratios of the antibiotic by these strains were 18.24%, 41.99%, and 45.44%, respectively. The Raman spectra of these four strains were collected, and baseline correction, normalizing, and smoothing the spectra were performed. The Raman spectra of these four strains are shown in Fig. S1.† Compared with other strains, the Raman signals of C10 were stronger and C10 showed more peaks. Therefore, the performance of Bacillus C10 was further explored in this study.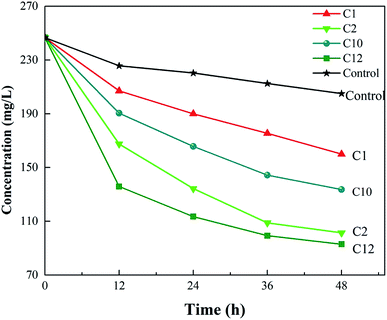 | ||
| Fig. 1 Antibiotic degradation for 48 h by different strains isolated from activated sludge at the ceftazidime concentration of 250 mg L−1. | ||
Raman spectroscopy of single-bacterial and multi-bacterial samples
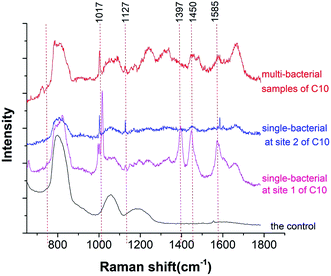
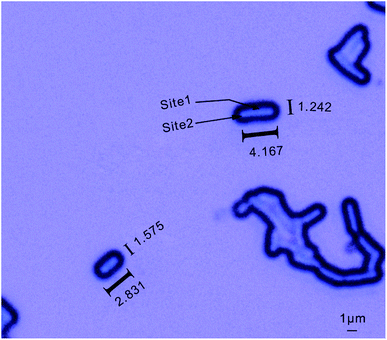
As shown in Fig. 2, significant differences were found in the Raman spectra measured between the multi-bacterial sample and the single-bacterial sample. The Raman spectra measured at different test sites of the same single bacterium were also different (Fig. 2). Bacillus (C10) was about 3–4 µm long and 1–1.5 µm in diameter (Fig. 3). The size of the Raman spectroscopy laser spot was about 1 µm. Thus, Raman spectroscopy could measure the spectral information of the bacterium at different positions, which meant that Raman spectroscopy had an information resolution at the micrometer scale. The main peaks measured at site 1 of C10 were at wavelengths of 1017 cm−1, 1397 cm−1, 1450 cm−1, and 1573 cm−1 (Fig. 3), which were assigned to the characteristic peaks of calcium pyridine dicarboxylate.35 According to a previous report, Bacillus (C10) contains a spore structure, the main component of which is calcium pyridine dicarboxylate.35 The main peaks of calcium pyridine dicarboxylate were at 1017 cm−1, 1397 cm−1, 1450 cm−1, and 1573 cm−1, which are consistent with the main peaks at site 1. Therefore, the structure at site 1 corresponded to the spore structure of Bacillus. However, at site 2 (Fig. 3), the characteristic peak positions were mainly at 1002 cm−1, 1127 cm−1, and 1585 cm−1, which were assigned to phenylalanine36,37 or oxidized cytochrome bc1,38 and ferrous heme,38 correspondingly. Both of the characteristic peaks corresponded to the composition of protein, thus, the location of site 2 might be the cytoplasm. In this study, the spore structure was accurately identified from other location in Bacillus by Raman spectroscopy; moreover, the characteristic peaks could be used to distinguish Bacillus from other bacteria. This demonstrates the ability of Raman spectroscopy to expose the heterogeneity of bacteria.39,40Although the Raman spectrum can distinguish different locations of single bacteria, some information at weak peaks was still missing due to noise interference. The Raman spectrum of multi-bacteria can provide the total information of the whole bacteria. In multi-bacteria samples, the bacteria overlap, and the different sites in different bacteria are stacked together, thus, the Raman spectra of multi-bacteria are closer to the total Raman signals. Compared with the Raman spectrum of the single-bacterial sample, the Raman signals of multi-bacterial sample were stronger, and more peaks can be detected with higher signal-to-noise ratio. Thus, Raman spectra of single bacteria can be used to identify specific structures in the same bacterial species, and Raman spectra of multi-bacteria can be used to identify the total signals of the whole bacteria and distinguish different bacteria.
Raman spectroscopy of C10 cultured in ceftazidime
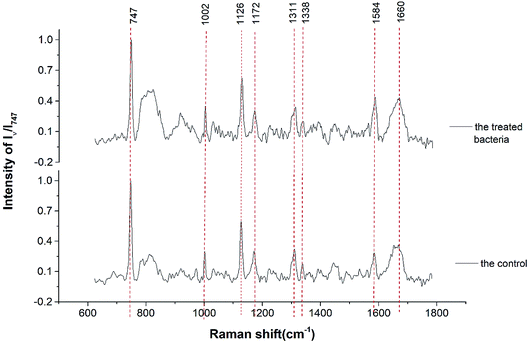
The Raman spectra of treated and untreated bacteria are shown in Fig. 4. The two Raman spectra had similar major peaks of 747 cm−1, 1002 cm−1, 1126 cm−1, 1172 cm−1, 1311 cm−1, 1338 cm−1, 1584 cm−1, and 1660 cm−1. The specific materials represented by the corresponding peaks are shown in Table 1.37,38,41–43 This indicates that the Raman resonances of proteins were stronger than those of lipids and carbohydrates in Bacillus. Due to the small difference in Raman spectroscopy, a more detailed analysis was required with the aid of mathematical analysis.| Raman shift (cm−1) | Assignment | Raman shift (cm−1) | Assignment |
|---|---|---|---|
| 747 | Cytochrome c | 1311 | Polysaccharide |
| 1002 | Phenylalanine | 1338 | Tryptophan |
| 1126 | Cytochrome bc1 | 1584 | Ferrous heme b |
| 1172 | Lipids | 1660 | β sheet, amide I |
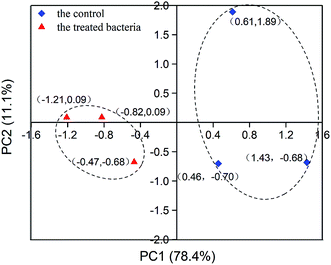
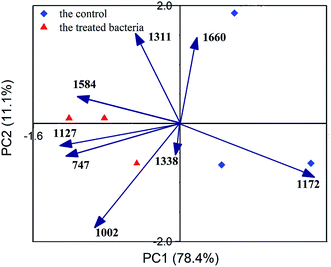
PCA was performed for in-depth differential analysis. Eight main peaks were used as variables. A total of two principal components were extracted, and the cumulative score reached 89.5%, which exceeds 85%, indicating that PCA was effective. In the principal component score plot (Fig. 5), the ceftazidime-treated samples were well separated from the control group. Although the difference was not significant in the Raman spectral information, it was significant by PCA. This meant that the Raman spectrum of ceftazidime-treated bacteria was actually different from that of untreated bacteria, further indicating that the chemical structure of Bacillus changed in response to the ceftazidime environment. To further explore the main composition change, a loadings plot analysis was performed, as shown in Fig. 6.
It showed that the peaks at 1002 cm−1 and 1172 cm−1 were the most affected peaks by ceftazidime exposure. The peak at 1172 cm−1 was obviously decreased in response to ceftazidime. The peak at 1172 cm−1 was assigned to stretching vibration of C–C and P–O of lipids of lipids,37,42,43 which is the key composition of the cell membrane.44 The obvious decrease of lipids in Bacillus might be related to the cell membrane damage. Jayaraman et al. reported that ceftazidime can cause the permeability to increase in the cell membrane and cause membrane damage.45 Thus, the obvious decrease of Raman resonance at wavelength 1172 cm−1 indicated the cell membrane damage of Bacillus due to ceftazidime exposure. The SEM image of Bacillus exposed to ceftazidime was obtained to verify the cell membrane damage, as shown in Fig. 7. A number of wrinkles and damage can be seen on the surface of Bacillus after exposure to ceftazidime, and the degree of wrinkles and damage increased with time. After exposure of 120 min to the ceftazidime environment, many holes and wrinkles accumulated in Bacillus, which indicated heavy damage of both cell wall and cell membrane in Bacillus, and further indicated the accuracy of Raman analysis.
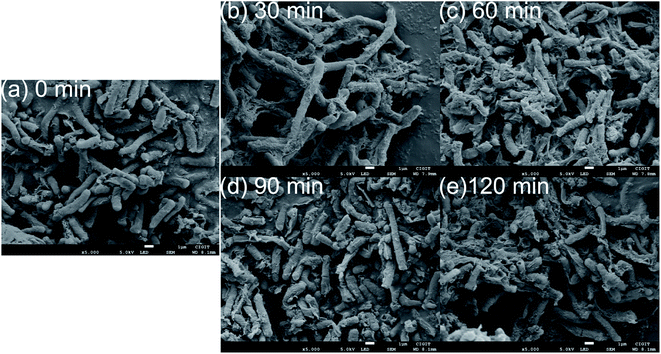 | ||
| Fig. 7 Electron microscopic images of bacteria with tolerance times of 0 min (a), 30 min (b), 60 min (c), 90 min (d), and 120 min (e). | ||
The Raman resonance at wavelength of 1002 cm−1 was another obviously affected peak. The peak at 1002 cm−1 was assigned to phenylalanine,36,37 which is the component of protein. The obvious increase of the phenylalanine-related protein indicated the structural change of protein in response to ceftazidime. This may be related to the up-regulation of several enzymes that are resistant to ceftazidime. Furthermore, the Raman resonance at wavelengths of 747 cm−1, 1127 cm−1, and 1584 cm−1 were enhanced, and these three peaks presented close positive correlation, especially the peaks at 747 cm−1 and 1127 cm−1. The Raman resonance at wavelength of 747 cm−1 was assigned to cytochrome c at 532 nm excitation.41 The similar results of increased cytochrome c in response to antibiotic exposure were reported previously. Pichard et al. reported that the expression of cytochrome c increased in response to exposure to 50 mM rifampicin.46 Park et al. reported that after exposure to all concentrations of fenbendazole, the expression of cytochrome c increased significantly.47 Furthermore, the peaks at 1127 cm−1 and 1584 cm−1 increased in response to exposure to ceftazidime and were highly correlated with the peak at 747 cm−1. The Raman resonance at wavelength of 1127 cm−1 was assigned to cytochrome bc1,47 which is the complex of cytochrome b and cytochrome c. The Raman resonance at wavelength 1584 cm−1 was assigned to ferrous heme b, which is a cofactor of cytochrome.38 Thus, the positively enhanced Raman resonance at 747 cm−1, 1127 cm−1, and 1584 cm−1 indicated the up-regulated expression of cytochrome in Bacillus. Cytochrome is one of the most important enzymes in microbes, and abnormal cytochrome expression indicated that the exposure of ceftazidime disrupts the balance of the bacterial system. In addition, the Raman resonance at wavelengths of 1311 cm−1, 1338 cm−1, and 1660 cm−1, corresponding to polysaccharide, tryptophan, and amide I, were not significantly changed.
Raman mapping of bacteria under ceftazidime stress
The information obtained by Raman spectroscopy is related to the test point. Therefore, by combining the position information of the Raman spectrum with the substance information, the distributions of the measured substances can be obtained.48 With the eight main peaks that were obtained in the experiment presented above, the Raman data at each scanning point was integrated, and the distribution images of the materials corresponding to the wavenumber in the bacteria were obtained (Fig. 8). The deep blue to white color in Fig. 8 indicates that the relative intensity ratio gradually increased. The images obtained by Raman spectroscopy were basically identical to the images of the bacteria in the bright field, and the outlines were clear. The peak intensity of each point was clearly different.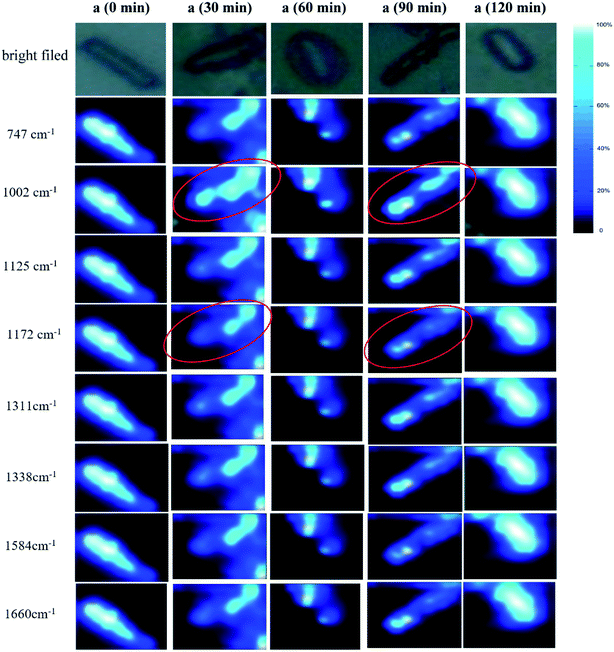 | ||
| Fig. 8 Raman mappings of bacteria in ceftazidime solution with tolerance times of 0 min (a), 30 min (b), 60 min (c), 90 min (d), and 120 min (e). | ||
The distributions of different materials in the same bacteria were similar, and the overall peak intensity of bacteria was strong; therefore, the slight difference was difficult be visualized by observation. All Raman intensities at different wavelengths seem to be the same at 0 min, but in fact, the strongest Raman signals at 747 cm−1 is 4.17 times higher than the weakest Raman signal at 1584 cm−1. This indicated that the Raman intensity without obvious change in Raman imaging did not reveal that the resonance was constant. In contrast, the differences of Raman imaging that can be observed indicated the obvious difference of Raman resonance. The Raman signals at 1002 cm−1 was obviously higher than at other wavelengths at 30 min, and indicated the obvious increase of phenylalanine.
Similar to the Raman signals at 30 min, the Raman signal at 1002 cm−1 at 90 min was also obviously stronger than those at other wavelengths at 90 min. These results are consistent, indicating that the phenylalanine-related protein was up-regulated after ceftazidime exposure. Although the difference between 1002 cm−1 and other wavelengths at 60 min was not as obvious as that at 30 min and 90 min, the Raman intensity at 1002 cm−1 at 60 min was also stronger than at other wavelengths. Equally, the Raman intensity at 1172 cm−1 at 0 min was similar to that at other wavelengths at 0 min; however, the Raman intensities at 1172 cm−1 at 30 min and 90 min was obviously weaker than at the other wavelengths at 30 min and 90 min. The Raman signal changes at the wavelengths of 1002 cm−1 and 1172 cm−1 were most obvious and visible by observation using Raman imaging. This Raman imaging result was consistent with the PCA analysis, indicating that Raman mapping can be used for the monitoring of bacterial dynamic processes.
According to this study, although the difference in Raman spectroscopy was very small, the composition and structure change of Bacillus exposure to ceftazidime can still be obtained. The Raman spectroscopy revealed that the lipids in Bacillus was decrease and the cell membrane was damaged. Furthermore, the abnormal expression of phenylalanine-related protein and cytochrome indicated the disrupted balance of the bacterial system after exposure of ceftazidime. Raman mapping enabled the visual determination of changes in the internal material of bacteria. It visualized the changes in the material distributions better and showed the biochemical processes of bacteria more intuitively.
Conclusion
Antibiotic wastewater treatment is a significant problem that urgently needs to be solved in sewage treatment. How antibiotics affect microorganisms is an important research direction to solve this problem. In the present study, Raman mapping associated with PCA has demonstrated the capability to monitor the interaction between microorganisms and antibiotics, and elucidated the underlying action mechanism. Raman mapping indicated that under ceftazidime stress, a large amount of phenylalanine-related protein and cytochrome produced, and lipids were slightly reduced in Bacillus. Raman spectroscopy can obtain the concentration distributions and change processes of various materials in bacteria. Moreover, Raman mapping can visualize the changes of material distributions more intuitively than Raman spectroscopy, and show the biochemical processes of single bacteria. It is therefore conceivable that Raman spectroscopy will show great potential in the mechanism research of microbial physiological processes in the future.Conflicts of interest
The authors declare that they have no conflict of interest.Acknowledgements
We gratefully acknowledge the financial support of the National Key Research & Development Program of China (2016YFE0205600), the National Natural Science Foundation of China (21876016 and 51578527), the Chongqing Science and Technology Commission (cstc2018jcyjAX0366), and the Fundamental Research Funds for the Central Universities (2018CDQYCH0028).References
- Q. Q. Zhang, G. G. Ying and C. G. Pan, et al., Comprehensive evaluation of antibiotics emission and fate in the river basins of China: source analysis, multimedia modeling, and linkage to bacterial resistance, Environ. Sci. Technol., 2015, 49(11), 6772–6782 CrossRef CAS.
- Z. Cetecioglu, B. Ince and M. Gros, et al., Biodegradation and reversible inhibitory impact of sulfamethoxazole on the utilization of volatile fatty acids during anaerobic treatment of pharmaceutical industry wastewater, Sci. Total Environ., 2015, 536, 667–674 CrossRef CAS.
- X. Yang, R. C. Flowers and H. S. Weinberg, et al., Occurrence and removal of pharmaceuticals and personal care products (PPCPs) in an advanced wastewater reclamation plant, Water Res., 2011, 45(16), 5218–5228 CrossRef CAS.
- H. Chen, L. Jing and Y. Teng, et al., Characterization of antibiotics in a large-scale river system of China: Occurrence pattern, spatiotemporal distribution and environmental risks, Sci. Total Environ., 2018, 618, 409–418 CrossRef CAS.
- C. Miège, J. M. Choubert and L. Ribeiro, et al., Removal efficiency of pharmaceuticals and personal care products with varying wastewater treatment processes and operating conditions-conception of a database and first results, Water Sci. Technol., 2008, 57(1), 49 CrossRef.
- S. F. Yang, C. F. Lin and Y. C. Lin, et al., Sorption and biodegradation of sulfonamide antibiotics by activated sludge: Experimental assessment using batch data obtained under aerobic conditions, Water Res., 2011, 45(45), 3389–3397 CrossRef CAS.
- Y. Zhu, Y. Wang and X. Jiang, et al., Microbial community compositional analysis for membrane bioreactor treating antibiotics containing wastewater, Chem. Eng. J., 2017, 325, 300–309 CrossRef CAS.
- E. Müller, W. Schüssler and H. Horn, et al., Aerobic biodegradation of the sulfonamide antibiotic sulfamethoxazole by activated sludge applied as co-substrate and sole carbon and nitrogen source, Chemosphere, 2013, 92(8), 969–978 CrossRef.
- J. P. Nolan and L. Yang, The flow of cytometry into systems biology, Briefings Funct. Genomics Proteomics, 2007, 6(2), 81–90 CrossRef CAS.
- A. K. Lau, T. T. Wong and K. K. Ho, et al., Interferometric time-stretch microscopy for ultrafast quantitative cellular and tissue imaging at 1 µm, J. Biomed. Opt., 2014, 19(7), 76001 CrossRef.
- M. Krieg, A. R. Dunn and M. B. Goodman, Mechanical control of the sense of touch by β-spectrin, Nat. Cell Biol., 2014, 16(3), 224 CrossRef CAS.
- Z. Yao and R. Carballido-López, Fluorescence imaging for bacterial cell biology: from localization to dynamics, from ensembles to single molecules, Annu. Rev. Microbiol., 2014, 68(1), 459–476 CrossRef CAS.
- P. R. Carey and H. Heidari-Torkabadi, New techniques in antibiotic discovery and resistance: Raman spectroscopy, Ann. N. Y. Acad. Sci., 2015, 1354(1), 67–81 CrossRef CAS.
- R. Mathey, M. Dupoy and I. Espagnon, et al., Viability of 3 h grown bacterial micro-colonies after direct Raman identification, J. Microbiol. Methods, 2015, 109, 67–73 CrossRef CAS PubMed.
- U. C. Schroder, A. Ramoji and U. Glaser, et al., Combined dielectrophoresis-Raman setup for the classification of pathogens recovered from the urinary tract, Anal. Chem., 2013, 85(22), 10717–10724 CrossRef.
- G. Sharma, T. Deckert-Gaudig and V. Deckert, Tip-enhanced Raman scattering-Targeting structure-specific surface characterization for biomedical samples, Adv. Drug Delivery Rev., 2015, 89(19), 42–56 CrossRef CAS.
- U. Neugebauer, U. Schmid and K. Baumann, et al., Towards a detailed understanding of bacterial metabolism-Spectroscopic characterization of Staphylococcus epidermidis, ChemPhysChem, 2007, 8(1), 124–137 CrossRef CAS.
- C. Große, N. Bergner and J. Dellith, et al., Label-free imaging and spectroscopic analysis of intracellular bacterial infections, Anal. Chem., 2015, 87(4), 2137–2142 CrossRef.
- D. Fu, Y. Yu and A. Folick, et al., In vivo metabolic fingerprinting of neutral lipids with hyperspectral stimulated Raman scattering microscopy, J. Am. Chem. Soc., 2014, 136(24), 8820–8828 CrossRef CAS.
- C. Assmann, J. Kirchhoff and C. Beleites, et al., Identification of vancomycin interaction with Enterococcus faecalis within 30 min of interaction time using Raman spectroscopy, Anal. Bioanal. Chem., 2015, 407(27), 8343–8352 CrossRef CAS PubMed.
- U. C. Schroder, C. Beleites and C. Assmann, et al., Detection of vancomycin resistances in enterococci within 3 1/2 hours, Sci. Rep., 2015, 5, 8217 CrossRef.
- U. Neugebauer, U. Schmid and K. Baumann, et al., Characterization of bacterial growth and the influence of antibiotics by means of UV resonance Raman spectroscopy, Biopolymers, 2006, 82(4), 306–311 CrossRef CAS.
- U. Neugebauer, U. Schmid and K. Baumann, et al., The influence of fluoroquinolone drugs on the bacterial growth of S. epidermidis utilizing the unique potential of vibrational spectroscopy, J. Phys. Chem. A, 2007, 111(15), 2898–2906 CrossRef CAS.
- P. R. Carey and H. Heidari-Torkabadi, New techniques in antibiotic discovery and resistance: Raman spectroscopy, Ann. N. Y. Acad. Sci., 2015, 1354(1), 67–81 CrossRef CAS.
- G. B. Jung, S. W. Nam and S. Choi, et al., Evaluation of antibiotic effects on Pseudomonas aeruginosa biofilm using Raman spectroscopy and multivariate analysis, Biomed. Opt. Express, 2014, 5(9), 3238–3251 CrossRef.
- A. Papour, J. H. Kwak and Z. Taylor, et al., Wide-field Raman imaging for bone detection in tissue, Biomed. Opt. Express, 2015, 6(10), 3892 CrossRef CAS.
- S. Stewart, R. J. Priore and M. P. Nelson, et al., Raman imaging, Annu. Rev. Anal. Chem., 2012, 5(1), 337 CrossRef CAS.
- X. Zhang, M. B. J. Roeffaers and S. Basu, et al., Label-free live-cell imaging of nucleic acids using stimulated Raman scattering microscopy, ChemPhysChem, 2012, 13(4), 1054–1059 CrossRef CAS.
- F. K. Lu, S. Basu and V. Igras, et al., Label-free DNA imaging in vivo with stimulated Raman scattering microscopy, Proc. Natl. Acad. Sci. U. S. A., 2015, 112(37), 11624–11629 CrossRef CAS.
- B. Brozek-Pluska, J. Musial and R. Kordek, et al., Raman spectroscopy and imaging: applications in human breast cancer diagnosis, Analyst, 2012, 137(16), 3773–3780 RSC.
- J. W. Kang, P. T. C. So and R. R. Dasari, et al., High resolution live cell Raman imaging using subcellular organelle-targeting SERS-sensitive gold nanoparticles with highly narrow intra-nanogap, Nano Lett., 2015, 15(3), 1766–1772 CrossRef CAS.
- F. Dan, Z. Jing and W. S. Zhu, et al., Imaging the intracellular distribution of tyrosine kinase inhibitors in living cells with quantitative hyperspectral stimulated Raman scattering, Nat. Chem., 2014, 6(7), 614–622 CrossRef.
- C. Stiebing, T. Meyer and I. Rimke, et al., Real-time Raman and SRS imaging of living human macrophages reveals cell-to-cell heterogeneity and dynamics of lipid uptake, J. Biophotonics, 2017, 10(9), 1217–1226 CrossRef CAS.
- T. Yamana and A. Tsuji, Comparative stability of cephalosporins in aqueous solution: kinetics and mechanisms of degradation, J. Pharm. Sci., 1976, 65(11), 1563–1574 CrossRef CAS.
- S. Huang, D. P. Chen and V. Vepachedu, et al., Levels of Ca2+-dipicolinic acid in individual bacillus spores determined using microfluidic Raman tweezers, J. Bacteriol., 2007, 189(13), 4681–4687 CrossRef CAS.
- B. Hernández, F. Pflüger and S. G. Kruglik, et al., Characteristic Raman lines of phenylalanine analyzed by a multiconformational approach, J. Raman Spectrosc., 2013, 44(6), 827–833 CrossRef.
- N. Kuhar, S. Sil and T. Verma, et al., Challenges in application of Raman spectroscopy to biology and materials, RSC Adv., 2018, 8(46), 25888–25908 RSC.
- C. Le Moigne, B. Schoepp and S. Othman, et al., Distinct structures and environments for the three hemes of the cytochrome bc(1) complex from Rhodospirillum rubrum. A resonance Raman study using B-band excitations, Biochemistry, 1999, 38(3), 1066–1076 CrossRef CAS.
- S. Kloss, B. Kampe and S. Sachse, et al., Culture independent Raman spectroscopic identification of urinary tract infection pathogens: a proof of principle study, Anal. Chem., 2013, 85(20), 9610–9616 CrossRef CAS.
- U. Münchberg, P. Rösch and M. Bauer, et al., Raman spectroscopic identification of single bacterial cells under antibiotic influence, Anal. Bioanal. Chem., 2014, 406(13), 3041–3050 CrossRef.
- M. Okada, N. I. Smith and A. F. Palonpon, et al., Label-free Raman observation of cytochrome c dynamics during apoptosis, Proc. Natl. Acad. Sci. U. S. A., 2012, 109(1), 28–32 CrossRef CAS.
- Y. M. Xu, Raman Spectroscopy in Application of Structure Biology, Chemical Industry Press, Beijing, 2005, 1st edn Search PubMed.
- C. Kallepitis, M. S. Bergholt and M. M. Mazo, et al., Quantitative volumetric Raman imaging of three dimensional cell cultures, Nat. Commun., 2017, 8, 14843 CrossRef CAS.
- M. Edidin, Timeline: Lipids on the frontier: a century of cell-membrane bilayers, Nat. Rev. Mol. Cell Biol., 2003, 4(5), 414–418 CrossRef CAS.
- P. Jayaraman, M. K. Sakharkar and C. S. Lim, et al., Activity and interactions of antibiotic and phytochemical combinations against Pseudomonas aeruginosa in vitro, Int. J. Biol. Sci., 2010, 6(6), 556–568 CrossRef CAS.
- L. Pichard, I. Fabre and G. Fabre, et al., Cyclosporin A drug interactions. Screening for inducers and inhibitors of cytochrome P-450 (cyclosporin A oxidase) in primary cultures of human hepatocytes and in liver microsomes, Drug Metab. Dispos., 1990, 18(5), 595 CAS.
- K. Park, H. W. Bang and J. Park, et al., Ecotoxicological multilevel-evaluation of the effects of fenbendazole exposure to Chironomus riparius larvae, Chemosphere, 2009, 77(3), 359–367 CrossRef CAS.
- Z. Farhane, F. Bonnier and H. J. Byrne, Monitoring doxorubicin cellular uptake and 498 trafficking using in vitro Raman microspectroscopy: short and long time exposure 499 effects on lung cancer cell lines, Anal. Bioanal. Chem., 2017, 409(5), 1333–1346 CrossRef CAS.
Footnotes |
| † Electronic supplementary information (ESI) available. See DOI: 10.1039/c9ra06006e |
| ‡ Both authors contributed equally to this study. |
| This journal is © The Royal Society of Chemistry 2019 |

