 Open Access Article
Preparation and thermal treatment influence on Pt-decorated electrospun carbon nanofiber electrocatalysts†
Igor I. Ponomarev *a,
Olga M. Zhigalinabc,
Kirill M. Skupov
 a,
Alexander D. Modestovd,
Victoria G. Basu
 b,
Alena E. Sufiyanovabc,
Ivan I. Ponomareva and
Dmitry Y. Razorenov
 a
a
aA.N. Nesmeyanov Institute of Organoelement Compounds of Russian Academy of Sciences, GSP-1, Vavilova St., 28, Moscow, 119991, Russia. E-mail: gagapon@ineos.ac.ru
bShubnikov Institute of Crystallography of Federal Scientific Research Centre “Crystallography and Photonics” of Russian Academy of Sciences, Leninsky Av., 59, Moscow, 119333, Russia
cBauman Moscow State Technical University, 2-ya Baumanskaya St., 5, Moscow, 105005, Russia
dFrumkin Institute of Physical Chemistry and Electrochemistry of Russian Academy of Sciences, Leninsky Av., 31, Moscow, 119071, Russia
First published on 2nd September 2019
Abstract
Crystalline platinum nanoparticles supported on carbon nanofibers were synthesized for use as an electrocatalyst for polymer electrolyte membrane fuel cells. The nanofibers were prepared by a method of electrospinning from polymer solution with subsequent pyrolysis. Pt nanoneedles supported on polyacrylonitrile pyrolyzed electrospun nanofibers were synthesized by chemical reduction of H2[PtCl6] in aqueous solution. The synthesized electrocatalysts were investigated using scanning, high resolution transmission and scanning transmission electron microscopies, EDX analysis and electron diffraction. The shape and the size of the electrocatalyst crystal Pt nanoparticles were controled and found to depend on the method of H2[PtCl6] reduction type and on conditions of subsequent thermal treatment. Soft Pt reduction by formic acid followed by 100 °C thermal treatment produced needle-shape Pt nanoparticles with a needle length up to 25 nm and diameter up to 5 nm. Thermal treatment of these nanoparticles at 500 °C resulted in partial sintering of the Pt needles. When formic acid was added after 24 h from the beginning of platinization, Pt reduction resulted in small-size spherical Pt nanoparticle of less than 10 nm in diameter. Reduction of H2[PtCl6], preadsorbed on electrospun nanofibers in formic acid with further treatment in H2 flow at 500 °C, resulted in intensive sintering of platinum particles, with formation of conglomerates of 50 nm in size, however, individual particles still retain a size of less than 10 nm. Electrochemically active surface area (ECSA) of Pt/C catalyst was measured by electrochemical hydrogen adsorption/desorption measurements in 0.5 M H2SO4. ECSA of needle-shape Pt nanoparticles was 25 m2 g−1. It increased up to 31 m2 g−1 after thermal treatment at 500 °C, likely, due to amorphous structures removal from carbon nanofibers and retaining of Pt nanoneedle morphology. ECSA of small-size spherical Pt nanoparticles was 26 m2 g−1. Further thermal treatment at 500 °C in vacuum decreased ECSA down to 20 m2 g−1 due to Pt sintering and Pt active sites deactivation. The thermal treatment of small-size spherical Pt nanoparticles in H2 flow at 500 °C produced agglomerates of Pt nanoparticles with ECSA of 14 m2 g−1.
Introduction
Polymer electrolyte membrane fuel cells (or proton exchange membrane fuel cells (PEM FC)) are an important and progressive part of the FC industry.1–5 Further development of polymer membrane FCs depends on finding new functional materials as they require a durability increase of the membrane-electrode assembly (MEA), containing essential parts such as electrodes and membranes.1,6,7 Despite current PEM FC applications in micro-combined heat and power (μCHP) systems8 and auxiliary power units9 (APU), an increase of durability of the electrodes for PEM FC is an important challenge for further development of given area of hydrogen energy studies.10–14 Most of commercial electrodes are based on carbon black which degrades under acidic fuel cell operation conditions, especially at high temperatures.1,10,14 Many carbon nanostructured materials e.g. carbon nanofibers (CNF) are known as more durable materials compared to carbon black,15–18 and their application as metal-electrocatalyst support in the FC electrode may resolve one of the main FC problems related to the durability issues. Pyrolyzed electrospun nanofiber materials with deposited Pt electrocatalyst correspond to the aim to increase durability of PEM FC electrodes, however, their electrocatalytic properties may substantially vary with thermal treatment at different conditions. It is known that the heat treatment of Pt electrocatalyst on carbon support may induce a more uniform Pt distribution resulting in well-defined cubo-octahedron crystallites compared with starting irregular Pt.19 Also, heat treatment at 400–550 °C lead to the highest increase in platinum crystallinity, at the same time, improving platinum particle-size distribution.20 The understanding of post-platinization thermal treatment effect on Pt electrocatalyst properties would lead to optimization and better performance of electrochemical power sources.Electrospinning is a method which allows producing polymer nanofibers from polymer solutions, for example, polyacrylonitrile (PAN) solution.21–23 Then, microporous CNFs are obtained after carbonization (pyrolysis).24 Earlier, we have shown that electrospun CNFs (PAN, or polyheteroarylene based)25–28 are suitable for being a support for Pt nanoparticle electrocatalyst in polymer membrane fuel cell tests29–34 with a shown possible use of polybenzimidazole-type33,35 and other polyheteroarylene36,37 membranes for fuel cells. Our approach allows to uniformly introduce Ni0 and ZrOx into carbon nanofibers using electrospinning method, which is important for electrochemical applications.25,29 Similar Ni, Co and Zn introduction into CNF by electrospinning was also reported and confirmed.38,39 However, further studies are required as fuel cell performance strongly depend on variations in Pt/CNF preparation and post-preparation treatment which strongly influences its morphology. To understand the Pt/CNF preparation effect on fuel cell performance it is important to observe the influence of the Pt/CNF preparation method on the appearance of Pt nanoparticles and CNF in the electrode. Evidently, different Pt/CNF morphology leads to different platinum electrochemically active surface area (ECSA) which is a fundamental measure of Pt-electrocatalyst performance for many electrochemical power sources.
In the current study we present the influence of Pt deposition parameters and post-deposition thermal treatment influence on Pt/CNF morphology and Pt electrochemically active surface area.
Experimental
Pt-decorated carbon nanofiber electrocatalyst preparation
Electron microscopy studies
Structural analysis was performed by transmission electron microscopy (TEM), high-resolution transmission electron microscopy (HRTEM), scanning transmission electron microscopy (STEM), electron diffraction, and energy-dispersive analysis (EDA), using FEI Tecnai Osiris microscope equipped with high-angle annular dark field detector (HAADF) at accelerating voltage of 200 kV, respectively. Elemental analysis and mapping were carried out using a special Super XEDS system (including four silicon Bruker detectors), whose design provides rapid (several minutes) acquisition of large-area elemental maps. For electron microscopy structural investigations, the samples of carbon nanofiber paper were dispersed in acetone using ultrasonic bath for 5–30 min to get single fibers. The suspension obtained was dropped onto Cu lacey carbon grids.XRD studies
X-Ray analysis of the samples was carried out using Co Kα radiation. The qualitative phase analysis was performed in the range of diffraction angles 2θ 30–130° with a step of Δ2θ 0.07° and exposure at the point τ 1.5 s. The following slit system was used during the experiment: a motorized 1 mm slit for the X-ray source, Soller gap with a distance of 2.5 mm between the plates for the X-ray source and detector. To determine the Pt and Ni crystal lattice parameters, Pt (311), Pt (222), Ni (220) and Ni (311) reflections were chosen (2θ step 0.02°, exposure 2 s); the gap in the X-ray source was reduced to 0.25 mm. Each reflection was shot 3 times with the sample reinstalled. Since the diffraction peaks have a large width, the error in determining the crystal lattice parameters is ∼0.001 Å.Cyclic voltammetry
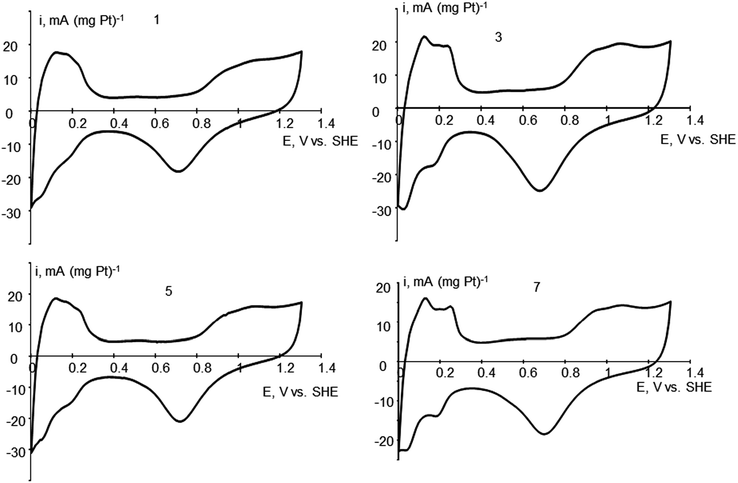
Evaluation of the electrochemically active surface area (ECSA) of platinum in the synthesized electrocatalysts was performed at room temperature in a three-electrode cell with separated compartments by electrochemical hydrogen adsorption/desorption measurements.40,41 Measurements of the electrochemical hydrogen underpotential deposition is a popular approach to assess the ECSA for pure and alloyed Pt catalysts. Hydrogen atoms at Pt surface are produced by electrochemical reduction of protons from aqueous electrolyte. The number of surface atoms at polycrystalline Pt is evaluated from the charge associated with oxidation of adsorbed hydrogen in the potential range 0 to ∼0.4 V versus reversible hydrogen electrode, using the stoichiometry of one adsorbed H atom per single surface Pt atom. The electrochemical cell was filled with 0.5 M H2SO4. Pt wire and Ag/AgCl-saturated KCl (0.2 V vs. standard hydrogen electrode (SHE)) were used as a counter and reference electrodes, respectively. The potential readings are given versus SHE. The working electrode was a polished graphite disk with a diameter of 1.6 cm2 in a polytetrafluoroethylene (PTFE) holder. The disk electrode surface was coated by the studied catalyst by the repeated placing parts of the electrocatalyst ink with intermediate drying at 60 °C. Catalyst inks were prepared by dispersing 2–3 mg of a catalyst Pt/CNF ultrasonically in 0.4 mL of aqueous solution containing 0.2 mL of isopropanol and 0.01 mL of 5 wt% Nafion solution. 100 μL of the ink was dispersed onto the surface of the disk electrode. The voltammograms were recorded at 50 mV s−1 potential scan rate. The potential was cycled until a stable voltammogram was obtained. Usually it took less than 50 cycles for the voltammogram stabilization. The ECSA was evaluated by integration of the hydrogen adsorption/desorption areas of the cyclic voltammograms (CV), assuming 0.21 mC cmPt−2. The capacitance of the double layer that was formed at the electrode/electrolyte interface was taken into account. On the voltammograms, the current readings are normalized per unit of Pt loading at the graphite disk electrode.Results and discussion
Different thermal treatment of Pt/CNF materials is expected to change platinum morphology. As a result, treated materials may differ in their functional properties, which opens the door to obtain materials with predictable properties. For example, different Pt morphology affects FC performance when used as electrocatalyst. Cyclic voltammetry (CV) provides a way to find platinum ECSA. The rate of the oxygen reduction at different modified Pt catalysts is usually related per Pt ECSA in the particular catalyst. Pt morphology, revealed by electron microscopy might be related with ECSA obtained by CV and parameters of Pt/CNF treatment. The data for ECSA for different samples and cyclic voltammograms for samples 1, 3, 5 and 7 are presented on Table 1 and Fig. 1. The shape of the voltammograms in the potential region of hydrogen adsorption/desorption slightly deviates from that of pure polycrystalline Pt40,41 apparently due to possible formation of alloys with Ni on the Pt–Ni surface contact.| Sample, immediate HCOOH addition | Thermal treatment conditions | ECSA, m2 g−1 |
|---|---|---|
| 1 | 100 °C, vacuum | 24.5 |
| 2 | 300 °C, vacuum | 18.0 |
| 3 | 500 °C, vacuum | 30.7 |
| 4 | 500 °C, H2 flow | 4.7 |
| Sample, HCOOH addition after 24 h | Thermal treatment conditions | ECSA, m2 g−1 |
|---|---|---|
| 5 | 100 °C, vacuum | 25.6 |
| 6 | 300 °C, vacuum | 28.9 |
| 7 | 500 °C, vacuum | 19.8 |
| 8 | 500 °C, H2 flow | 14.2 |
Nanoneedle platinum
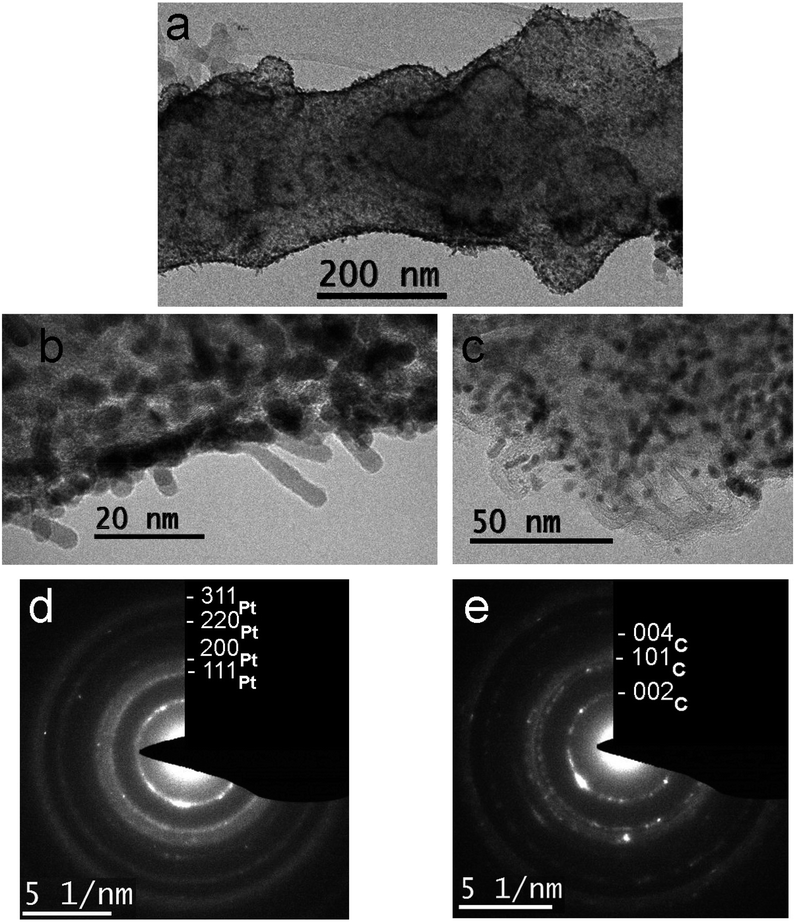
Sample 1 which was obtained by platinization with immediate formic acid addition and further treatment at 100 °C, shows ECSA of 24.5 m2 g−1. Fig. 2 shows TEM images and the corresponding electron diffraction patterns characterizing the fiber structure and the morphology of the Pt coating (particles). One can see a change in the morphology of some fiber fragments caused by the introduction of Vulcan® carbon black in order to increase a surface area of the fibers (Fig. 2a and S1a see ESI†). Platinum particles demonstrate a needle shape (Fig. 2b), the diameter and length of needles are up to 5 and 25 nm, respectively. Particles are located mainly in the surface layer of fibers, and some of them are oriented at an angle to the fibers' axis. Some particles have a spherical shape and a size of several nm, or represent splices (Fig. 2c).The TEM images clearly show a porous structure of the fibers formed by the loops of graphene planes that arise during the annealing process, as described in ref. 25. Some particles form necklaces. A ring diffraction pattern (Fig. 2d) indicates the presence of small Pt particles and the formation of crystalline layers in the nanofiber's body.
When the sample was treated at 300 °C the ECSA decreased to 18 m2 g−1, probably, due to some degradation of Pt nanoparticles. At the same time, morphology does not change significantly. The morphology of platinum varies slightly: fewer areas with needle-like Pt particles, with a small part of particles having a size of about 1 nm. The diffraction pattern (Fig. 2e) indicates a local preferred orientation of the crystal layers in the body of the fibers, as well as a slight increase in size of platinum crystals. Individual bright reflexes correspond to nickel particles present in the sample.29
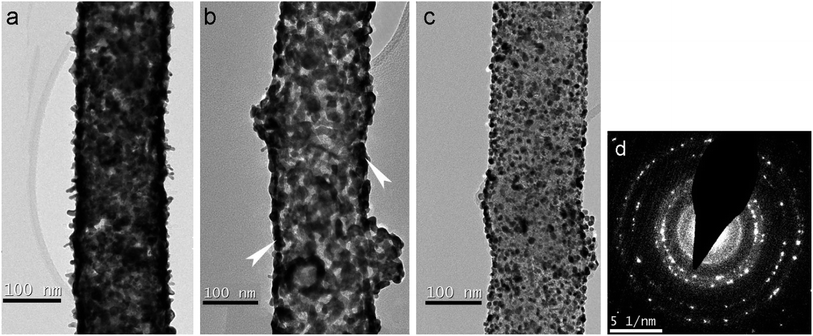
Further treatment at 500 °C leads to partial sintering, but the ECSA surprisingly increased up to 31 m2 g−1. It might be related with Pt activation by thermal treatment, at the same time, visibly, the morphology is changed but Pt-needles are still preserved. Also, heat treatment at 400–550 °C lead to the highest increase in platinum crystallinity, at the same time, improving platinum particle-size distribution, which may explain higher ECSA. An increase of thermal treatment temperature up to 500 °C also leads to a significant change in the structure of platinum coating. Fig. 3 shows the images of three fibers with different morphology of platinum particles. In the first case (Fig. 3a), one can see a preservation of the needle structure of platinum and, at the same time, a sintering of particles on the fiber surface. In the second case (Fig. 3b), only a dense “crust” of the particles sintered during the annealing is present (the arrows indicate clear contours, indicating the formation of a continuous “crust” on the fiber surface). In Fig. 3c, there is a fragment of a fiber with non-sintered Pt particles. In general, the particles are of equilibrium shape, different sizes and do not form a continuous cover on the fiber surface. Apparently, a solid “crust” forms in places where the coating is thick, and separate particles remain in places depleted in platinum. In the diffraction pattern (Fig. 3d), one can observe the fragmentation effect for rings corresponding to platinum, which is caused by partial platinum nanoparticle recrystallization and increase in size.
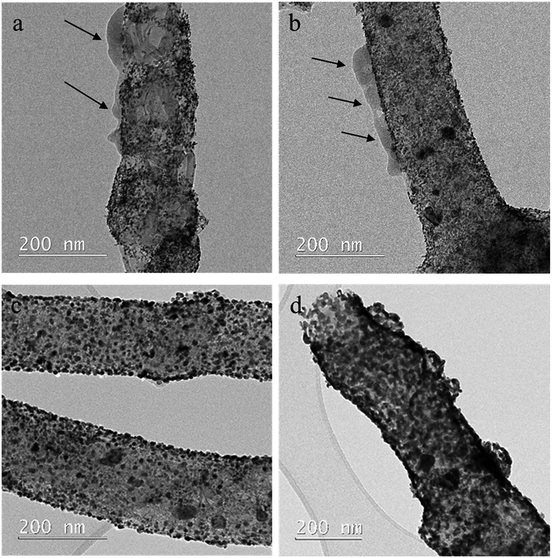
Comparison of TEM images for samples 1 and 3 is shown on Fig. 4. For sample 1 (heat-treatment at 100 °C), amorphous structures are observed on the surface of carbon nanofibers (a and b). For sample 3 (heat-treatment at 500 °C), carbon nanofiber surface and electrocatalyst metal nanoparticle surface are free of the amorphous structures (c and d). So that, after treatment at 500 °C, the amorphous structures completely disappear. It leads to cleaner surface, better accessibility of the electrocatalyst and higher ECSA value. At the same time, the needle microstructure of platinum is preserved, and deactivation of the electrocatalyst active sites due to partial sintering does not happen. These effects affect ECSA and explain its increase for sample 3.
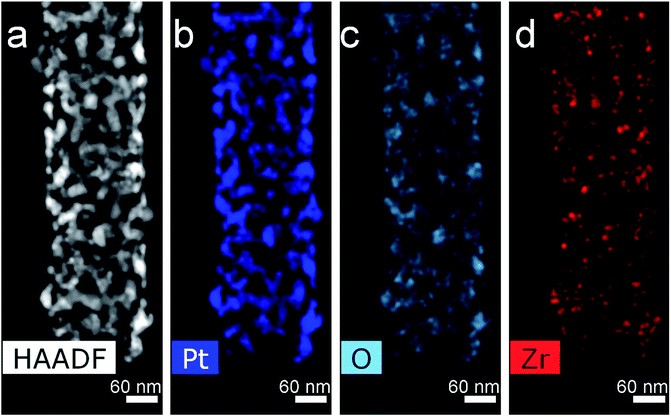
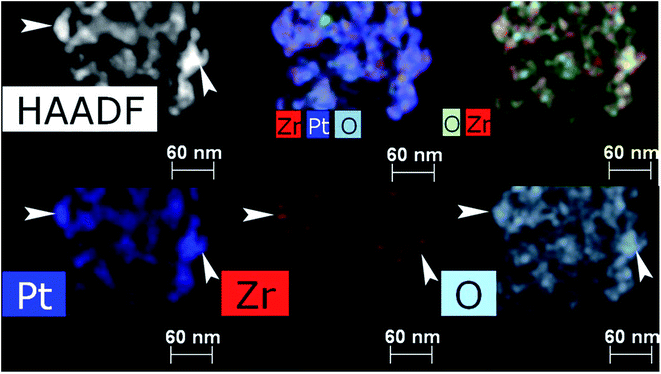
Thermal treatment of the sample at 500 °C in a flow of dry H2 leads to sintering and decrease of ECSA to 4.7 m2 g−1 with total loss of Pt-needles. Treatment at 500 °C in a stream of dry hydrogen was carried out to study the effect of a harder treatment (compared to soft reduction by formic acid only). At the same time, the structural processes noted for the previous sample develop noticeably. In Fig. 5–7 and S2 (see ESI†) one can see a fragment of a fiber with a typical structure where the process of sintering and enlargement of platinum particles is more intensive. At the same time, faceted crystals up to 20–30 nm in size are formed on the surface of the fibers. Some of them demonstrate an equiaxial shape (Fig. 5a and b), others are oriented with the long side along the axis of the nanofiber (Fig. 5c). Comparison and analysis in the HAADF STEM image and EDX mapping allow us to conclude the correlation in the locations of Pt, O and Zr (Fig. 5 and 6). It may indicate on formation of ZrOx. Earlier we have demonstrated by XPS the absence of platinum oxide on similar materials.29 At the elemental maps at higher magnification (Fig. 7), with arrows, which indicate places where a correlation in the location of platinum and oxygen is visible. One can see, that small particles of zirconium oxide are visible. Overlay maps, especially Zr–Pt–O, in addition to individual ones demonstrate the correlation too.
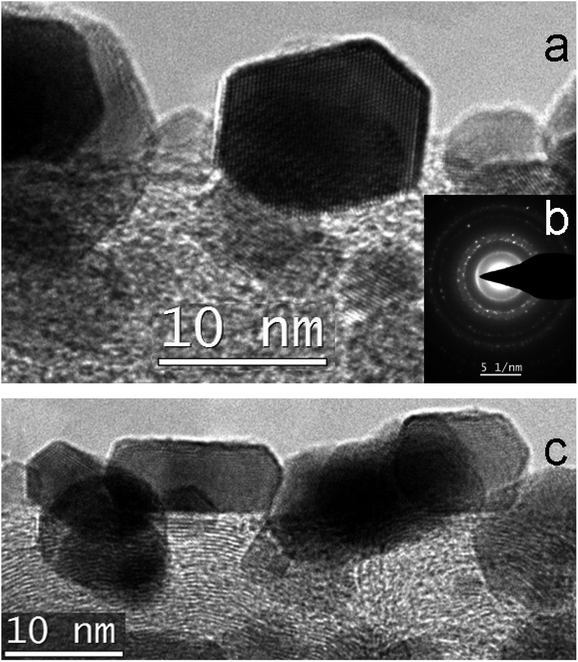 | ||
| Fig. 5 Structure of 4: (a) Detailed HREM image of Pt crystals; (b) SAED pattern; (c) HREM image of Pt faceted crystals. | ||
Spherical nanoparticle platinum
Very different data was obtained when formic acid (HCOOH) addition was delayed by 24 h after the beginning of platinization. Sample 5 (100 °C treatment) is similar to 1 by ECSA (25.6 m2 g−1), at the same time, Pt morphology is completely different (Fig. 8). No Pt-needles are observed. But small size spherical Pt nanoparticles of less than 10 nm could be seen only. It may be explained by the fact that no Pt reduction was observed during first 24 h, but H2[PtCl6] solution penetrated into the pores and adsorbed on the surface much better. When a reducing agent was added, the adsorbed [PtCl6]2− nucleated into spherical particles.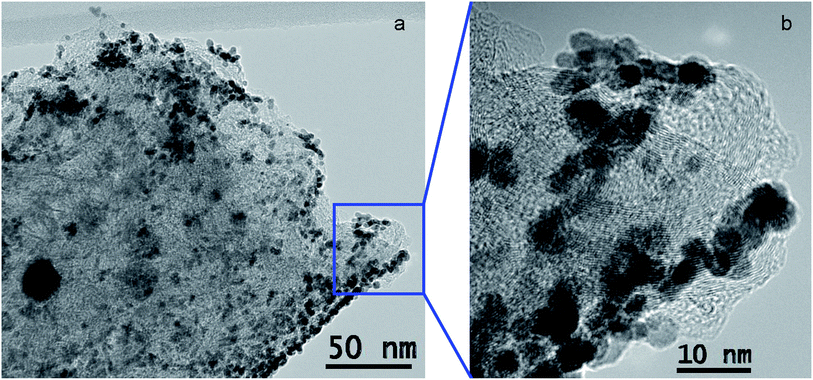 | ||
| Fig. 8 Structure of 5: (a) TEM image of the top of the fiber; (b) enlarged image of a selected part of (a). | ||
Further treatment at 300 °C (sample 6) does not change significantly neither morphology, nor ECSA (28.9 m2 g−1), however, slight sintering and increasing in particle size are observed on Fig. 9.
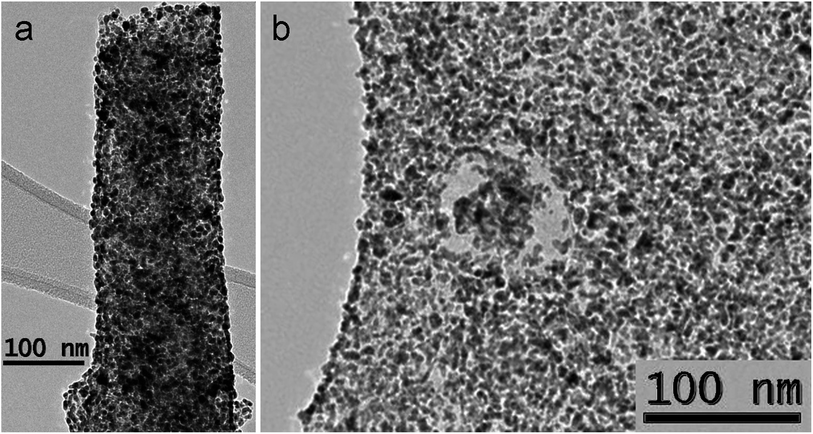 | ||
| Fig. 9 Structure of 6: (a) TEM image of the fiber; (b) enlarged image of slightly sintered Pt nanoparticles. | ||
Thermal treatment at 500 °C (sample 7) leads to drastic changes in Pt morphology with sintering of Pt-nanoparticles (Fig. S3a and b, see ESI†) and lowering of the ECSA value (20 m2 g−1).
Opposite to sample 3, in the case of sample 7, 500 °C treatment does not lead to ECSA increase, but instead, the ECSA value is decreased. It can be explained by higher stability of Pt nanoneedles, and much lower stability of small spherical Pt-nanoparticles toward thermal treatment. The rings in the diffraction pattern (Fig. S3c, see ESI†) turn into groups of reflexes, which indicates an increase in size of platinum nanocrystals and deactivation of the electrocatalyst active sites. So that, despite the cleaning effect which happens at 500 °C leading to disappearance of the amorphous structures and better accessibility of the electrocatalyst, platinum small size spherical microstructure is not preserved and sufficient sintering and particle size increase are observed. It is related to lower stability of 10 nm platinum sphere crystal structure to 500 °C treatment, and explains Pt ECSA value decrease compared to the case of nanoneedle platinum microstructure. So that, for small-size spherical microstructure of Pt, the sintering effect overcomes the cleaning effect, and Pt ECSA decreases.
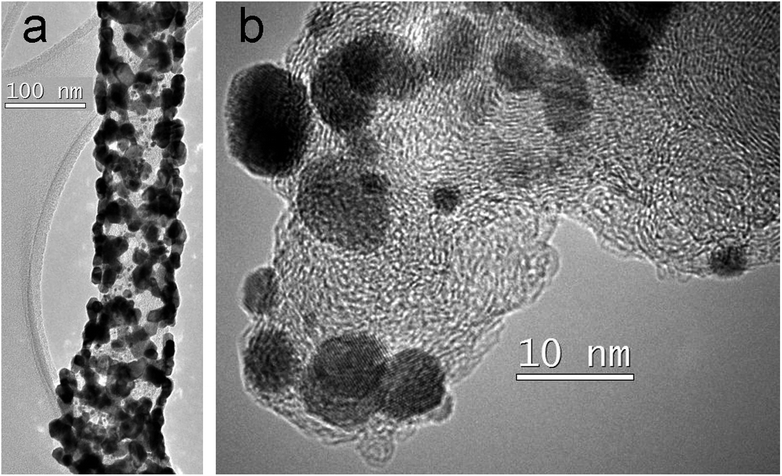
Thermal treatment at 500 °C (sample 8) in a flow of dry hydrogen leads to further decrease of ESCA value to 14.2 m2 g−1 and further degradation of Pt nanoparticles (Fig. 10). Fig. 10a shows a fragment of a fiber with sintered particles well fixed on its surface, individual particles still retain sizes less than 10 nm (Fig. 10b). In addition to individual large particles, one can observe conglomerates with a size of up to 50 nm, which form a continuous cover on the surface of the filaments (Fig. S4a, see ESI†) Fig. S4b† demonstrates large faceted particles in size up to 20 nm.
During pyrolysis step, initial polymer nanofibers crystallize forming CNF with sets of parallel straight graphene layers, as it was shown in our previous studies.25 In the given study, the nanofibers are pyrolyzed at 1000 °C and are already partially crystallized. These CNF contain pores which are made by sets of parallel straight graphene layers. These pores are different in size, Fig. S5 (see ESI†) shows nanofiber parts with large and small pores after heat-treatment at 100 °C in the absence of platinum.
Heat-treatment of platinized CNF at 500 °C is able to introduce sufficient changes in nanofiber microstructure. For example, after 100 °C treatment (sample 5), pores which are made by sets of parallel straight graphene layers, located on the edge of platinized carbon nanofiber are clearly seen (Fig. S6†). After 500 °C treatment (sample 8), the number of pores decreases and the number of layers in graphene sets increases (Fig. S7†). At the same time, the increased in size particles fill the pores, which decrease accessibility of the electrocatalyst and decreases Pt ECSA value. The particles heavily conglomerate, so that, electrocatalyst surface is decreasing (sample 8) after hydrogen treatment at 500 °C.
Earlier detailed studies25 of platinum nanoparticles show microfacet formation with a height comparable with a distance between atoms. These steps (microfacets) and higher surface area correspondingly due to small particle size correlate with higher ECSA value. Sintering of nanoparticles leads to microfacet disappearance which decreases Pt ECSA.
XRD analysis
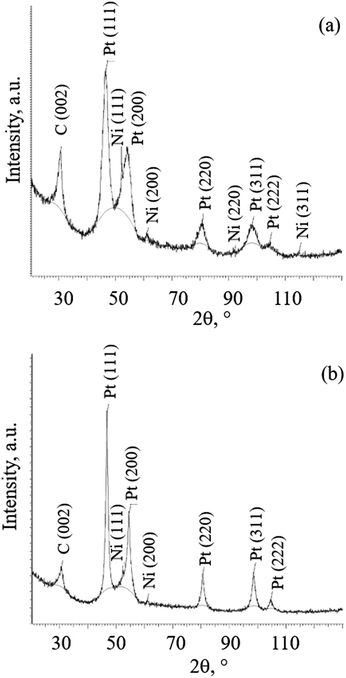
Taking into account a fact that the samples with platinum coating were exposed to high-temperature thermal treatment, platinum crystal lattice parameter was measured to determine a possibility of platinum interaction with nickel. Fig. 11a and b show the diffraction patterns of samples 1 and 3 after heating at different temperatures.In both diffraction patterns for samples 1 and 3, in addition to C (002) reflection, the diffraction peak maxima from face-centered cubic Pt and Ni crystal lattices were recorded. It is noteworthy that after thermal treatment at higher temperature of 500 °C (3), the broadening of the diffraction peaks of Pt decreases noticeably, and the amount of Ni, which is estimated from the relative intensity of its diffraction peaks, decreases. Fig. S10 (see ESI†) show the diffraction patterns of samples 6, 7 and 8 after thermally treated at different temperatures and in different media. For diffraction patterns for samples 6, 7 and 8 the same peaks are recorded. Peak broadening is also decreasing by increasing the heating temperature. The decrease does not depend on the medium. Table 2 shows Pt and Ni crystal lattice parameters obtained from XRD calculations.
| Sample | aPt, Å | aNi, Å |
|---|---|---|
| 1 | 3.923 | 3.518 |
| 3 | 3.916 | 3.526 |
| 6 | 3.918 | 3.520 |
| 7 | 3.915 | 3.524 |
| 8 | 3.913 | 3.521 |
| Pure Pt | 3.924 | — |
| Pure Ni | — | 3.524 |
It can be seen from Table 2 that by increasing the heating temperature, Pt crystal lattice parameter decreases, but the Ni crystal lattice parameter increases. Both Pt and Ni crystal lattice parameters decrease when heated at 500 °C under hydrogen flow (7) compared to the values when heated at 500 °C under vacuum (8). Pt and Ni lattice parameters are higher for 3 than for 7 when heated to 500 °C under vacuum.
Considering the dependence of Pt–Ni solid solution lattice parameter from Ni content to be very close to linear,42,43 and also taking into account lattice parameter values for pure platinum44,45 and nickel45,46 metals, the maximal amount of Ni in Pt lattice during the thermal treatment can be estimated.
The calculation indicates that the maximal amount of Ni in Pt lattice is up to only 2.8%. As Ni nanoparticles in initial CNF play role of seeds for Pt deposition, we assume that Pt completely covers Ni nanoparticle and form a needle in the case of needle-like Pt morphology (Fig. S13, see ESI†). In this case, considering quite low value of Ni calculated Ni content in Pt, an alloy forms only at the contact surface between nickel and platinum, and almost is not formed in the rest of Pt nanoparticle.
Conclusions
Nanocrystal platinum particle decorated electrospun carbon nanofibers were constructed by the electrospinning of polyacrylonitrile, platinization and modification by thermal treatment at different temperatures under vacuum or hydrogen flow. Platinum crystal nanostructures can be engineered by varying Pt reduction procedure, thermal treatment temperature and medium of thermal treatment. It was found that 300 °C thermal treatments almost do not change Pt morphology compared to 100 °C ones. At the same time, 500 °C thermal treatment only slightly affects Pt nanoneedle morphology and leads to Pt ECSA increase for the case when HCOOH was added immediately on platinization step. The increase of Pt ECSA value is probably related to disappearance of the amorphous structures on CNF which may partially cover the electrocatalyst with saving of nanoneedle Pt crystal structures after treatment. Spherical-like Pt nanoparticles (for HCOOH addition after 24 h from the beginning of platinization) degrade by 500 °C thermal treatment and deactivates Pt active sites leading to ECSA decrease due to serious sintering of spherical-like Pt nanoparticles. The presented data allows to conclude the possibility of platinum nanocrystal morphology control depending on Pt deposition procedure and further treatment. So that, the thermal treatment at 500 °C under vacuum of the nanoneedle form of platinum (obtained by immediate HCOOH addition) is found to be optimal platinum deposition procedure and thermal treatment conditions to obtain the electrocatalyst with highest ECSA. Present investigation of nanocrystalline platinum behavior deposited on carbon nanofibers shows one of the possible ways to design electrocatalysts and to improve performances of gas-diffusion electrodes for polymer electrolyte membrane fuel cells.Conflicts of interest
There are no conflicts of interest to declare.Acknowledgements
The study was financially supported by Russian Science Foundation (grant # 18-13-00421). The authors thank Dr K. O. Bazaleeva for the obtaining of XRD results. The electron microscopy investigation was performed using the equipment of the Shared Research Center of Federal Scientific Research Centre “Crystallography and Photonics” RAS. The authors thank the Ministry of Science and Higher Education within the State assignment FSRC “Crystallography and Photonics” RAS in part of XRD results and modelling of electron diffraction patterns.Notes and references
- Q. Li, D. Aili, H. A. Hjuler and J. O. Jensen, High Temperature Polymer Electrolyte Membrane Fuel Cells, Approaches, Status and Perspectives, Springer, Cham, Heidelberg, New York, Dordrecht, London, 2016 Search PubMed.
- J. Zhang, PEM Fuel Cell Electrocatalysts and Catalyst Layers, Fundamentals and Applications, Springer-Verlag, London, 2008 Search PubMed.
- T. Myles, L. Bonville and R. Maric, Catalysts, 2017, 7, 16 CrossRef.
- A. Chandan, M. Hattenberger, A. El-kharouf, S. Du, A. Dhir, V. Self, B. G. Pollet, A. Ingram and W. Bujalski, J. Power Sources, 2013, 231, 264 CrossRef CAS.
- R. K. A. Rasheed, Q. Liao, Z. Caizhi and S. H. Chan, Int. J. Hydrogen Energy, 2017, 42, 3142 CrossRef.
- A. T. Pingitore, M. Molleo, T. J. Schmidt and B. C. Benicewicz, Polybenzimidazole Fuel Cell Technology: Theory, Performance, and Applications, in Fuel Cells and Hydrogen Production. Encyclopedia of Sustainability Science and Technology Series. ed. T. Lipman and A. Weber, Springer, New York, 2019, pp. 477–515 Search PubMed.
- E. Quartarone, S. Angioni and P. Mustarelli, Materials, 2017, 10, 687 CrossRef PubMed.
- A. Arsalis, Renewable Sustainable Energy Rev., 2019, 105, 391 CrossRef.
- Y. Liu, W. Lehnert, H. Janssen, R. C. Samsun and D. Stolten, J. Power Sources, 2016, 311, 91 CrossRef CAS.
- R. Zeis, Beilstein J. Nanotechnol., 2015, 6, 68 CrossRef PubMed.
- S. Authayanum, K. Im-orb and A. Arpornwichnop, Chin. J. Catal., 2015, 36, 473 CrossRef.
- R. E. Rosli, A. B. Sulong, W. R. W. Daud, M. A. Zulkifley, T. Husaini, M. I. Rosli, E. H. Majlan and M. A. Haque, Int. J. Hydrogen Energy, 2017, 42, 9293 CrossRef CAS.
- S. S. Araya, F. Zhou, V. Liso, S. L. Sahlin, J. R. Vang, S. Thomas, X. Gao, C. Jeppesen and S. K. Kaer, Int. J. Hydrogen Energy, 2016, 41, 21310 CrossRef CAS.
- R. Borup, J. Meyers, B. Pivovar, Y. S. Kim, R. Mukundan, N. Garland, D. Myers, M. Wilson, F. Garzon, D. Wood, P. Zelenay, K. More, K. Stroh, T. Zawodzinski, J. Boncella, J. E. McGrath, M. Inaba, K. Miyatake, M. Hori, K. Ota, Z. Ogumi, S. Miyata, A. Nishukata, Z. Siroma, Y. Uchimoto, K. Yasuda, K. Kimijima and N. Iwashita, Chem. Rev., 2007, 107, 3904 CrossRef CAS PubMed.
- S. Chan, J. Jankovic, D. Susac, M. S. Saha, M. Tam, H. Yang and F. Ko, J. Mater. Sci., 2018, 53, 11633 CrossRef CAS.
- H. Zamora, J. Plaza, P. Canizares, J. Lobato and M. A. Rodrigo, ChemSusChem, 2016, 9, 1187 CrossRef CAS PubMed.
- Y. Jeon, J.-I. Park, J. Ok, A. Dorjgotov, H.-J. Kim, H. Kim, C. Lee, S. Park and Y.-G. Shul, Int. J. Hydrogen Energy, 2016, 41, 6864 CrossRef CAS.
- X. X. Wang, Z. H. Tan, M. Zeng and J. N. Wang, Sci. Rep., 2014, 4, 4437 CrossRef PubMed.
- K. S. Han, Y. S. Moon, O. H. Han, K. J. Hwang, I. Kim and H. Kim, Electrochem. Commun., 2007, 9, 317 CrossRef CAS.
- C. W. B. Bezerra, L. Zhang, H. Liu, K. Lee, A. L. B. Marques, E. P. Marques, H. Wang and J. Zhang, J. Power Sources, 2007, 173, 891 CrossRef CAS.
- L. Zhang, A. Aboagye, A. Kelkar, C. Lai and H. Fong, J. Mater. Sci., 2014, 49, 463 CrossRef CAS.
- Z. Dong, S. J. Kennedy and Y. Wu, J. Power Sources, 2011, 196, 4886 CrossRef CAS.
- M. Inagaki, Y. Yang and F. Kang, Adv. Mater., 2012, 24, 2547 CrossRef CAS PubMed.
- N. Yusof and A. F. Ismail, J. Anal. Appl. Pyrolysis, 2012, 93, 1 CrossRef CAS.
- V. G. Zhigalina, O. M. Zhigalina, I. I. Ponomarev, K. M. Skupov, D. Y. Razorenov, I. I. Ponomarev, N. A. Kiselev and G. Leitinger, CrystEngComm, 2017, 19, 3792 RSC.
- I. I. Ponomarev, Y. N. Filatov, I. I. Ponomarev, I. Y. Filatov, D. Y. Razorenov, K. M. Skupov, O. M. Zhigalina and V. G. Zhigalina, Fibre Chem., 2017, 49, 183 CrossRef CAS.
- I. I. Ponomarev, I. V. Blagodatskikh, A. V. Muranov, Y. A. Volkova, D. Y. Razorenov, I. I. Ponomarev and K. M. Skupov, Mendeleev Commun., 2016, 26, 362 CrossRef CAS.
- I. I. Ponomarev, K. M. Skupov, I. I. Ponomarev, D. Y. Razorenov, Y. A. Volkova, V. G. Basu, O. M. Zhigalina, S. S. Bukalov, Y. M. Volfkovich and V. E. Sosenkin, Russ. J. Electrochem., 2019, 55, 552 CrossRef CAS.
- I. I. Ponomarev, K. M. Skupov, A. V. Naumkin, V. G. Basu, O. M. Zhigalina, D. Y. Razorenov, I. I. Ponomarev and Y. A. Volkova, RSC Adv., 2019, 9, 257 RSC.
- K. M. Skupov, I. I. Ponomarev, D. Y. Razorenov, V. G. Zhigalina, O. M. Zhigalina, I. I. Ponomarev, Y. A. Volkova, Y. M. Volfkovich and V. E. Sosenkin, Russ. J. Electrochem., 2017, 53, 728 CrossRef CAS.
- K. M. Skupov, I. I. Ponomarev, D. Y. Razorenov, V. G. Zhigalina, O. M. Zhigalina, I. I. Ponomarev, Y. A. Volkova, Y. M. Volfkovich and V. E. Sosenkin, Macromol. Symp., 2017, 375, 1600188 CrossRef.
- I. I. Ponomarev, K. M. Skupov, D. Y. Razorenov, V. G. Zhigalina, O. M. Zhigalina, I. I. Ponomarev, Y. A. Volkova, M. S. Kondratenko, S. S. Bukalov and E. S. Davydova, Russ. J. Electrochem., 2016, 52, 735 CrossRef CAS.
- M. S. Kondratenko, I. I. Ponomarev, M. O. Gallyamov, D. Y. Razorenov, Y. A. Volkova, E. P. Kharitonova and A. R. Khokhlov, Beilstein J. Nanotechnol., 2013, 4, 481 CrossRef PubMed.
- I. I. Ponomarev, I. I. Ponomarev, I. Y. Filatov, Y. N. Filatov, D. Y. Razorenov, Y. A. Volkova, O. M. Zhigalina, V. G. Zhigalina, V. V. Grebenev and N. A. Kiselev, Dokl. Phys. Chem., 2013, 448, 23 CrossRef CAS.
- I. I. Ponomarev, D. Y. Razorenov, I. I. Ponomarev, Y. A. Volkova and K. M. Skupov, Russ. J. Electrochem., 2014, 50, 694 CrossRef CAS.
- V. V. Emets, I. I. Ponomarev, V. A. Grinberg, N. A. Mayorova, M. Y. Zharinova, Y. A. Volkova, E. A. Nizhnikovskii, K. M. Skupov, D. Y. Razorenov, V. N. Andreev and I. I. Ponomarev, Russ. J. Electrochem., 2017, 53, 86 CrossRef CAS.
- I. I. Ponomarev, V. A. Grinberg, V. V. Emets, N. A. Maiorova, M. Y. Zharinova, Y. A. Volkova, D. Y. Razorenov, K. M. Skupov, I. I. Ponomarev and E. A. Nizhnikovskii, Russ. J. Electrochem., 2016, 52, 525 CrossRef.
- J. Y. Chen, Q. J. Niu, G. K. Chen, J. Nie and G. P. Ma, J. Phys. Chem. C, 2017, 121, 1463 CrossRef CAS.
- Q. Niu, B. Chen, J. Guo, J. Nie, X. Guo and G. Ma, Nano-Micro Lett., 2019, 11, 8 CrossRef CAS.
- H. A. Gasteiger, S. S. Kocha, B. Sompalli and F. T. Wagner, Appl. Catal., B, 2005, 56, 9 CrossRef CAS.
- K. Kinoshita and P. Stonehart, Preparation and Characterization of Highly Dispersed Electrocatalytic Materials, in Modern Aspects of Electrochemistry, No. 12, ed. J. O'M. Bockris and B. E. Conway, Springer, Boston, 1977, vol. 183–266, p. 227 Search PubMed.
- W. B. Pearson, A Handbook of Lattice Spacings and Structures of Metals and Alloys, International Series of Monographs on Metal Physics and Physical Metallurgy, Pergamon Press, London, New York, 1st edn, 1958, vol. 4 Search PubMed.
- G. Bozzolo and J. Ferrante, Scr. Metall. Mater., 1992, 26, 1275 CrossRef CAS.
- Y. Waseda, K. Hirata and M. Ohtani, High Temp. - High Pressures, 1975, 7, 221 CAS.
- ElementData, Mathematica (8.3.0), Wolfram Research Inc., Champaign, IL, 2018 Search PubMed.
- A. Taylor, J. Inst. Met., 1950, 77, 585 CAS.
Footnote |
| † Electronic supplementary information (ESI) available. See DOI: 10.1039/c9ra05910e |
| This journal is © The Royal Society of Chemistry 2019 |

