 Open Access Article
Electrochemical and adsorption behaviors of thiadiazole derivatives on the aluminum surface
Huajie Tanga,
Jianlin Sun *a,
Xudong Yan
 a and
Ping Wuab
aSchool of Materials Science and Engineering, University of Science and Technology Beijing, Beijing 100083, China. E-mail: sjl@ustb.edu.cn; Tel: +86 1062333768
bDepartments of Foundational Science, Beijing Union University, Beijing 100101, China
First published on 28th October 2019
Abstract
The electrochemical and adsorption behaviors of BODTA were studied in a 3.0 wt% NaCl solution via different electrochemical methods. Different concentrations of 2,5-bis(octyldithio)-1,3,4-thiadiazole (BODTA) were dissolved in rolling oil, and then aluminum electrodes coated with rolling oil were applied as the working electrode. The morphology and the elements of the electrode surface were studied via SEM, EDS and XPS. Results showed that BODTA had a slight inhibition efficiency of 10.75% when its concentration was 0.1 wt%; however, with the changes in the BODTA concentration from 0.3 wt%, 0.5 wt% to 0.7 wt%, BODTA had an antagonistic effect on the aluminum surface and accelerated the corrosion. The corresponding inhibition efficiencies became negative, which were −21.53%, −30.34%, and −18.82%. The analysis of elements and chemical states on the surface indicated that Al–N and Al–S bonds were formed between aluminum and BODTA. Furthermore, quantum chemical calculations were also performed, which manifested that N and S atoms were the main reactive sites. S atoms on side chains had a stronger reactivity than those in the thiadiazole ring. Finally, the present study was helpful to understand the electrochemical and adsorption behaviors of BODTA on aluminum, and made contributions to the application of BODTA in rolling oil.
1. Introduction
The chemical and electrochemical corrosion of metal, which will lead to pinholes and corrosion spots on the surface while increasing the surface roughness of mill rolls, has seriously hindered the improvement of the surface quality of aluminum strips and foils in the rolling process. The corrosion problems in the rolling process are more complex so that the corrosion of many metals, such as iron, steel and copper, needs to be considered comprehensively. However, unlike metals, such as iron, steel and copper, the corrosion of aluminum in the rolling process shows a significant difference. In general, the passive layer is easily formed on the surface due to its self-passivating property, which will protect the metal matrix against corrosion.1,2 Unfortunately, the passive layer will be destroyed during the rolling process, and large areas of unoxidized surface will be produced. Once the passive layer is destroyed, large areas of pinholes will be developed on aluminum owing to its high chemical reactivity. Organic compounds dissolved in rolling oil can get adsorbed on the aluminum surface and form a dense, hydrophobic barrier. This barrier insulates the fresh surface from air to some extent, and prevents the formation of the passive layer.3,4 Currently, the high susceptibility of aluminum foils to corrosion is an important issue, particularly for ultra-thin aluminum foils that are thinner than 0.01 mm.5,6 Researchers have attached a great importance to the investigation of the electrochemical behavior of aluminum under a rolling oil environment.7–11The application of organic compounds in the rolling field has been extensively researched and reported.4,12,13 Organic compounds consisting of heteroatoms, such as O, N, P, or S and multiple bonds or aromatic rings, possess good adsorption performance. Electron enrichment sites on molecules promote the adsorption on the metal surface.14–16 The commonly used compounds include triazoles,17 2-mercaptobenzothiazole,18–20 1-pyrrolidinedithiocarbamate21 and 8-hydroxyquinoline. However, organic compounds mentioned above mainly focus on iron, steel and copper. These metals do not have a dense passive layer in the natural environment and show a great difference to aluminum. Xiong et al.19 confirmed that triazoles and their derivates are great inhibitors and they have been successfully used for the protection of copper in the rolling process. However, the electrochemical and adsorption behaviors of thiadiazole and its derivates for aluminum is not clear, but this is completely necessary and important when these compounds are used for the aluminum or copper–aluminum composite rolling process.
In addition, traditional test methods cannot explain the adsorption mechanism of corrosion inhibition. Hence, the quantum chemical calculations play a vital role in optimizing the molecular structure and exploring the adsorption mechanism of the inhibitor.22 The molecular structure of the inhibitor attaches a great importance to the determination of its adsorption mechanism on the metal surface.23 The adsorption behavior of organic compounds on the surface mainly depend on the electron donation ability as well as its acceptance capacity. According to the Frontier molecular orbital theory,24 highest occupied molecular orbital energy (EHOMO) and lowest unoccupied molecular orbital energy (ELUMO) are the main determinants in understanding chemical reactions. Higher EHOMO and lower ELUMO represent a higher molecular reactivity. Hence, the molecules can more easily donate an electron to the metal or accept an electron from the metal. Also, the smaller the energy gap (ΔE = ELUMO − EHOMO), the stronger the adsorption ability.23,25 Furthermore, Fukui function offers a useful approach to predict electron transfer reactivity, which helps researchers to better understand the electronic properties of the functional groups and confirm the main active sites of a molecule.22,26,27
Therefore, due to the similar structure of thiadiazole and its derivatives, this study focuses on 2,5-bis (octyldithio)-1,3,4-thiadiazole (BODTA) and aims to present new insights into its electrochemical and adsorption behaviors on aluminum via experimental and theoretical methods. The morphology, elements and compounds on the aluminum surface were characterized. Finally, a quantum chemical method was employed to further confirm the adsorption mechanism of the optimized BODTA molecule.
2. Methods and computational details
2.1 Materials
The rolling oil was prepared by adding 4 wt% lauryl alcohol (AR, Shanghai Macklin Biochemical Co. Ltd, China) and various concentrations of BODTA (CP, Beijing Pacific Union Petrochemical Co. Ltd, China) into the rolling base oil. The specific performance parameters of the base oil and the structure of BODTA are given in Table 1 and Fig. 1, respectively. Taking the annealing cleanliness of the rolling oil into account, the concentrations of BODTA used in the rolling oil were set as 0, 0.1, 0.3, 0.5, 0.7 wt%, respectively. Moreover, the electrolyte solution was prepared with 3.0 wt% NaCl in deionized water.| Main characteristics | Parameter |
|---|---|
| Kinematic viscosity (40 °C), mm2 s−1 | 1.60–1.75 |
| Flash point (close cup), °C | 80 |
| Boiling range, °C | 205–235 |
| Pour point, °C | −18 |
| Annealing detergency, grade | I |
2.2 Electrochemical measurements
The specimens (10 mm × 10 mm × 1.5 mm) of pure aluminum (99.9 wt%) were embedded in an epoxy resin, leaving a 1 cm2 cross-sectional area as the working electrode for electrochemical experiments. The aluminum specimens were ground up to 2000 grade and mechanically polished to a mirror-like surface using an anti-scuffing paste, followed by degreasing using ethanol, and drying. Electrochemical measurements were performed using an Autolab PGSTAT302 potentiostat/galvanostat. A typical three-electrode system, consisting of an Al working electrode, a saturated calomel electrode (SCE) as the reference electrode, and a platinum electrode as the auxiliary electrode, was applied to the experiment at 25 ± 1 °C. The potential for the potentiodynamic polarization was scanned from −0.7 V to 1.2 V at 1 mV s−1 after a steady open circuit potential was reached in the electrolyte solution. The EIS measurements were performed at an open circuit potential with a 10 mV AC modulation amplitude in the frequency range of 100 kHz to 0.01 Hz. In addition, the open circuit potential (OCP) of the samples were measured for 30 min. Importantly, prior to the electrochemical experiment, BODTA was dissolved in the rolling oil, and then the aluminum electrode was evenly coated with the rolling oil and held for 2 h. The content of rolling oil on the electrode surface was found to be 0.5 g by the application of a balance with an accuracy of 0.01 mg.2.3 Surface characterization
A laser scanning confocal microscope (LSCM, OLS4100) was used to characterize the 3D morphology and the surface roughness of the corroded surface. For further analysis, the microscopic morphology of the Al electrode was observed using a scanning electron microscope (SEM), and its surface elements were analysed via energy dispersive spectroscopy (EDS, EVO 18). In addition, X-ray photoelectron spectroscopy (XPS, AXIS ULTRADLD) was performed to investigate the composition of the residues on the aluminum surface. XPS spectra of the components C, O, N, Na, Al, S and Cl on the sample surface were recorded with monochromatic Al Kα radiations (1486.6 eV). The spectra fitting was performed using the PeakFit v4.12 software and the binding energies were corrected using the binding energy for C 1s at 284.8 eV.282.4 Quantum chemical calculations
The structure of BODTA was optimized by the DMol3 module, employing the GGA-PW91 basis set in the gas phase without any symmetry and constraint. The structure was optimized to ensure the true minima on the potential energy surface. Semi-empirical molecular orbital calculations were used to calculate the highest occupied molecule orbital (HOMO) and lowest unoccupied molecular orbital (LUMO) levels of BODTA at the ground state.29–31 For further detailed analysis of reactivity and adsorption mechanism, Fukui function, which is defined by the following equations,32,33 was performed to precisely predict the main active reaction sites:
 | (1) |
| f−k = qk(N) − qk(N − 1) | (2) |
| f+k = qk(N + 1) − qk(N) | (3) |
| f0k = qk(N + 1) − qk(N − 1) | (4) |
3. Results and discussion
3.1 Electrochemical measurements
Potentiodynamic polarization curves for aluminum evenly coated with rolling oil, containing different concentrations of BODTA in a 3.0 wt% NaCl solution are shown in Fig. 2. The E–i curves are extrapolated from the Tafel region of the linear relationship to a point where the electrochemical parameters are obtained. The relevant electrochemical kinetic parameters, such as corrosion current density (jcorr), corrosion potential (Ecorr), cathodic Tafel slope (βc) and anodic Tafel slope (βa), breakdown potential (Etp), and corrosion inhibition efficiency (η) which is defined by eqn (5), are listed in Table 2.
 | (5) |
 are corrosion current densities of aluminum with different concentrations of BODTA, respectively.34
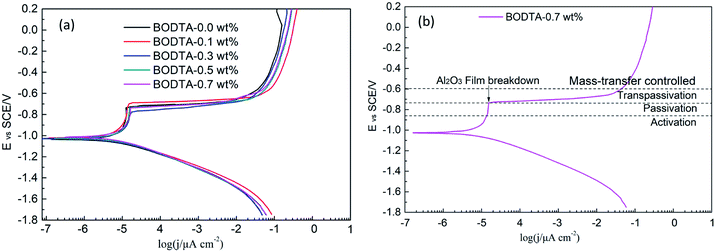 | ||
| Fig. 2 Potentiodynamic polarization curves for (a) aluminum coated with rolling oil containing different concentrations of BODTA, and (b) the detailed analysis of curves in (a). | ||
| Cinh (wt%) | Ecorr vs. SCE/V | jcorr/μA cm−2 | βc/V | βa/V | Etp vs. SCE/V | η (%) |
|---|---|---|---|---|---|---|
| 0 | −1.035 | 9.12 | −0.133 | 0.340 | −0.736 | — |
| 0.1 | −1.020 | 8.14 | −0.138 | 0.404 | −0.699 | 10.75 |
| 0.3 | −1.026 | 11.07 | −0.151 | 0.450 | −0.777 | −21.53 |
| 0.5 | −1.016 | 11.88 | −0.159 | 0.467 | −0.737 | −30.34 |
| 0.7 | −1.027 | 10.83 | −0.151 | 0.442 | −0.735 | −18.82 |
It can be observed that all the Tafel curves have similar cathodic Tafel slopes, which manifests that the cathodic partial reaction essentially remains unchanged with the addition of BODTA. In a case study of a specimen with 0.7 wt% BODTA (Fig. 2b), the anodic polarization curve can be divided into four parts: activation stage, passivation stage, transpassivation stage, and mass-transfer controlled stage. Due to the adsorption of the BOTDA molecule on the surface, a visual shift can be observed in the anodic polarization, particularly in the passivation stage (Fig. 2a). All anodic polarization curves show passivation regions, which have a breakdown potential varying from −0.777 V to −0.699 V. The curve for the aluminum electrode with 0.1 wt% BOTDA has the highest breakdown potential. The shift that occurred in the passivation stage reveals that BODTA mainly influences the formation of the passive layer. Besides, corrosion current density stays in a range from 8.14 μA cm−2 to 11.88 μA cm−2. The specimen with 0.5 wt% BODTA shows the highest corrosion current density, followed by the specimen with 0.3 wt% BODTA. Except for the specimen with 0.1 wt% BOTDA, other specimens have no corrosion inhibition efficiency, which can be clearly observed in Table 2. It can be deduced that BODTA has a certain corrosion inhibition effect at a concentration lower than 0.1 wt%. However, with the increase in the concentration of BODTA, the value of η starts to decrease and the minimum value is −30.34% at the concentration of 0.5 wt%. This indicates that BODTA has a corrosion acceleration effect at concentrations higher than 0.1 wt% BODTA.
To further study the diffusion and charge transfer resistance of the aluminum electrode coated with rolling oil, electrochemical impedance spectroscopy (EIS) measurements were performed at an open circuit potential (OCP) in the frequency range of 100 kHz to 0.01 Hz. The corresponding Nyquist plots are shown in Fig. 3.
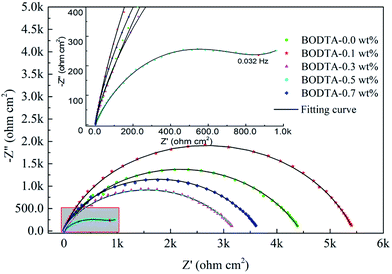 | ||
| Fig. 3 Nyquist plots of aluminum coated with rolling oil containing different concentrations of BODTA. | ||
As can be seen in Fig. 3, in addition to the aluminum electrode with 0.5 wt% BODTA, others show a similar pattern, where a single depressed semicircle can be detected, corresponding to the capacitive loop. The difference from a stand circular shape reveals the frequency dispersion of interfacial impedance.35 The diameter of the capacitive loop is related to the interfacial impedance. The large semicircle represents a large interfacial resistance, which impairs the movement of ions in the electrolyte toward the electrode surface. The aluminum electrode with 0.1 wt% BODTA shows the biggest impedance, followed by the electrodes with 0.0 wt%, 0.7 wt%, and 0.3 wt% BODTA. Particularly, the electrode with 0.5 wt% BODTA shows a different frequency response and has a minimum impedance value. The Nyquist plot shows a depressed semicircle at the high frequency (HF) range, followed by a straight line at the low frequency (LF) range. In general, the HF semicircle is ascribed to the charge transfer resistance and the double layer capacitance.36 LF straight line is induced by the Warburg impedance due to the diffusion of ions to the aluminum surface. The reason for this phenomenon could be ascribed to the antagonistic effect between BODTA and the passive layer, which increases the corrosion and leads to the deposition of corrosion products on the electrode surface. The presence of the Warburg impedance in the electrode with 0.5 wt% BOTDA confirms that the charge transfer is strongly retarded, and the diffusion process is going to play a prominent role in the corrosion process.
Fig. 4 shows the corresponding Bode plots of impedance spectroscopy data in Fig. 3, which reflect the changes occurring either in the coating or at the interface. As can be seen in Fig. 4, except for the electrode with 0.5 wt% BODTA, there is a linear relationship between log![[thin space (1/6-em)]](https://www.rsc.org/images/entities/char_2009.gif) Z vs. log
Z vs. log![[thin space (1/6-em)]](https://www.rsc.org/images/entities/char_2009.gif) f with a slope nearly close to −1, and the phase angle ranges from 0° to 80°. This reveals a typical capacitive behavior and also demonstrates the existence of the CPE exponent. Moreover, the broad phase angle is attributed to the presence of three overlapped time constants. Among them, the time constant at high frequency depends on the composition of the rolling oil coating. The time constant at the medium frequency is related to the interfacial aluminum oxide layer, and the formation of the oxide layer is affected by the content of BODTA in the rolling oil coating. The time constant at the lowest frequency is induced by the charge transfer resistance.
f with a slope nearly close to −1, and the phase angle ranges from 0° to 80°. This reveals a typical capacitive behavior and also demonstrates the existence of the CPE exponent. Moreover, the broad phase angle is attributed to the presence of three overlapped time constants. Among them, the time constant at high frequency depends on the composition of the rolling oil coating. The time constant at the medium frequency is related to the interfacial aluminum oxide layer, and the formation of the oxide layer is affected by the content of BODTA in the rolling oil coating. The time constant at the lowest frequency is induced by the charge transfer resistance.
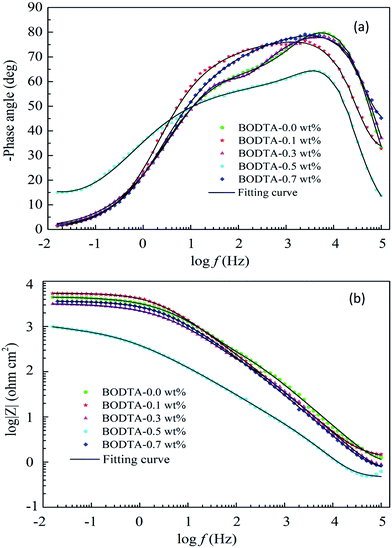 | ||
| Fig. 4 Bode plots of aluminum coated with rolling oil containing different concentrations of BODTA: (a) phase angle, and (b) impedance modulus. | ||
The Bode plot of aluminum with 0.5 wt% BOTDA shows a significantly different variation from others, where its impedance is smaller, and the phase angle changes in a relatively narrow range. It reveals that the antagonistic effect not only weakens the formation of oxide adsorption, but also inhibits the adsorption of BOTDA on the electrode surface. The reduction in the phase angle at high and medium frequencies confirms the antagonistic effect between the oxide layer and BODTA.
Fig. 5 shows the equivalent circuit models for the corresponding EIS spectroscopy data. The impedance spectroscopy data containing the Warburg impedance has been depicted in Fig. 5a. The other data can be described by Fig. 5b. Herein, Rs, Rct, Ro and Rf are the resistances of the NaCl solution, rolling oil coating, oxide layer and adsorption film, respectively. Similarly, Cct and Cdl are the capacitances of the coating and the double layer. The adsorption of BODTA on the surface impedes the transportation of electrons and induces the presence of the Cf capacitance. This further confirms the adsorption of BODTA on the aluminum surface. Based on the previous description, although the capacitance has a certain impedance under the direct current condition, this adsorption also causes the passivation layer to weaken. Besides, CPE results in deviations from an ideal capacitive response.37
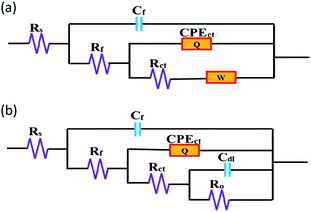 | ||
| Fig. 5 Equivalent circuits used for EIS data: the electrode coated with rolling oil containing (a) 0.5 wt% BODTA, and (b) other concentrations of BODTA. | ||
3.2 Surface morphology and elements
Based on previous research, it can be demonstrated that BODTA would accelerate corrosion when its concentration is more than 0.1 wt%. Although the surface of the aluminum electrode with 0.5 wt% is severely deteriorated, it was observed that aluminum electrodes with BODTA have similar corrosion morphologies and characteristics. Hence, the aluminum electrodes without and with 0.7 wt% BODTA were selected to explain the reason and mechanism of accelerated corrosion.Fig. 6 depicts the 3D surface morphology of aluminum electrodes without and with BODTA before and after potentiodynamic polarization experiments, respectively. The fresh polished electrode surface (Fig. 6a) with an average roughness of 0.011 μm shows a smoother and flatter topography. There are some fine scratches and prominences distributed along the same direction. The maximum height of the prominence is below 0.434 μm. However, the surface of the aluminum electrode after corrosion in Fig. 6b and c was severely damaged due to the aggressive attack by corrosive ions. The large areas of peaks or valleys are present. The electrode surface without BODTA in Fig. 6b shows a rough morphology with an average roughness of 4.367 μm. The peaks on the aluminum surface are relatively small, and the maximum height is below 48.076 μm. In particular, in the presence of BOTDA in Fig. 6c, the surface becomes rougher and shows a more evident deterioration. This is in good agreement with the previous study. Unlike the morphology in Fig. 6b, aluminum surface in the presence of BOTDA has more valleys due to the more serious corrosion. The average roughness of surface with a value of 5.235 μm is significantly larger than that in Fig. 6b. These observations further confirm that 0.7 wt% BODTA in rolling oil is conducive to the corrosion of the aluminum metal. For further analysis of corrosion mechanism, SEM was performed to observe the morphology at high magnification.
A fresh polished aluminum surface before corrosion possesses fine scratches, as can be seen in Fig. 7a, which is in good agreement with the previous observation. However, there has been a serious deterioration of the aluminum surface after corrosion. Similarly, both of the aluminum surfaces without and with BODTA in Fig. 7b and c show characteristics of pitting, which is the main corrosion characteristic for aluminum in this study and induced by Cl− in the electrolyte solution. The large areas of the passive layer always exist on the surface and offer a crucial protection to the aluminum matrix against Cl− corrosion. Cl− permeates into the passive layer and leads to the formation of pits in Fig. 7b and c, which is in line with reported results.38–40 The further development of pitting forms a mesh-like structure. However, there is also a significant difference in morphology between them. Fig. 7b shows uncorroded areas, which are finally proved to be the passive layer. Moreover, slight intergranular corrosion begins on the uncorroded surface. However, the aluminum electrode with 0.7 wt% BODTA in Fig. 7c shows more regions for intergranular corrosion, but the uncorroded passive layer cannot be detected. These observations further define the previous investigation on the 3D morphology. The great difference in morphology and corrosion characteristics demonstrates that BODTA increases the tendency of intergranular corrosion, and the specimen with 0.7 wt% BODTA is more likely to be corroded.
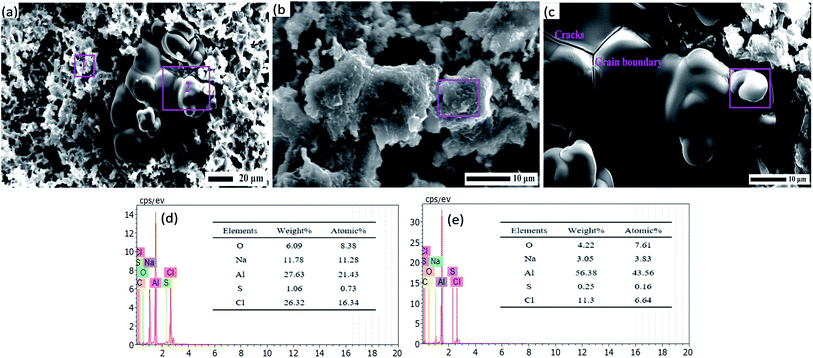
The susceptibility of aluminum to pitting and other localized corrosions is associated with the electrochemical nature of the aluminum matrix.41,42 The preferential adsorption of BOTDA on the surface will lead to the changes in the passive layer and would then affect the priority of corrosion. The SEM images at higher magnifications and the corresponding EDS analyses are used to clearly observe the morphology and elements of the surface. Fig. 8a shows the regions of intergranular corrosion and pitting. Corrosion occurring at grain boundaries causes cracks and the dissolution of grain. It demonstrates that the molecular film can change the corrosion mechanism by preferential adsorption and the further inhibition of ionic diffusion. The regions in Fig. 8b and c contain high numbers of Al, O and Cl, according to the EDS analysis. It shows that the region marked by 1 in Fig. 8a is consisted of corrosion products and Al2O3, and the region marked by 2 in Fig. 8a is the aluminum matrix. Moreover, there is no trace of S and N originated from BODTA molecules due to the dissolution of the molecular film with the increase in the corrosion current. By SEM and EDS analyses, conclusions mentioned previously in potentiodynamic polarization are confirmed.
3.3 XPS analysis
For aluminum, the adsorption of organic compounds can cause the formation of an insoluble layer of corrosion products composed of nonstoichiometric aluminum compounds.38 To further clarify the surface composition of the electrode before and after corrosion, XPS analysis was performed. The XPS survey spectra of the aluminum surface coated with rolling oil containing 0.7 wt% BODTA before and after corrosion are shown in Fig. 9. The peaks with the energies of 72.9 eV and 73.0 eV are assignable to the Al matrix.43,44 Moreover, the peaks, which have the energies of 71.8 eV and 75.3 eV, are attributed to Al 2p1/2 and Al 2p3/2.45,46 The Al 2p signal of the sample before corrosion occurring at 69.7 eV is in an energy range typical for AlN, and the corresponding N 1s signal is observed at 397.7 eV, which well corresponds to the previous report.47–49 The peak for N 1s can also be found at wide spectra in Fig. 9a. The S 2p spectra can be deconvoluted into two pairs of peaks, as shown in Fig. 9e. The two peaks at 161.6 eV and 163.6 eV are attributed to BODTA and Al2S3, respectively.1 The shifts of AlN and Al2S3 to lower binding energies are caused by a charging effect of BODTA molecules, which proves the existence of strong electronic interactions between BODTA and the aluminum surface. Moreover, the corresponding peak for Al2S3 can also be detected at 74.6 eV for Al 2p (Fig. 9b), which is in good agreement with the reported data. The analysis performed for investigating the surface chemical composition and chemical state further illustrates that BODTA molecules form a chemisorption film on the aluminum surface. By comparing the chemical compositions and states of specimens before and after corrosion, the chemisorption film on the surface of aluminum is supported by the presence of AlN and Al2S3 photoemission peaks on the surface. However, the chemisorption film on the aluminum surface is seriously corroded by the electrolyte solution, and the characteristic peaks for AlN and Al2S3 cannot be detected again after corrosion. However, the states for Na+ and Cl− can be clearly observed in Fig. 9a and b.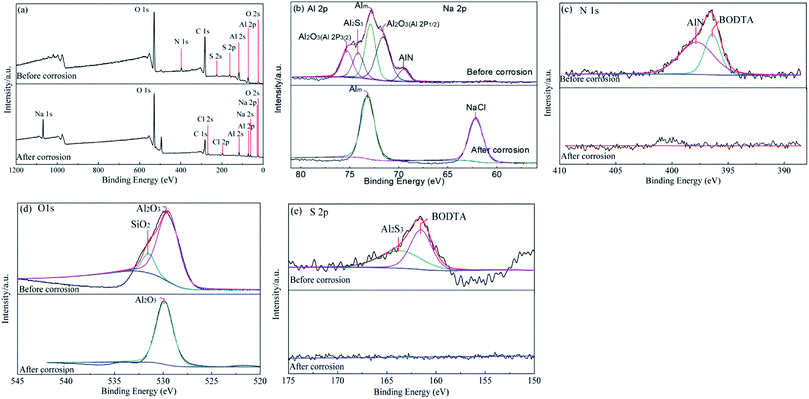 | ||
| Fig. 9 XPS spectra of the aluminum surface coated with rolling oil containing 0.7 wt% BODTA before and after corrosion: (a) wide spectra, (b) Al 2p and Na 2p, (c) N 1s, (d) O 1s, and (e) S 2p. | ||
3.4 Quantum chemical calculations and inhibition mechanism
All the thiadiazole derivatives have analogous structures, and C chains show a negligible relationship with the Fukui function condensed to atoms in and around the thiadiazole ring, particularly when the C chains are long. The optimized structure of BODTA makes C chains and the thiadiazole ring perpendicular to each other based on the steric effect theory.50 Fig. 10 depicts the optimized structure of BODTA used in the calculation and its highest occupied molecular orbital (HOMO) and lowest unoccupied molecular orbital (LUMO), which provide important clues in terms of the evaluation of chemical reactivity. There is a significant relationship between the adsorption activity and the HOMO level. The higher value of HOMO reveals that BODTA has a stronger ability of donating electrons. The lower value of LUMO indicates that BODTA can easily accept electrons from the metal surface. As can be seen in Fig. 10, S and N atoms in the BOTDA molecule make great contributions to the HOMO and LUMO. S atoms in side chains have a lower positive Mulliken charge, and N atoms in the thiadiazole ring have a negative Mulliken charge. This is conducive to electrophilic and nucleophilic attacks. Besides, referring to the reported theoretical data,11 the BODTA molecule has a higher value of HOMO and a lower value of LOMO. Lower energy gap (ΔE = ELUMO − EHOMO) with a value of 3.147 eV allows for easier electron transfer. The energy gap (ΔE) is widely defined as the stability key for the adsorption of organic compounds. The higher value of ΔE will lead to an increase in the ionization potential and the energy needed for removing an electron form the occupied outer orbital and will then reduce the capacity of adsorption.51 The observation makes it easier for the BODTA molecule to interact with electrons on the metal surface. This is why the BODTA molecule has an excellent corrosion inhibition efficiency on copper.19 Finally, it can be demonstrated that BODTA molecule possesses a distinguished adsorption ability. Furthermore, the HOMO and LUMO located in and around the thiadiazole ring reveal that N and S atoms are the main reactive sites, respectively. Hence, the BODTA molecule will easily react with the Al atoms on the surface to form chemical bonds via N and S atoms, which has been demonstrated via the XPS analysis in the previous description. | ||
| Fig. 10 Quantum chemical model of (a) the optimized structure and the corresponding Mulliken charge distributions, (b) HOMO, and (c) LUMO with an isosurface value of 0.03 a.u. for the BODTA molecule. | ||
The Fukui indices of BODTA are listed in Table 3. The thiadiazole ring is the main reactivity group of the BODTA molecule, and two N atoms and five S atoms in and around the thiadiazole ring have the highest values of f−and f+, which are on behalf of strong reactivity. S atoms in side chains have a higher reactivity than those in the thiadiazole ring, but the C atoms show the opposite. Finally, it can be strongly believed that the thiadiazole ring is the reactivity group. N and S atoms are the main reactive sites. Quantum chemical computation shows that the thiadiazole derivatives make an excellent adsorption reactivity and proves the existence of the antagonistic effect from the theoretical perspective.
| Atoms | f− | f+ | Radical | Atoms | f− | f+ | Radical |
|---|---|---|---|---|---|---|---|
| C (1) | 0.007 | 0.028 | 0.017 | C (14) | −0.003 | −0.003 | −0.003 |
| N (2) | 0.047 | 0.036 | 0.041 | C (15) | −0.003 | −0.003 | −0.003 |
| N (3) | 0.047 | 0.035 | 0.041 | C (16) | −0.003 | −0.003 | −0.003 |
| C (4) | 0.007 | 0.027 | 0.017 | C (17) | −0.002 | −0.002 | −0.002 |
| S (5) | 0.098 | 0.124 | 0.111 | C (18) | −0.010 | −0.014 | −0.012 |
| S (6) | 0.159 | 0.130 | 0.144 | C (19) | −0.009 | −0.009 | −0.009 |
| S (7) | 0.157 | 0.129 | 0.143 | C (20) | −0.004 | −0.004 | −0.004 |
| S (8) | 0.130 | 0.146 | 0.138 | C (21) | −0.005 | −0.004 | −0.004 |
| S (9) | 0.128 | 0.146 | 0.137 | C (22) | −0.003 | −0.003 | −0.003 |
| C (10) | −0.010 | −0.014 | −0.012 | C (23) | −0.003 | −0.003 | −0.003 |
| C (11) | −0.009 | −0.008 | −0.009 | C (24) | −0.003 | −0.003 | −0.003 |
| C (12) | −0.005 | −0.005 | −0.005 | C (25) | −0.002 | −0.002 | −0.002 |
| C (13) | −0.004 | −0.004 | −0.004 |
3.5 General discussion
Partial electrochemical reactions occurring in the NaCl electrolyte solution can be shown as follows:| Al → Al3+ + 3e− | (6) |
| 2H2O + 2e− → H2 + 2OH− | (7) |
| Al3+ + 3OH− → Al(OH)3 | (8) |
| 2Al(OH)3 → Al2O3 + 3H2O | (9) |
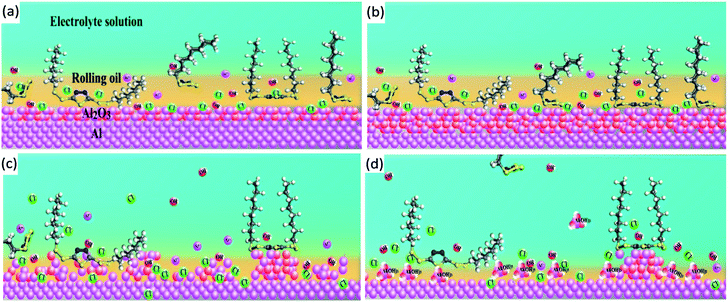 | ||
| Fig. 11 Microscopic corrosion model for the specimen with BODTA at the (a) activation stage, (b) passivation stage, (c) transpassivation stage, and (d) mass-transfer controlled stage. | ||
The adsorption of BODTA on the aluminum surface slows down the diffusion of oxidizing ions (OH−) to the interface and inhibits the oxidization of Al atoms through eqn (6) and (7), thus finally preventing the formation of the Al2O3 passive layer by controlling the reaction through eqn (8) and (9). A thin Al2O3 layer causes a rapid increase in the corrosion current at the activation stage (Fig. 11a). However, at the passivation stage (Fig. 11b), a dense Al2O3 layer is formed because of the accumulation of oxygen-containing ions and groups on the surface, such as OH−, –OH and O2. The corrosion current remains constant with the increasing potential until the Al2O3 layer is broken and dissolved by the breakdown potential. Moreover, a porous alumina layer is formed, and then the pitting begins. In addition to leaving the electrode surface as a result of thermal motion, BODTA also leaves the metal surface due to the anodic dissolution of the metal surface atoms covered by it at the transpassivation stage. When the adsorption–desorption equilibrium is broken and the rate of adsorption cannot catch up with the rate of desorption, the coverage of BODTA molecules on the metal surface decreases rapidly, resulting in a rapid increase in the anodic dissolution of the metal. However, the accumulation of flocculent corrosion products (Al(OH)3) successfully blocks the transfer of Al3+, Cl− and OH−, which prevents the rapid increase of corrosion current, as shown in Fig. 11d. Therefore, it can be ensured that BODTA shows a corrosion inhibition effect by a physical barrier and a chemical repulsion, but the competitive adsorption between BODTA and the oxidizing ions leads to the antagonistic effect.
At a low concentration of BODTA, the molecular film on the surface with a small coverage cannot obviously prevent the formation of the Al2O3 passive layer; to some extent, both of them can slow down the Cl− attack. Under this particular condition, the applied concentration of the corrosion inhibitor is insufficient to fully cover the metallic surface. However, the antagonistic effect becomes apparent when the concentration of BODTA rises to a certain level. The BODTA film on the aluminum surface blocks the transfer of O2, OH− and –OH from solution to surface. Although the Al2O3 passive layer has a greater inhibition efficiency,52 it has no chance of forming owing to the prevention of the BODTA film. Finally, it can be confirmed that the BODTA molecule has a negligible antagonistic effect on aluminum owing to the competitive adsorption behavior with the Al2O3 passive layer.
4. Conclusions
Taking 2,5-bis (octyldithio)-1,3,4-thiadiazole (BODTA) as an example, the present study performed a systematic experimental and theoretical investigation on the electrochemical and adsorption behavior of thiadiazole derivatives. The conclusions are summarized as follows:(1) BODTA molecule has a negligible antagonistic effect on aluminum. When its concentration is 0.1 wt%, the inhibition efficiency is 10.75%. However, BOTDA will cause an accelerated corrosion with the continuous increase in its concentration, and 0.5 wt% BODTA has the strongest corrosion effect.
(2) Al–N and Al–S bonds are formed on the aluminum surface owing to the adsorption of BODTA. The competitive adsorption between BODTA and the passive layer leads to the antagonistic effect and makes an accelerated corrosion.
(3) The most likely reactive sites for both the nucleophilic attack and the electrophilic attack in thiadiazole derivatives are N and S atoms located in and around the thiadiazole ring. S atoms on side chains have a higher reactivity than those in the ring.
Conflicts of interest
There are no conflicts to declare.Acknowledgements
The authors acknowledge the support by Beijing Natural Science Foundation (NO. 2182041) and National Natural Science Foundation of China (NO. 51474025). The author also thanks professor Junhong Chen for his software support in calculation section.References
- Y. Wang, J. D. Xing, S. Q. Ma, B. C. Zheng, H. G. Fu and G. Z. Liu, Corros. Sci., 2016, 112, 25–35 CrossRef CAS.
- L. G. Qin, W. J. Zhao, H. Hou, Y. C. Jin, Z. X. Zeng, X. D. Wu and Q. J. Xue, RSC Adv., 2014, 4, 60307–60315 RSC.
- T. K. Pal, Mater. Manuf. Processes, 2005, 20, 717–726 CrossRef CAS.
- J. L. Sun, S. N. Du and P. Wu, Carbon, 2018, 140, 338–351 CrossRef.
- R. Vallabhaneni, T. J. Stannard, C. S. Kaira and N. Chawla, Corros. Sci., 2018, 139, 97–113 CrossRef CAS.
- Q. X. Yi, Y. D. He, N. Peng, H. Z. Song, X. F. Yang and X. Y. Cai, Int. J. Miner., Metall. Mater., 2016, 23, 70–76 CrossRef CAS.
- Z. M. Chai, Y. H. Liu, J. Li, X. C. Lu and D. N. He, RSC Adv., 2014, 4, 50503–50509 RSC.
- N. Li, L. P. Feng, D. P. Li, J. Su and Z. T. Liu, Mater. Des., 2016, 92, 129–134 CrossRef CAS.
- L. L. Li, B. Zhang, B. Tian, Y. Zhou, J. Q. Wang, E. H. Han and W. Ke, J. Electrochem. Soc., 2017, 164, C240–C249 CrossRef CAS.
- M. Pisarek, A. Roguska, A. Kudelski, M. Andrzejczuk, M. Janik-Czachor and K. J. Kurzydłowski, Mater. Chem. Phys., 2013, 139, 55–65 CrossRef CAS.
- S. Kaya, P. Banerjee, S. K. Saha, B. Tüzün and C. Kaya, RSC Adv., 2016, 6, 74550–74559 RSC.
- J. Wojciechowski, K. Szubert, R. Peipmann, M. Fritz, U. Schmidt, A. Bund and G. Lota, Electrochim. Acta, 2016, 220, 1–10 CrossRef CAS.
- J. Wysocka, S. Krakowiak and J. Ryl, Electrochim. Acta, 2017, 258, 1463–1475 CrossRef CAS.
- Z. W. Lei, L. Chen, W. L. Wang, Z. L. Wang and C. Zhao, Electrochim. Acta, 2015, 178, 546–554 CrossRef CAS.
- H. F. Ma, S. H. Chen, Z. B. Liu and Y. M. Sun, J. Mol. Struct., 2006, 774, 19–22 CrossRef CAS.
- W. H. Li, Q. He, C. L. Pei and B. R. Hou, Electrochim. Acta, 2007, 52, 6386–6394 CrossRef CAS.
- B. G. Prakashaiah, D. V. Kumara, A. A. Pandith, A. N. Shetty and B. E. A. Rani, Corros. Sci., 2018, 136, 326–338 CrossRef CAS.
- M. Schneider, T. Liebmann, U. Langklotz and A. Michaelis, Electrochim. Acta, 2017, 249, 198–205 CrossRef CAS.
- J. L. Sun, S. Xiong and X. D. Yan, Int. J. Electrochem. Sci., 2016, 11, 10592–10606 Search PubMed.
- J. L. Sun and X. D. Yan, Int. J. Electrochem. Sci., 2017, 12, 11580–11593 Search PubMed.
- Y. J. Qiang, S. T. Zhang, S. Yan, X. F. Zou and S. J. Chen, Corros. Sci., 2017, 126, 295–304 CrossRef CAS.
- Y. J. Qiang, S. T. Zhang, Q. Xiang, B. Tan, W. P. Li, S. J. Chen and L. Guo, RSC Adv., 2018, 8, 38860–38871 RSC.
- S. Das, K. Sa, I. Alam and P. Mahanandia, Mater. Lett., 2018, 232, 232–236 CrossRef CAS.
- G. K. Jayaprakash, B. E. K. Swamy, N. Casillas and R. Flores-Moreno, Electrochim. Acta, 2017, 258, 1025–1034 CrossRef.
- A. Rauf, S. Rauf and M. Mohammad, Electrochim. Acta, 2018, 284, 696–708 CrossRef CAS.
- A. S. Mendkovich, M. A. Syroeshkin, D. V. Nasybullina, M. N. Mikhailov, V. P. Gultyai and A. I. Rusakov, Electrochim. Acta, 2017, 238, 9–20 CrossRef CAS.
- L. Guo, C. Qi, X. Zheng, R. Zhang, X. Shen and S. Kaya, RSC Adv., 2017, 7, 29042–29050 RSC.
- M. A. Amin, E. M. Ahmed, N. Y. Mostafa, M. M. Alotibi, G. Darabdhara, M. R. Das, J. Wysocka, J. Ryl and S. S. A. El-Rehim, ACS Appl. Mater. Interfaces, 2016, 8, 23655–23667 CrossRef CAS.
- L. Guo, S. H. Zhu, S. T. Zhang, Q. He and W. H. Li, Corros. Sci., 2014, 87, 366–375 CrossRef CAS.
- I. Ismail, T. Okajima, S. Kawauchi and T. Ohsaka, Electrochim. Acta, 2016, 211, 777–786 CrossRef CAS.
- N. Malatji, A. P. I. Popoola, O. S. I. Fayomi and C. A. Loto, Int. J. Adv. Manuf. Technol., 2015, 82, 1335–1341 CrossRef.
- R. R. Contreras, P. Fuentealba, M. Galvan and P. Perez, Chem. Phys. Lett., 1999, 304, 405–413 CrossRef CAS.
- H. Jafari, I. Danaee, H. Eskandari and M. RashvandAvei, Ind. Eng. Chem. Res., 2013, 52, 6617–6632 CrossRef CAS.
- Y. J. Qiang, S. T. Zhang, L. Guo, X. Zheng, B. Xiang and S. J. Chen, Corros. Sci., 2017, 119, 68–78 CrossRef CAS.
- D. R. JC, G. JADP and D. Eliane, Corros. Sci., 2010, 52, 2341–2348 CrossRef.
- L. Hu, S. Zhang, W. Li and B. Hou, Corros. Sci., 2010, 52, 2891–2896 CrossRef CAS.
- Y. J. Qiang, L. Guo, S. T. Zhang, W. P. Li, S. S. Yu and J. H. Tan, Sci. Rep., 2016, 6, 33305–33319 CrossRef CAS.
- N. Birbilis and R. G. Buchheit, J. Electrochem. Soc., 2005, 152, B140–B151 CrossRef CAS.
- N. Birbilis, R. G. Buchheit, D. L. Ho and M. Forsyth, Electrochem. Solid-State Lett., 2005, 8, C180–C183 CrossRef CAS.
- C. Q. Li, D. K. Xu, X. B. Chen, B. J. Wang, R. Z. Wu, E. H. Han and N. Birbilis, Electrochim. Acta, 2018, 260, 55–64 CrossRef CAS.
- B. Wang, L. Zhang, Y. Su, Y. Xiao and J. Liu, Acta Metall. Sin. (Engl. Lett.), 2013, 26, 581–587 CrossRef CAS.
- M. A. Jingling, W. Jiuba, L. I. Gengxin and X. V. Chunhua, Corros. Sci., 2010, 52, 534–539 CrossRef.
- S. L. Chang, J. W. Anderegg and P. A. Thiel, J. Non-Cryst. Solids, 1996, 195, 95–101 CrossRef CAS.
- C. J. Jenks, S. L. Chang, J. W. Anderegg, P. A. Thiel and D. W. Lynch, Phys. Rev. B: Condens. Matter Mater. Phys., 1996, 54, 6301–6306 CrossRef CAS PubMed.
- I. Olefjord and L. Wegrelius, Corros. Sci., 1990, 31, 89–98 CrossRef CAS.
- C. M. Abreu, M. J. Cristobal, R. Figueroa and G. Pena, Surf. Interface Anal., 2012, 44, 1039–1044 CrossRef CAS.
- G. Martin, S. Strite, A. Botchkarev, A. Agarwal, A. Rockett, H. Morkoc, W. R. L. Lambrecht and B. Segall, Appl. Phys. Lett., 1994, 65, 610–612 CrossRef CAS.
- G. Martin, A. Botchkarev, A. Rockett and H. Morkoc, Appl. Phys. Lett., 1996, 68, 2541–2543 CrossRef CAS.
- S. S. T. Reiser and J. w. Schultze, Electrochim. Acta, 1998, 43, 149–158 CrossRef.
- J. Chen, W. Shi and C. Xiong, Electrochim. Acta, 2018, 283, 818–825 CrossRef CAS.
- L. Saqalli, M. Galai, F. Benhiba, N. Gharda, N. Habbadi, R. Ghailane and M. Ebn, J. Mater. Environ. Sci., 2017, 8, 2455–2467 CAS.
- D. Schaepers and H. H. Strehblow, Corros. Sci., 1997, 39, 2193–2213 CrossRef CAS.
| This journal is © The Royal Society of Chemistry 2019 |


