 Open Access Article
Preparation of a SnO2–Sb electrode on a novel TiO2 network structure with long service lifetime for degradation of dye wastewater
Li Xuab,
Ye Wangab and
Wen Zhang *ab
*ab
aSchool of Chemical Engineering and Technology, Tianjin University, Tianjin 300350, People's Republic of China. E-mail: zhang_wen@tju.edu.cn
bTianjin Key Laboratory of Membrane Science and Desalination Technology, Tianjin 300350, People's Republic of China
First published on 29th November 2019
Abstract
Developing effective electrodes with long service lifetime for electrochemical degradation of dyes is of paramount importance for their practical industrial applications. We constructed a novel SnO2–Sb electrode (Ti/TiO2-NW/SnO2–Sb electrode) based on a uniform TiO2 network structure decorated Ti plate (Ti/TiO2-NW) for a long-term electrocatalytic performance. The SnO2–Sb coating layer on this electrode was grown on the Ti/TiO2-NW by pulse electrodeposition. The introduction of the three-dimensional TiO2-NW enhances the bonding strength between the Ti substrate and the SnO2–Sb surface coating. An accelerated life test shows that the service life of Ti/TiO2-NW/SnO2–Sb electrode is 11.15 times longer than that of the traditional Ti/SnO2–Sb electrode. The physicochemical properties of the electrodes were characterized through SEM, EDS, XRD and HRTEM. In addition, through LSV, EIS, CV and voltammetric charge analysis, it is found that compared with the traditional electrode, the Ti/TiO2-NW/SnO2–Sb electrode possesses a higher oxygen evolution potential, a lower charge transfer resistance and a larger electrochemical active surface area. Besides, this novel electrode also exhibits an outstanding electrocatalytic oxidation ability for degradation of acid red 73 in simulated sewage. After a 5 hours' test, the removal efficiency of acid red 73 and the COD reached 98.6% and 71.8%, respectively, which were superior to those of Ti/SnO2–Sb electrode (89.1% and 58.8%). This study highlights the excellent stability of the Ti/TiO2-NW/SnO2–Sb electrode and provides an energy-efficient strategy for dye degradation.
1. Introduction
The shortage of water resources is a problem that human beings need to solve urgently. As one of the main sources of water pollution (about 280![[thin space (1/6-em)]](https://www.rsc.org/images/entities/char_2009.gif) 000 tons of textile dyes are discharged annually in the form of wastewater1), dye wastewater has been extensively studied due to its difficulty to degrade and the fact that it contains toxic substances. At present, the common treatment methods of dye wastewater mainly include electrochemistry, biodegradation,2 membrane separation,3 flocculation and sedimentation.4 Among them, electrocatalytic oxidation technology has attracted increasing attention because of its strong catalytic ability and good environmental compatibility.5 The efficiency of this technology is greatly affected by the electrode materials.6,7 Various kinds of electrodes, including IrO2,8 RuO2,9 boron-doped diamond (BDD),10 Pt,11 PbO2 (ref. 12) and SnO2, have been studied. Compared with other electrodes, SnO2 electrode has been well known for its high oxygen evolution potential, low cost and efficient electro-generation of ˙OH.13,14 However, the high charge transfer resistance and low physicochemical stability of SnO2 decreases its application value. Lots of studies have shown that doping Sb into SnO2 can significantly improve its charge transfer ability and produce more ˙OH, which is conducive to the electrocatalytic reaction.
000 tons of textile dyes are discharged annually in the form of wastewater1), dye wastewater has been extensively studied due to its difficulty to degrade and the fact that it contains toxic substances. At present, the common treatment methods of dye wastewater mainly include electrochemistry, biodegradation,2 membrane separation,3 flocculation and sedimentation.4 Among them, electrocatalytic oxidation technology has attracted increasing attention because of its strong catalytic ability and good environmental compatibility.5 The efficiency of this technology is greatly affected by the electrode materials.6,7 Various kinds of electrodes, including IrO2,8 RuO2,9 boron-doped diamond (BDD),10 Pt,11 PbO2 (ref. 12) and SnO2, have been studied. Compared with other electrodes, SnO2 electrode has been well known for its high oxygen evolution potential, low cost and efficient electro-generation of ˙OH.13,14 However, the high charge transfer resistance and low physicochemical stability of SnO2 decreases its application value. Lots of studies have shown that doping Sb into SnO2 can significantly improve its charge transfer ability and produce more ˙OH, which is conducive to the electrocatalytic reaction.
Although the characteristics of Sb-doped SnO2 have been improved to some extent, the short service life of the SnO2–Sb electrode still restrains its practical application. A large number of efforts are being spent to solve this problem. Some researchers have tried to dope elements into the SnO2–Sb coating, such as rare earth elements (Ce, Eu, Gd, etc.15,16) and non-rare earth metal elements (Fe, Bi, Pd, etc.17–19). Doping these elements can change the structure of the surface coating, thus enhancing the stability of the coating to some extent. Similarly, the introduction of the novel surface morphology (nanorods, nanoflowers, nanobelts, etc.20,21) can also change the surface coating to improve the electrodes' electrocatalytic activity. However, the service life of electrodes decorated by these nanostructured surface coating has not been increased obviously. As we know, the factors that affect the stability of the electrode are very complicated and have not been studied thoroughly. But it is generally believed that the poor bonding force between the substrate and surface coating is the main factor causing the deactivation of electrodes.22,23
Therefore, the study of improving the bonding force between the substrate and surface coating has attracted considerable attention. On one hand, some researchers employed different preparation methods for electrode surface coating to improve the bonding force. Chen et al.24 founded that the service life of Ti/SnO2–Sb electrode prepared by electrodeposition is 6.25 times as much as that prepared by thermal decomposition. On the other hand, adding an interlayer is also considered as an effective way to improve the bonding force. Xu et al.25 deposited a Cu nanorods interlayer through the anodic aluminum oxide (AAO) template before making the SnO2–Sb layers. Compared with the Ti/SnO2–Sb electrode, the service lifetime of the Ti/Cu-NRs/SnO2–Sb electrode is increased by 1.63 times. As a novel intermediate layer, the TiO2 nanotube structure can be directly prepared on the Ti plate by anodization.26 Then it can be used as an excellent tubular template for microstructures, in which SnO2–Sb is implanted to obtain stacked microstructures and increase the specific surface area of the electrodes.27 Moreover, the TiO2 nanotube structure does not include other elements except Ti and O, so it has been extensively studied. Li et al.28 introduced the TiO2 nanotube structure into the SnO2 electrode, prolonging the electrode service life from 22 h to 45 h and improving the electrochemical performance of the electrode.
The main purpose of the current research is to enhance the service life of the SnO2–Sb electrode. To achieve it, a novel TiO2-NW was introduced onto the Ti substrate by hydrothermal method, and then the SnO2–Sb surface coating was fabricated via pulsed electrodeposition. The morphologies and element compositions of the electrode were characterized by SEM and EDS. The crystal structure was further obtained by XRD and HRTEM. Then, the electrochemical properties were studied through LSV, EIS, CV and voltammetric charge analysis. Accelerated service life test was performed to evaluate the stability of the electrodes and the deactivation mechanism was further studied by SEM, EDS and EIS. Finally, the electrocatalytic performance was studied through degrading acid red 73.
2. Experimental
2.1. Preparation of TiO2 network
The TiO2 network structure (TiO2-NW) was prepared by a typical hydrothermal process mentioned in ref. 29. Prior to hydrothermal synthesis, the Ti sheets (20 mm × 20 mm × 0.5 mm) were polished using 240-grit sandpaper, and degreased in 5 wt% NaOH at 90 °C for 1 h. Then, the Ti plates were etched in 10 wt% oxalic acid at 99 °C for 2 h, washed with deionized water and dried. For the hydrothermal synthesis, 4 mL of ethanol was poured into 32 mL of 0.5 mol L−1 NaOH solution and stirred for 10 minutes to form a uniform precursor solution. Then a pretreated Ti plate was transferred into a 50 mL Teflon-lined stainless-steel autoclave with the precursor solution. The hydrothermal reaction was performed at 220 °C for 16 h, and cooled to ambient temperature naturally. Then, the Ti plate was rinsed with deionized water, and immersed in 50 mL of 0.1 mol L−1 HCl for 6 h to replace Na+ on the plate with H+. Finally, the Ti plate was washed with distilled water and annealed at 500 °C in oxygen ambient for 2 h (with a heating rate of 4 °C min−1) to obtain the TiO2 network structure.2.2. Preparation of Ti/TiO2-NW/SnO2–Sb electrode
Before depositing, the TiO2 network structure was reduced in 5 wt% Na2SO4 solution by an electrochemical cathodic reduction process (two-electrode system; nickel plate was used as the counter electrode; the current density was 20 mA cm−2; reduction time 20 min) to improve conductivity.30 The SnO2–Sb surface coating was prepared by pulse electrodeposition for 90 min and the details of current density parameter were shown in ref. 20. The electrolyte contained 0.047 M tartaric acid (C4H6O6), 0.25 M sodium pyrophosphate tetrabasic decahydrate (Na4P2O7·10H2O), 0.13 M two hydrated stannous chloride (SnCl2·2H2O), 0.02 M trichloroantimony (SbCl3) and 0.8 g L−1 gelatin.25 Finally, the electrode was annealed at 500 °C for 2 h (with a heating rate of 1 °C min−1).In contrast, the pretreated Ti plate went directly through the same pulse electrodeposition procedures without the hydrothermal process to fabricate a traditional Ti/SnO2–Sb electrode.
2.3. Characterization of electrodes
A field emission scanning electron microscope (S-4800, Japan) equipped with energy-dispersive spectrometer (EDS) was used to examine the surface morphology and element composition of electrodes. X-ray diffraction (XRD) with Cu-Kα ray (λ = 0.15406 nm; 40 kV, 40 mA) was applied to identify the crystal structure of the electrodes in a 2θ range from 20° to 80°. A transmission electron microscopy (JEM-2100F) was used to further determine the crystal structure.Electrochemical measurements were carried out via an electrochemical workstation (PARSTAT 2273, PARC, USA) in a conventional three-electrode cell. The fabricated electrodes were employed as working electrode, while a Pt sheet (40 mm × 40 mm) and an Ag/AgCl/0.1 M KCl served as the counter electrode and reference electrode, respectively. 0.5 M H2SO4 was used as electrolyte. The linear sweep voltammetry (LSV) was carried out between 1.0 V and 2.5 V. The electrochemical impedance spectroscopy (EIS) was performed in the range of 105 to 10−2 Hz. The cyclic voltammetry (CV) was conducted between 0.3 V and 1.5 V. Besides, to investigate the reaction process of the electrode, 100 mg L−1 AR 73 solution was added in the CV test.
An accelerated life test was applied to assess the electrode stability, which was conducted in 0.5 M H2SO4 with a current density of 1 A cm−2 and 250 mA cm−2. The anode potential was measured as a function of time, considering that the electrode was deactivated when this potential increased 5 V from its initial value.31
2.4. Electrocatalytic degradation process
Acid red 73 (AR 73) is selected as simulated wastewater and its details are shown in ref. 25. The electrocatalytic performance of the electrodes was tested by degrading AR 73 during which a three-electrode degradation system was used. The fabricated electrode was used as the anode and two ordinary Ti plates with the same area were used as the cathode. In the electrolysis test, 110 mL of 100 mg L−1 AR 73 solution was poured into the cell with 0.1 M Na2SO4 as the supporting electrolyte. The current density was fixed to 20 mA cm−2 by a DC potentiostat. The AR 73 concentration during the electrocatalytic process was monitored by UV-visible spectrophotometer. The chemical oxygen demand (COD) was measured by COD reactor and spectrophotometer (DR1010 COD, HACH, USA).3. Results and discussion
3.1. Morphology and crystal structure
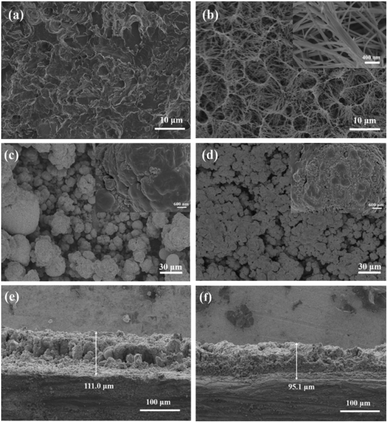
Compared with the Ti substrate (Fig. 1a), it is observed from Fig. 1b that the uniform TiO2-NW has been successfully formed through the hydrothermal process. The TiO2-NW consists of meshes with an average diameter of about 5 μm, filled with filamentous fibers with an average width of less than 100 nm. Fig. 1c and d show the morphology of Ti/SnO2–Sb and Ti/TiO2-NW/SnO2–Sb electrodes, respectively. It is seen that the surface of Ti/SnO2–Sb electrode is distributed with spherical particles of different sizes (the average size is about 15 μm) and some particles are agglomerated. As a comparison, Ti/TiO2-NW/SnO2–Sb electrode has a smaller particle size (the average size is about 6 μm) and the particles distribute more closely. It can be inferred that the large specific surface area of TiO2-NW provides more growth sites than that of Ti substrate, which increases the rate of nucleation speed and decreases the size of nucleation. The insets of Fig. 1c and d show the magnification image of the electrodes. We can see the surface of the particles on the Ti/SnO2–Sb electrode is smoother while the Ti/TiO2-NW/SnO2–Sb electrode is filled with smaller particles, which lead the Ti/TiO2-NW/SnO2–Sb electrode to have a larger specific surface area. The coating thickness of electrodes is further compared in Fig. 1e and f. It can be seen that the coating thickness of Ti/SnO2–Sb electrode (111.0 μm) is larger than that of Ti/TiO2-NW/SnO2–Sb electrode (95.1 μm), which may be due to the dense distribution of Ti/TiO2-NW/SnO2–Sb electrode's particles.EDS was employed to determine the elemental composition of the electrode catalytic coating. According to Table 1, the Sn, Sb and O elements are detected on two kinds of electrodes, indicating that the Sn, Sb elements were successfully deposited on the surface of the electrodes. Meanwhile, Ti element is not detected on both electrodes, which indicates that the SnO2–Sb active coating prepared by pulse electrodeposition provides good coverage of the Ti substrate.
To further investigate the microstructure of the electrodes, XRD measurement was performed to analyze the crystal structure. Fig. 2a presents XRD patterns of TiO2-NW, and TiO2 with anatase phase corresponding to (110) reflection can be found. In Fig. 2b, the diffraction peaks' positions of the two kinds of electrodes agree well with the reflections of rutile SnO2 (PDF#41-1445). No peaks of antimony oxides were found because Sb entered into the SnO2 lattice to form a solid solution.32 The results of HRTEM showed that the fringe interval of 0.26 nm and 0.14 nm was in agreement with the interplanar spacing of (101) and (301) crystal planes of SnO2. The crystal phase of Sb was not found, which further indicated that the solid solution of SnO2–SbOx formed. In addition, the diffraction peak intensity of the Ti/TiO2-NW/SnO2–Sb electrode is obviously higher than that of the Ti/SnO2–Sb electrode, especially the (110), (101), and (211) crystal planes, indicating the TiO2-NW can enhance the crystallinity of the electrodes. The lattice parameters of electrodes were calculated by Bragg's formula.33 By comparison, the lattice parameters of Ti/TiO2-NW/SnO2–Sb electrode (a = b = 0.4727 nm, c = 0.3184 nm) and Ti/SnO2–Sb electrode (a = b = 0.4735 nm, c = 0.3186 nm) are smaller than that of standard lattice parameter of SnO2 (a = b = 0.4738 nm, c = 0.3187 nm). This is because Sb5+ has been doped in the SnO2 unit cell and the radius of Sb5+ (0.74 Å) is smaller than that of Sn4+ (0.83 Å).32 Scherrer formula was used to calculate the average crystal size of the electrodes. The results demonstrate that the crystal size of the Ti/TiO2-NW/SnO2–Sb electrode (58.91 nm) is smaller than that of Ti/SnO2–Sb electrode (87.42 nm), indicating that the Ti/TiO2-NW/SnO2–Sb electrode has a larger specific surface area.
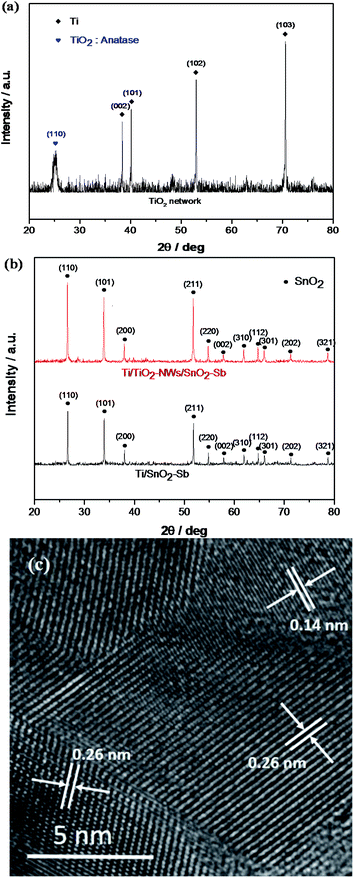 | ||
| Fig. 2 (a) XRD pattern of TiO2 network; (b) XRD patterns of Ti/SnO2–Sb and Ti/TiO2-NW/SnO2–Sb's coatings; (c) HRTEM image of Ti/TiO2-NW/SnO2–Sb electrode. | ||
3.2. Electrochemical test
The oxygen evolution potential (OEP) of electrodes was evaluated by LSV measurement. A high OEP means a low side reaction of oxygen formation and a high current efficiency, which would be beneficial to promote the electro-catalytic oxidation efficiency of organic pollutants.34 As shown in Fig. 3, the OEP of the Ti/TiO2-NW/SnO2–Sb electrode is 2.28 V, which is 0.08 V higher than that of Ti/SnO2–Sb electrode (2.20 V). This situation can be explained by the fact that Ti/TiO2-NW/SnO2–Sb electrode has a denser surface coating and a better crystallinity (as proved in the SEM and XRD analysis), which leads to the reduction of the lattice defects and oxygen vacancy concentration, thus further resulting the OEP to rise.35 Meanwhile, the current response of Ti/TiO2-NW/SnO2–Sb electrode is higher, indicating the charge transfer resistance of the electrode is reduced and more ˙OH could be produced, which will be helpful to degrade organic matter in the dye wastewater.25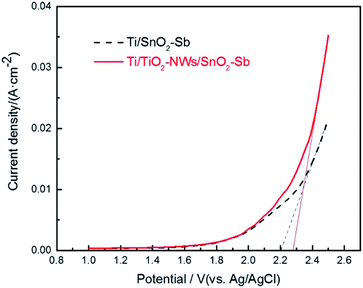 | ||
| Fig. 3 Linear sweep voltammetric curves of Ti/SnO2–Sb and Ti/TiO2-NW/SnO2–Sb electrodes in 0.5 mol L−1 H2SO4 solution. | ||
EIS was used to measure the charge transfer resistance of electrodes. As displayed in Fig. 4, the points represent the experimental value and the curves represent the fitted value obtained by the Zsimpwin software. The equivalent circuit that best matched the experimental data is Rs(RctCPE), where Rs, Rct and CPE are electrolyte resistance, charge transfer resistance and constant phase element, respectively. According to the simulation results (Table 2), Rct of the Ti/TiO2-NW/SnO2–Sb electrode is 25.39 Ω, which is only 28.9% of Ti/SnO2–Sb electrode (87.73 Ω). The reason could be explained as the TiO2-NW provides a channel for the transfer of electrons. Moreover, prior to electrodepositing the surface coating, the TiO2-NW is hydrogenated30 so that the conductivity of the electrode is enhanced.
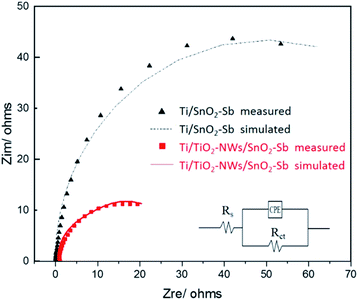 | ||
| Fig. 4 Electrochemical impedance spectroscopies of Ti/SnO2–Sb and Ti/TiO2-NW/SnO2–Sb electrodes in 0.5 mol L−1 H2SO4 solution. | ||
| Electrodes | Rs/ohm | Rct/ohm | CPE/F |
|---|---|---|---|
| Ti/SnO2–Sb | 0.22 | 87.73 | 0.009 |
| Ti/TiO2-NW/SnO2–Sb | 0.99 | 25.39 | 0.027 |
The CV test was applied to evaluate the electrochemical performance of the electrodes. As shown in Fig. 5, no other peaks appear except the one corresponding to the oxygen evolution reaction, indicating that direct electron transfer does not occur between the electrodes and the pollutant during the electrochemical oxidation process.36 In addition, the area surrounded by the CV curves of the electrodes shows that the capacitance of Ti/TiO2-NW/SnO2–Sb electrode is obviously larger than that of the Ti/SnO2–Sb electrode's, which is consistent with the results of EIS test (Table 2). This is because the particles of the catalytic layer on the Ti/TiO2-NW/SnO2–Sb electrode have a smaller size.37
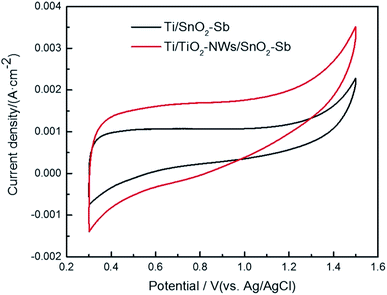 | ||
| Fig. 5 Cyclic voltammograms of Ti/SnO2–Sb and Ti/TiO2-NW/SnO2–Sb electrodes in 100 mg L−1 AR 73 and 0.5 mol L−1 H2SO4 solution at a scan rate of 50 mV s−1. | ||
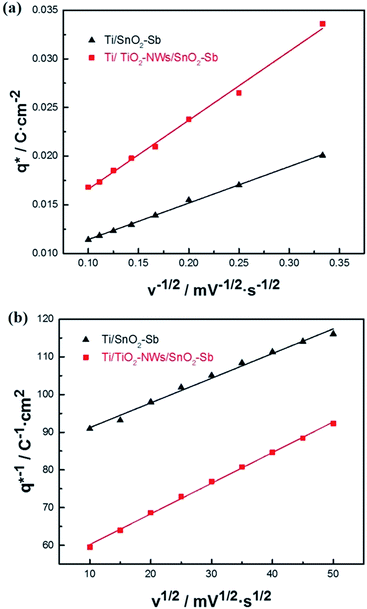
Voltammetric charge (q*) was calculated to further compare the active surface area between the electrodes and it has been studied that q* decreases as the scan rate (v) increases.38,39 It is worth noting that total voltammetric charge  includes inner voltammetric charge
  and outer voltammetric charge charges
  . When the v is close to ∞, the electrolyte has no time to enter the inside of the electrode, so only the
  participates in the reaction. The
  is shown in Fig. 6a as the intercept of the straight lines, which can be calculated by
 | (1) |
 of the electrode participates in the reaction. Similarly, the reciprocal of
  is shown in Fig. 6b as the intercept of the straight lines, which can be obtained according to
 | (2) |
 is determined by
 | (3) |
The electrochemical porosity (r) was defined as the ratio of the inner and the total charge  , which reflects the microstructure of the electrode catalytic layer from another aspect. As displayed in Table 3, it can be found that the
  ,
,  and
and  of the Ti/TiO2-NW/SnO2–Sb electrode are 1.63, 1.23, and 2.37 times of the Ti/SnO2–Sb electrode's respectively due to the introduction of TiO2-NW. Furthermore, as the amount of
  increases significantly, the r increases by 31.3%. These results further confirmed that the active surface area of the Ti/TiO2-NW/SnO2–Sb electrode is larger than that of the Ti/SnO2–Sb electrode.
| Electrodes | qtotal/(C cm−2) | qout/(C cm−2) | qin/(C cm−2) | r |
|---|---|---|---|---|
| Ti/SnO2–Sb | 0.0118 | 0.0077 | 0.0041 | 0.347 |
| Ti/TiO2-NW/SnO2–Sb | 0.0192 | 0.0095 | 0.0097 | 0.505 |
3.3. Electrode stability
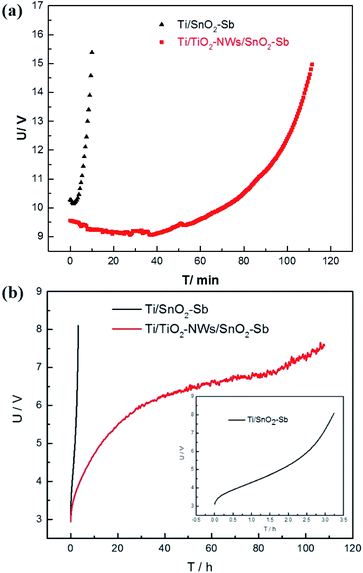
The service life of the electrode is an important factor affecting the actual industrial application. However, it is relatively too long to measure, due to the application at low current density in practice. Hine et al.40 proved that the service life of the electrode decreased sharply with the increase of current density. Therefore, the current density of 1 A cm−2 is selected to test the electrode's accelerated life. As shown in Fig. 7a, the accelerated service life of the Ti/TiO2-NW/SnO2–Sb electrode is 111.5 min, which is 11.15 times longer than that of Ti/SnO2–Sb electrode (10 min). Meanwhile, it was clearly seen that the surface coating of the Ti/SnO2–Sb electrode detached continuously during the test, causing the electrolyte to be turbid, while the electrolyte for detecting the Ti/TiO2-NW/SnO2–Sb electrode was still clarified. In addition, the accelerated life of Ti/TiO2-NW/SnO2–Sb electrode at the current density of 250 mA cm−2 was also measured (Fig. 7b). Table 4 shows the accelerated service life of the titanium-based SnO2–Sb electrodes studied in other literatures. In order to make the comparison results more intuitive, we have converted the current density of the accelerated life test to 100 mA cm−2 according to the formula (4).20
 | (4) |
| Electrodes | Test condition | Accelerated life | Accelerated life when current density converted to 100 mA cm−2 | Ref. |
|---|---|---|---|---|
| Ti/TiO2-NW/SnO2–Sb | 1 A cm−2, 0.5 M H2SO4 | 111.5 min | 185.8 h | This work |
| 250 mA cm−2, 0.5 M H2SO4 | 108 h | 675 h | ||
| Ti/Ce-Mn/SnO2–Sb-La | 1 A cm−2, 1 M H2SO4 | 85.2 min | 142 h | 41 |
| Ti/Cu-NRs/SnO2–Sb | 1 A cm−2, 0.5 M H2SO4 | 12 min | 20 h | 25 |
| Ti/TiO2-NTs/SnO2–Sb | 200 mA cm−2, 1 M H2SO4 | 31 h | 124 h | 42 |
| Ti/TiOxHy/SnO2–Sb | 200 mA cm−2, 0.5 M H2SO4 | 32 h | 128 h | 30 |
| Ti/Pt/SnO2–Sb | 100 mA cm−2, 1 M H2SO4 | 210 h | 210 h | 43 |
| Ti/Sn–Sb/SnO2-F–Sb | 100 mA cm−2, 0.5 M H2SO4 | 103.1 h | 103.1 h | 44 |
| Ti/SnO2–Sb/SnO2–Sb | 200 mA cm−2, 0.5 M H2SO4 | 10.7 h | 42.8 h | 45 |
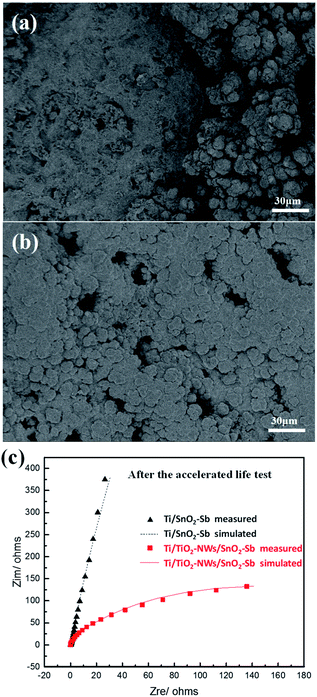
The deactivation mechanism of electrodes after accelerated life test (1 A cm−2) was further analysed by SEM and EDS. As is indicated in Fig. 8a and Table 1, most of the spherical particles on Ti/SnO2–Sb electrode have fallen off compared to Fig. 1c and a large amount of Ti element is detected on the electrode. However, the surface coating of Ti/TiO2-NW/SnO2–Sb electrode (Fig. 8b) is substantially unchanged compared to Fig. 1d and no Ti element is detected. Lim et al.46 have proved that when the element content of Sb is between 5% and 10%, there is little difference in the effect on the electrode stability. Here, the main cause of electrode deactivation is the formation of a non-conductive layer of TiO2, which hinders the transfer of electrons. As shown in Fig. 8c, Rct of the Ti/SnO2–Sb and Ti/TiO2-NW/SnO2–Sb electrode is 22![[thin space (1/6-em)]](https://www.rsc.org/images/entities/char_2009.gif) 340 Ω and 258.4 Ω, respectively. Compared with Fig. 4, it means that the charge transfer resistance of Ti/SnO2–Sb electrode is nearly 250 times higher than that before the accelerated life test. However, the charge transfer resistance of the Ti/TiO2-NW/SnO2–Sb electrode is only increased by 14 times after the accelerated life test, which is still at a lower level. Because of the three-dimensional TiO2-NW, the resulting SnO2–Sb layer is dense and compact, which could insulate the Ti substrate from the corrosive acidic solution. As a result, the chance for forming a new non-conductive layer of TiO2 on the Ti substrate becomes smaller and thus the service lifetime of the electrode is improved. As a comparison, the oxidation of the Ti substrate into TiO2 in the Ti/SnO2–Sb electrode is much easier and faster, because the Ti substrate is exposed in the corrosive acidic solution directly.
340 Ω and 258.4 Ω, respectively. Compared with Fig. 4, it means that the charge transfer resistance of Ti/SnO2–Sb electrode is nearly 250 times higher than that before the accelerated life test. However, the charge transfer resistance of the Ti/TiO2-NW/SnO2–Sb electrode is only increased by 14 times after the accelerated life test, which is still at a lower level. Because of the three-dimensional TiO2-NW, the resulting SnO2–Sb layer is dense and compact, which could insulate the Ti substrate from the corrosive acidic solution. As a result, the chance for forming a new non-conductive layer of TiO2 on the Ti substrate becomes smaller and thus the service lifetime of the electrode is improved. As a comparison, the oxidation of the Ti substrate into TiO2 in the Ti/SnO2–Sb electrode is much easier and faster, because the Ti substrate is exposed in the corrosive acidic solution directly.
3.4. Electrochemical degradation of AR 73
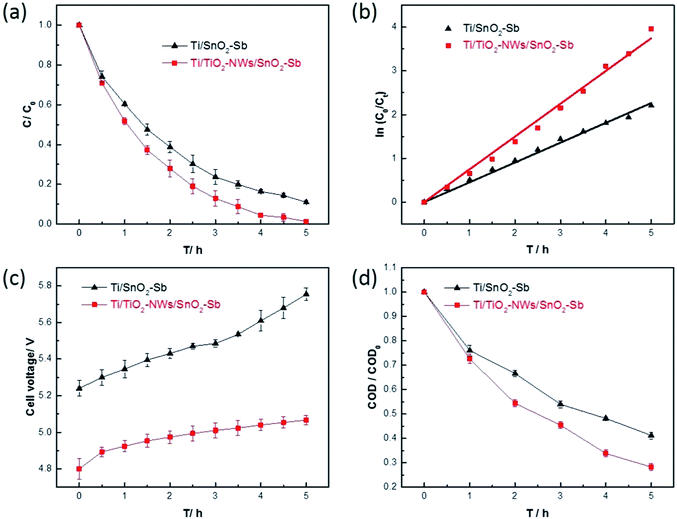
In order to detect the electrocatalytic activity, two kinds of electrodes were used to degrade AR 73. Fig. 9a shows the evolution of AR 73 concentration as a function of time, and it can be found that the degradation of AR 73 by Ti/TiO2-NW/SnO2–Sb electrode can reach 98.6% after 5 h, while Ti/SnO2–Sb electrode is 89.1%. Meanwhile, the electrochemical degradation of AR 73 meets the pseudo first-order kinetics criterion.
 | (5) |
Fig. 9d shows the evolution of COD during the degradation process. The removal rate of Ti/TiO2-NW/SnO2–Sb electrode is 71.8%, which is more than that of the Ti/SnO2–Sb electrode (58.8%). This result further demonstrates that the Ti/TiO2-NW/SnO2–Sb electrode has a better electrocatalytic performance.
3.5. Energy consumption
In the industrial application of electrodes, besides the degradation ability and the service life, the economic rationality of the whole process also needs to be considered. Therefore, it is necessary to calculate the energy consumption of degradation process by
 | (6) |
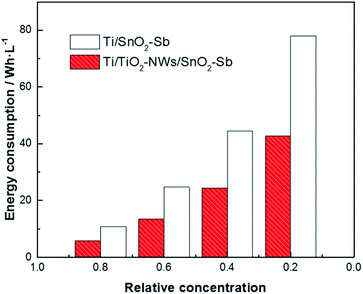 | ||
| Fig. 10 Comparison of the energy consumption between Ti/SnO2–Sb and Ti/TiO2-NW/SnO2–Sb electrodes in degradation process. | ||
4. Conclusions
In this paper, the Ti/TiO2-NW/SnO2–Sb electrode was fabricated by pulse electrodeposition of SnO2–Sb catalyst layer onto Ti substrate with TiO2 network structure to enhance its service life. Compared to the traditional Ti/SnO2–Sb electrode without TiO2-NW, this novel electrode has a high oxygen evolution potential, a low charge transfer resistance and a larger electrochemical active surface area. More importantly, the introduction of the TiO2 network structure prolongs the accelerated service life of the electrode to 111.5 min under 1 A cm−2 current density, which is 11.15 times of that for the Ti/SnO2–Sb electrode. During a 5 hours' test, the AR 73 and COD removals can reach 98.6% and 71.8%, respectively, which are higher than those of Ti/SnO2–Sb electrode (89.1% and 58.8%). The energy consumption of the Ti/TiO2-NW/SnO2–Sb electrode is also lower than that of the Ti/SnO2–Sb electrode. In summary, this study highlights the long service life and excellent electrochemical activity of the Ti/TiO2-NW/SnO2–Sb electrode, and provides a stable and energy-efficient strategy for the degradation of dye wastewater.Conflicts of interest
There are no conflicts to declare.Acknowledgements
Our research was supported by the National Natural Science Foundation of China (Grand No. 11705126 and 21276177).References
- E. Brillas and C. A. Martínez-Huitle, Appl. Catal., B, 2015, 166–167, 603–643 CrossRef CAS.
- R. W. Gullick, M. W. Lechevallier and T. S. Barhorst, J. - Am. Water Works Assoc., 2001, 93, 66–77 CrossRef.
- Y. Xu, R. Lebrun, P. Gallo and P. Blond, Sep. Sci. Technol., 1999, 34, 2501–2519 CrossRef CAS.
- S. S. Wong, T. T. Teng, A. L. Ahmad, A. Zuhairi and G. Najafpour, J. Hazard. Mater., 2006, 135, 378–388 CrossRef CAS.
- S. Vasudevan and M. A. Oturan, Environ. Chem. Lett., 2014, 12, 97–108 CrossRef CAS.
- F. Nabizadeh Chianeh and J. Basiri Parsa, Chem. Eng. Res. Des., 2014, 92, 2740–2748 CrossRef CAS.
- M. Panizza and G. Cerisola, Chem. Rev., 2009, 109, 6541–6569 CrossRef CAS.
- Y. J. Feng and X. Y. Li, Water Res., 2003, 37, 2399–2407 CrossRef CAS.
- X. Chen and G. Chen, Electrochim. Acta, 2005, 50, 4155–4159 CrossRef CAS.
- G. Li, S. Zhou, Z. Shi, X. Meng, L. Li and B. Liu, Environ. Sci. Technol., 2019, 26, 17740–17750 CAS.
- H. Li, X. Zhu, Y. Jiang and J. Ni, Chemosphere, 2010, 80, 845–851 CrossRef CAS.
- J. Wu, H. Xu and W. Yan, RSC Adv., 2015, 5, 19284–19293 RSC.
- B. Wang, W. Kong and H. Ma, J. Hazard. Mater., 2007, 146, 295–301 CrossRef CAS.
- S. Y. Yang, D. Kim and H. Park, Environ. Sci. Technol., 2014, 48, 2877–2884 CrossRef CAS.
- Y. Feng, Y. Cui, B. Logan and Z. Liu, Chemosphere, 2008, 70, 1629–1636 CrossRef CAS.
- T. Duan, Y. Chen, Q. Wen and Y. Duan, RSC Adv., 2015, 5, 19601–19612 RSC.
- L. Xu, Y. Wang, Q. Xu and H. Duan, J. Electrochem. Soc., 2019, 166, E69–E76 CrossRef CAS.
- Q. Zhuo, S. Deng, B. Yang, J. Huang and G. Yu, Environ. Sci. Technol., 2011, 45, 2973–2979 CrossRef CAS.
- X. Lei, L. Li, Y. Chen and Y. Hu, Environ. Sci. Pollut. Res., 2018, 25, 11683–11693 CrossRef CAS.
- L. Xu and Y. Lian, J. Electrochem. Soc., 2016, 163, H1144–H1150 CrossRef CAS.
- L. Wang, Y. Wang, S. Wang, H. Zhang, Y. Kang and W. Huang, Sens. Actuators, B, 2013, 188, 85–93 CrossRef CAS.
- L. K. Xu and J. D. Scantlebury, Corros. Sci., 2003, 45, 2729–2740 CrossRef CAS.
- F. Vicent, E. Morallo N, C. Quijada, J. L. Va Zquez, A. Aldaz and F. Cases, J. Appl. Electrochem., 1998, 28, 607–612 CrossRef CAS.
- Y. Chen, L. Hong, H. Xue, W. Han, L. Wang, X. Sun and J. Li, J. Electroanal. Chem., 2010, 648, 119–127 CrossRef CAS.
- W. Xu, L. Xu and M. Li, Electrochim. Acta, 2015, 166, 64–72 CrossRef.
- A. Xu, X. Dai, K. Wei, W. Han, J. Li, X. Sun, J. Shen and L. Wang, RSC Adv., 2017, 7, 37806–37814 RSC.
- T. Duan, L. Ma, Y. Chen, X. Ma, J. Hou, C. Lin and M. Sun, J. Solid State Electrochem., 2018, 22, 1871–1879 CrossRef CAS.
- P. Li, G. Zhao, X. Cui, Y. Zhang and Y. Tang, J. Phys. Chem. C, 2009, 113, 2375–2383 CrossRef CAS.
- X. Li, Z. Zhu, G. P. Nayaka, J. Duan, D. Wang, P. Dong, L. Huang, J. Zhao, S. Sun, X. Yu and Y. Zhang, J. Alloys Compd., 2018, 752, 68–75 CrossRef CAS.
- X. Li, D. Shao, H. Xu, W. Lv and W. Yan, Chem. Eng. J., 2016, 285, 1–10 CrossRef CAS.
- F. Montilla, E. Morallón, A. De Battisti and J. L. Vázquez, J. Phys. Chem. B, 2004, 108, 5036–5043 CrossRef CAS.
- X. Cui, G. Zhao, Y. Lei, H. Li, P. Li and M. Liu, Mater. Chem. Phys., 2009, 113, 314–321 CrossRef CAS.
- F. Montilla, E. Morallón, A. De Battisti, A. Benedetti, H. Yamashita and J. L. Vázquez, J. Phys. Chem. B, 2004, 108, 5044–5050 CrossRef CAS.
- F. Oliveira, M. Osugi, F. Paschoal, D. Profeti, P. Olivi and M. Zanoni, J. Appl. Electrochem., 2007, 37, 583–592 CrossRef CAS.
- G. Zhao, X. Cui, M. Liu, P. Li, Y. Zhang, T. Cao, H. Li, Y. Lei, L. Liu and D. Li, Environ. Sci. Technol., 2009, 43, 1480–1486 CrossRef CAS.
- O. Simond, V. Schaller and C. Comninellis, Electrochim. Acta, 1997, 42, 2009–2012 CrossRef CAS.
- L. Bao, J. Zang and X. Li, Nano Lett., 2011, 11, 1215–1220 CrossRef CAS.
- R. Berenguer, C. Quijada and E. Morallón, Electrochim. Acta, 2009, 54, 5230–5238 CrossRef CAS.
- Y. Chang, L. Deng, X. Meng, W. Zhang, C. Wang, Y. Wang, S. Zhao, L. Lin and J. C. Crittenden, Environ. Sci. Technol., 2018, 52, 5940–5948 CrossRef CAS.
- F. Hine, M. Yasuda, T. Noda, T. Yoshida and J. Okuda, J. Electrochem. Soc., 1979, 126, 1439–1445 CrossRef CAS.
- Q. Bi, W. Guan, Y. Gao, Y. Cui, S. Ma and J. Xue, Electrochim. Acta, 2019, 306, 667–679 CrossRef CAS.
- R. A. Subba and V. T. Venkatarangaiah, Environ. Sci. Pollut. Res., 2018, 25, 11480–11492 CrossRef.
- C. Shao, J. Yu, X. Li, X. Wang and K. Zhu, J. Electroanal. Chem., 2017, 804, 140–147 CrossRef CAS.
- B. Yang, J. Wang, C. Jiang, J. Li, G. Yu, S. Deng, S. Lu, P. Zhang, C. Zhu and Q. Zhuo, Chem. Eng. J., 2017, 316, 296–304 CrossRef CAS.
- D. Shao, X. Li, H. Xu and W. Yan, RSC Adv., 2014, 4, 21230–21237 RSC.
- D. Lim, Y. Kim, D. Nam, S. Hwang, S. E. Shim and S. Baeck, J. Cleaner Prod., 2018, 197, 1268–1274 CrossRef CAS.
- Q. Wang, T. Jin, Z. Hu, M. Zhou and L. Zhou, Sep. Purif. Technol., 2013, 102, 180–186 CrossRef CAS.
- Y. Cui and Y. Feng, J. Mater. Sci., 2005, 40, 4695–4697 CrossRef CAS.
| This journal is © The Royal Society of Chemistry 2019 |

