 Open Access Article
Understanding segregation processes in SAMs formed by mixtures of hydroxylated and non-hydroxylated fatty acids†
Otto V. M. Bueno a,
J. J. Benítez
 b and
Miguel A. San-Miguel
 *a
*a
aDepartment of Physical Chemistry, Institute of Chemistry, University of Campinas – UNICAMP, P. O. Box 6154, 13083-970 Campinas, SP, Brazil. E-mail: smiguel@unicamp.br
bInstituto de Ciencias de Materiales de Sevilla, Centro Mixto CSIC-Universidad de Sevilla, Avda, Americo Vespuccio, 49 (41092)-Sevilla, Spain
First published on 29th November 2019
Abstract
In this paper, we focus on the segregation processes emerging when preparing mixtures with different compositions of aleuritic (9,10,16 trihydroxyhexadecanoic) (ALE) and palmitic (hexadecanoic) (PAL) acids. The combination of atomic force microscopy (AFM) and molecular dynamics (MD) simulations enabled us to prove the role of the functional groups in the formation of self-assembled monolayers (SAMs) on muscovite mica surfaces. MD simulations indicate that segregation processes are favored in high ALE composition mixtures in agreement with the experimental evidence, whereas low ALE compositions promote the co-existence between segregated and dispersed systems. The secondary hydroxyl groups play a central role in the self-assembling mechanism because they control the formation of hydrogen bonding networks guarantying system stability.
1 Introduction
Self-assembled layers (SA) and particularly self-assembled monolayers (SAMs) of functionalized alkyl molecules are highly ordered 2D arrangements that have been intensively studied in the past decades.1 Advances in their characterization and manipulation have allowed the construction and engineering of well-defined molecular architectures with tailored physical and chemical properties. SAMs have been used, for instance, to design lubricants,2,3 anti-corrosion and metal passivation additives4–6 and molecular recognition systems;7,8 and also in nanolithography and in the creation of complex hierarchical mechanical and optoelectronic nano and micro devices.9–13Most of the SAMs are constituted by a metal or semiconductor as support and a molecule bearing a functional group with a high chemical affinity for the substrate. The strong chemical bonding is the driving force for the molecules to pack in a competitive mechanism and therefore, conditions the structure of the monolayer. This way, robust and highly ordered monolayers are obtained but the contribution of the intermolecular interactions plays a minor role.
When support-to-molecule and molecule-to-molecule interactions are comparable, intermolecular energy becomes a relevant factor in the process of packing within the confined space of a self-assembled monolayer.14 For this reason, SAMs of amphiphilic functionalized alkyl molecules on chemical inert flat substrates have been proposed as models to study the role of secondary functional groups in the molecule-to-molecule associations. To address this issue, atomic force microscopy (AFM) has been used and topographic and frictional data have been interpreted in terms of molecular in-plane (lateral) and end-group interactions.15
Structural molecular resolution in standard AFM imaging is obtained from the lateral force signal when operating in contact mode. In weakly adsorbed SAMs, the dragging force exerted by the scanning probe may overcome the magnitude of the adhesion and cohesion of molecules and the structure of the SAMs may result distorted if not destroyed while being imaged. Furthermore, in the absence of a strong bonding with the support univocally defining the energy state of the SAM, other secondary interactions like hydrogen bonding, electrostatic and van de Waals forces can originate the coexistence of a series of arrangements close in energy and cause packing defects due to structural mismatch between domains. For instance, fatty alkylamine SAMs on mica have been found to contain a significant amount of void defects though looking uniform to AFM.16 In these situations, the support from molecular dynamics calculations is a very valuable tool to characterize the structure of such “soft” SAMs17,18 or organizational processes in biomineralization.19,20
In previous studies, our group has been able to resolve the structure of a series of hydroxy fatty acids SAMs on mica showing topographic, friction and adhesion contrast in AFM using molecular dynamics simulations.21–23 It was found that the number and position of hydroxyls groups conditions the final molecular arrangement.21 In this paper we have addressed the analysis of segregation processes in SAMs formed by a mixture of hydroxylated and non-hydroxylated fatty acids using the already tested methodology combining AFM analysis and molecular dynamics simulations.
2 Experimental
2.1 Sample preparation
Aleuritic (9,10,16 trihydroxyhexadecanoic, TCI, >98.0%) and palmitic (hexadecanoic, Fluka, 99%) acids were used to prepare solutions in chloroform (Merck, 99.8%). Solutions ranging from 0.1 to 1 mM were prepared to obtain the coverage-concentration patterns (isotherms) for pure aleuritic and palmitic acids. ALE![[thin space (1/6-em)]](https://www.rsc.org/images/entities/char_2009.gif) :
:![[thin space (1/6-em)]](https://www.rsc.org/images/entities/char_2009.gif) PAL mixtures were 1 mM with ALE
PAL mixtures were 1 mM with ALE![[thin space (1/6-em)]](https://www.rsc.org/images/entities/char_2009.gif) :
:![[thin space (1/6-em)]](https://www.rsc.org/images/entities/char_2009.gif) PAL ration varying from 0
PAL ration varying from 0![[thin space (1/6-em)]](https://www.rsc.org/images/entities/char_2009.gif) :
:![[thin space (1/6-em)]](https://www.rsc.org/images/entities/char_2009.gif) 10 to 10
10 to 10![[thin space (1/6-em)]](https://www.rsc.org/images/entities/char_2009.gif) :
:![[thin space (1/6-em)]](https://www.rsc.org/images/entities/char_2009.gif) 0 in 1
0 in 1![[thin space (1/6-em)]](https://www.rsc.org/images/entities/char_2009.gif) :
:![[thin space (1/6-em)]](https://www.rsc.org/images/entities/char_2009.gif) 1 steps.
1 steps.
Mica (muscovite) substrates were cut in ∼1 × 1 cm2 pieces and doubly cleaved using an adhesive tape. A 20 μl drop of prepared solutions was immediately placed on top of the cleaved surface and spun at 40 rps for 20 seconds using a spin coater (LOT, Germany). Samples were stabilized for 3–4 hours inside a covered glass crystallizing dish before being transferred to the AFM microscope. For reproducibility, each preparation was repeated at least three times.
2.2 AFM measurements
AFM images were obtained with a Nanotec Cervantes microscope (Nanotec, Spain) using silicon cantilevers (PPP-FMR Nanosensors, Switzerland) with a nominal 75 kHz resonance frequency and 2.8 N m−1 force constant. A long-range 70 × 70 m μm2 scanner was used to check for reproducible sample preparation and to obtain representative surface coverage values. Another 10 × 10 μm2 scanner was employed to collect accurate topographic and phase distribution data. The lever was oscillated (A0 ∼ 900 Å peak to peak) at its free resonance frequency. The amplitude was used as feedback signal with a setpoint (Asp) at Asp/A0 = 0.8. Both topographic and phase-shift images were recorded. Every sample was studied at four distant points using both scanners and images were acquired, processed and analyzed using the WSxM software.24 Scanners were calibrated using NT-MDT TGT01 and Nanosensors H8 gratings for (X–Y) and Z directions, respectively.2.3 Computational details
Molecular dynamics (MD) simulations were carried out using the classic DL_POLY code25 in the canonical ensemble NVT. The temperature was kept constant at 300 K by applying a Nosé–Hoover thermostat.26 The equations of motion were integrated by using the velocity-Verlet algorithm with a time step of 1.0 fs. The –CH3 and –CH2– groups were treated as pseudo atomic units using the CHARMM force field.27 15 Å spherical cutoffs were used to treat the Lennard-Jones (LJ) and Coulomb interactions. Periodic boundary conditions were applied along the x and y directions. The Ewald method with periodic boundary conditions in two dimensions, as implemented in the DL_POLY code, was used to treat the electrostatic interactions.28 Two computational boxes were considered to simulate all systems (systems with hexagonal and rectangular patterns) with length parameters of (a) Lx = 60.0 Å, Ly = 34.6 Å and (b) Lx = 60.0 Å, Ly = 40.0 Å, respectively and Lz = 200 Å to avoid artificial interactions between neighbor boxes along the Z direction. The substrate was represented as a flat surface, and the interaction between each particle and the surface was computed according towhere Cn α (σεn)1/2, z is the distance to the surface, and zo is a limit approach distance for each center.29 The σ and ε Lennard-Jones potential parameters were calculated using the Lorentz–Berthelot combining rules. Cn parameters for –CH2–, –CH3, C and O were taken from the literature.29–31
A total of 16 systems were defined to model ALE–PAL mixtures of compositions 25![[thin space (1/6-em)]](https://www.rsc.org/images/entities/char_2009.gif) :
:![[thin space (1/6-em)]](https://www.rsc.org/images/entities/char_2009.gif) 75 (25% aleuritic acid and 75% palmitic acid) and 75
75 (25% aleuritic acid and 75% palmitic acid) and 75![[thin space (1/6-em)]](https://www.rsc.org/images/entities/char_2009.gif) :
:![[thin space (1/6-em)]](https://www.rsc.org/images/entities/char_2009.gif) 25 (75% aleuritic acid and 25% palmitic acid). Based on experimental results, these systems were chosen as representative cases for ideal dispersed and segregated SAMs. Thus, initial configurations were constructed by placing a total of 96 molecules of ALE and PAL vertically on a mica surface, with the carboxylic group near the surface.
25 (75% aleuritic acid and 25% palmitic acid). Based on experimental results, these systems were chosen as representative cases for ideal dispersed and segregated SAMs. Thus, initial configurations were constructed by placing a total of 96 molecules of ALE and PAL vertically on a mica surface, with the carboxylic group near the surface.
For each of these two compositions, two network categories (hexagonal, H, and rectangular, R) with dispersed (D) and segregated (S) configurations, were defined. For example, for a composition 75![[thin space (1/6-em)]](https://www.rsc.org/images/entities/char_2009.gif) :
:![[thin space (1/6-em)]](https://www.rsc.org/images/entities/char_2009.gif) 25 in a hexagonal arrangement, two dispersed configurations, named as H75D1 and H75D2, and two segregated configurations, referred as H75S1 and H75S2, were established. Similarly, for a composition 25
25 in a hexagonal arrangement, two dispersed configurations, named as H75D1 and H75D2, and two segregated configurations, referred as H75S1 and H75S2, were established. Similarly, for a composition 25![[thin space (1/6-em)]](https://www.rsc.org/images/entities/char_2009.gif) :
:![[thin space (1/6-em)]](https://www.rsc.org/images/entities/char_2009.gif) 75, there are two dispersed (H25D1 and H25D2) and two segregated (H25S1 and H25S2) systems. The nomenclature and details for each type of system are compiled in Table 1, and top views of each system are depicted for the H and R networks in Fig. 1 and in the ESI (Fig. S1†), respectively.
75, there are two dispersed (H25D1 and H25D2) and two segregated (H25S1 and H25S2) systems. The nomenclature and details for each type of system are compiled in Table 1, and top views of each system are depicted for the H and R networks in Fig. 1 and in the ESI (Fig. S1†), respectively.
| ALE composition (%) | System type | System name | Characteristics | |
|---|---|---|---|---|
| 75 | Dispersed | H75D1 | H75D2 | Hexagonal network. (1) and (2) for different ALE and PAL locations. |
| R75D1 | R75D2 | Square network. (1) and (2) for different ALE and PAL locations. | ||
| Segregated | H75S1 | H75S2 | Hexagonal network. (1) For column type and (2) for island type segregations. | |
| R75S1 | R75S2 | Square network. (1) For column type and (2) for island type segregations. | ||
| 25 | Dispersed | H25D1 | H25D2 | Hexagonal network. (1) and (2) for different ALE and PAL locations. |
| R25D1 | R25D2 | Square network. (1) and (2) for different ALE and PAL locations. | ||
| Segregated | H25S1 | H25S2 | Hexagonal network. (1) For column type and (2) for island type segregations. | |
| R25S1 | R25S2 | Square network. (1) For column type and (2) for island type segregations. | ||
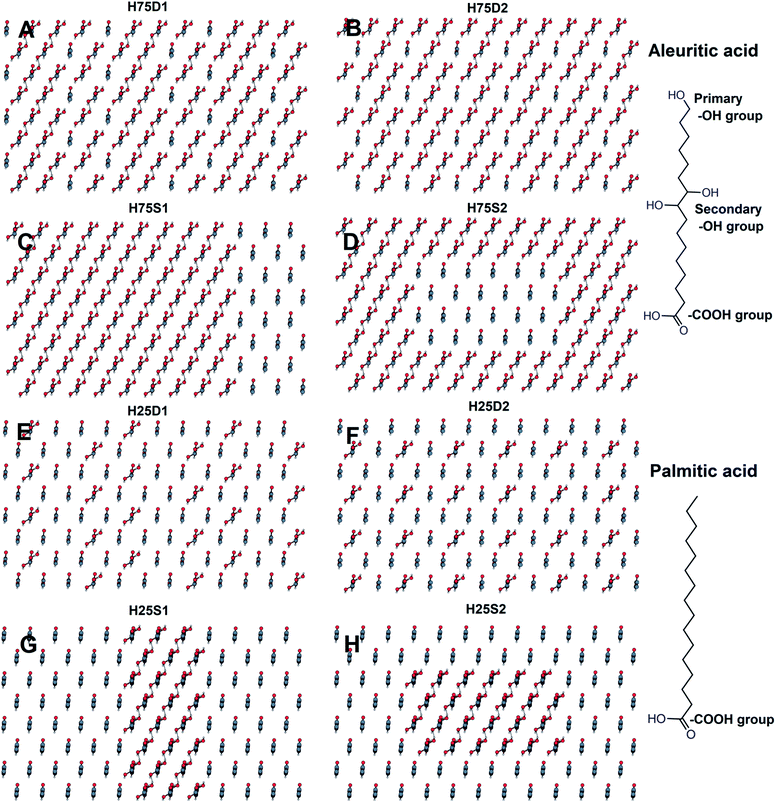 | ||
Fig. 1 Top views of the initial layouts for a hexagonal network of 75![[thin space (1/6-em)]](https://www.rsc.org/images/entities/char_2009.gif) : :![[thin space (1/6-em)]](https://www.rsc.org/images/entities/char_2009.gif) 25 (A–D) and 25 25 (A–D) and 25![[thin space (1/6-em)]](https://www.rsc.org/images/entities/char_2009.gif) : :![[thin space (1/6-em)]](https://www.rsc.org/images/entities/char_2009.gif) 75 (E–H) ALE 75 (E–H) ALE![[thin space (1/6-em)]](https://www.rsc.org/images/entities/char_2009.gif) : :![[thin space (1/6-em)]](https://www.rsc.org/images/entities/char_2009.gif) PAL mixed systems. Segregated systems are set up in column (C and G) and island (D and H). PAL mixed systems. Segregated systems are set up in column (C and G) and island (D and H). | ||
The initial configurations, created with high structural tension, were submitted to a relaxation process using the ‘zero’ technique implemented in the DL_POLY code for 1 ns. Next, the equilibration process was carried out gradually at 100, 200 and 300 K, during 1 ns for each temperature and verifying that equilibrium was reached at each stage. Finally, all systems were simulated for 10 ns, and in specific cases, simulations were extended up to 20 ns. The configurations were saved every 1000 steps (1 ps), and the statistical data analysis was done in the last 0.5 ns (9.5–10.0 ns).
3 Results and discussion
3.1 AFM characterization of ALE![[thin space (1/6-em)]](https://www.rsc.org/images/entities/h3_char_2009.gif) :
:![[thin space (1/6-em)]](https://www.rsc.org/images/entities/h3_char_2009.gif) PAL SAMs on mica
PAL SAMs on mica
Before the AFM analysis of mixed ALE![[thin space (1/6-em)]](https://www.rsc.org/images/entities/char_2009.gif) :
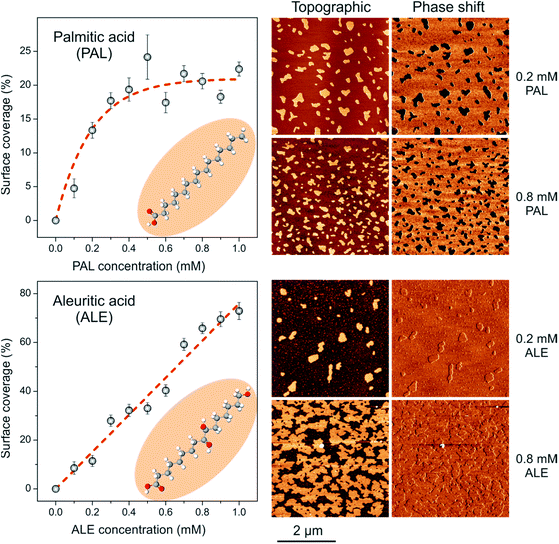
:![[thin space (1/6-em)]](https://www.rsc.org/images/entities/char_2009.gif) PAL systems, the self-assembly process of pure ALE and PAL on mica was studied. PAL forms discrete flat islands (10.0–12.0 Å high) in which the alkyl molecules are packed in a tilted configuration with the –COOH end group interacting with the mica surface (SAM) and exposing the –CH3 group.15,32,33 Surface coverage progressively grows as the PAL concentration in the solution is raised until saturation around 20% coverage (Fig. 2, top). The existence of an adsorption limit can be interpreted in terms of an acid–base reaction in which the proton of the carboxylic group is transferred to neutralize the negatively charged mica surface. Indeed, considering the specific surface area of PAL molecules (22.0 Å2) from force–area (π–A) isotherms34 and the charge density of mica basal plane (−0.33 C m−2),35 a theoretical saturation coverage of about 45% can be calculated. The lower experimental values can be due to many factors such as the adsorption of residual cations and to the participation of the water add layer on the mica surface. However, what is relevant to this study is that the formation of PAL SAMs under the methodology used is a balance between molecule to molecule and molecule to substrate interactions with no precipitation effects due to solvent evaporation. It is also important to remark that PAL SAMs are characterized as low phase shift moieties, which, under the AFM imaging conditions used, is due to the lower stiffness of the PAL SAMs with respect to mica.36–38
PAL systems, the self-assembly process of pure ALE and PAL on mica was studied. PAL forms discrete flat islands (10.0–12.0 Å high) in which the alkyl molecules are packed in a tilted configuration with the –COOH end group interacting with the mica surface (SAM) and exposing the –CH3 group.15,32,33 Surface coverage progressively grows as the PAL concentration in the solution is raised until saturation around 20% coverage (Fig. 2, top). The existence of an adsorption limit can be interpreted in terms of an acid–base reaction in which the proton of the carboxylic group is transferred to neutralize the negatively charged mica surface. Indeed, considering the specific surface area of PAL molecules (22.0 Å2) from force–area (π–A) isotherms34 and the charge density of mica basal plane (−0.33 C m−2),35 a theoretical saturation coverage of about 45% can be calculated. The lower experimental values can be due to many factors such as the adsorption of residual cations and to the participation of the water add layer on the mica surface. However, what is relevant to this study is that the formation of PAL SAMs under the methodology used is a balance between molecule to molecule and molecule to substrate interactions with no precipitation effects due to solvent evaporation. It is also important to remark that PAL SAMs are characterized as low phase shift moieties, which, under the AFM imaging conditions used, is due to the lower stiffness of the PAL SAMs with respect to mica.36–38
On the other side, the pattern for ALE SAMs is quite different (Fig. 2, bottom). Island height is 24.0–26.0 Å indicating a quite vertical arrangement of ALE molecules.21 Furthermore, the surface coverage linearly grows with the concentration of the ALE solution used to almost complete a monolayer. In this case, no saturation limit is observed because the structure of ALE SAMs is not only conditioned by the molecule-support interaction as PAL, but also by strong lateral molecule–molecule association between secondary hydroxyls.39 Phase shift images reveal no contrast between ALE SAMs and bare mica, which indicates a similar stiffness for the two phases. Compared to PAL, the lateral cohesion between ALE molecules significantly reinforces the self-assembled structure and imposes the vertical arrangement. Thus, individual PAL and ALE SAMs can be differentiated by both topographic and phase AFM imaging.
When SAMs are prepared from ALE![[thin space (1/6-em)]](https://www.rsc.org/images/entities/char_2009.gif) :
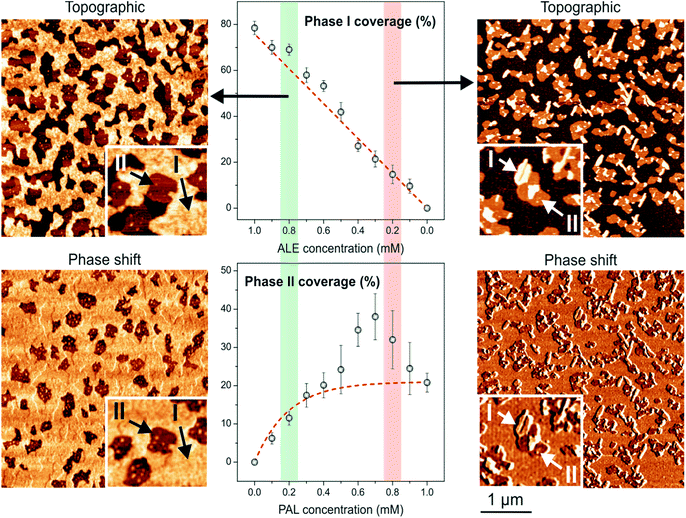
:![[thin space (1/6-em)]](https://www.rsc.org/images/entities/char_2009.gif) PAL mixtures, two phases (I and II), as well as the mica background, can be distinguished (Fig. 3). Phase I is characterized as high height and high phase-shift domains and phase II as low height and low phase-shift ones. According to the previous paragraph, phases I and II can be associated with ALE and PAL SAMs, respectively. Indeed, the phase I coverage vs. ALE concentration in the ALE
PAL mixtures, two phases (I and II), as well as the mica background, can be distinguished (Fig. 3). Phase I is characterized as high height and high phase-shift domains and phase II as low height and low phase-shift ones. According to the previous paragraph, phases I and II can be associated with ALE and PAL SAMs, respectively. Indeed, the phase I coverage vs. ALE concentration in the ALE![[thin space (1/6-em)]](https://www.rsc.org/images/entities/char_2009.gif) :
:![[thin space (1/6-em)]](https://www.rsc.org/images/entities/char_2009.gif) PAL mixtures (symbols in Fig. 3, top) matches the adsorption isotherm (dashed line) obtained from pure ALE solutions (Fig. 2, bottom). Thus, the most plausible hypothesis is that ALE molecules pack into SAMs (phase I) independently of the presence of PAL units. When the analogous analysis is carried out for phase II (Fig. 3, bottom) it is observed that at low PAL concentration the coverage fits the one expected for pure PAL (dashed line). However, at higher PAL content, the development of phase II is favored with respect to the one predicted. Such deviation in maximum at the 3
PAL mixtures (symbols in Fig. 3, top) matches the adsorption isotherm (dashed line) obtained from pure ALE solutions (Fig. 2, bottom). Thus, the most plausible hypothesis is that ALE molecules pack into SAMs (phase I) independently of the presence of PAL units. When the analogous analysis is carried out for phase II (Fig. 3, bottom) it is observed that at low PAL concentration the coverage fits the one expected for pure PAL (dashed line). However, at higher PAL content, the development of phase II is favored with respect to the one predicted. Such deviation in maximum at the 3![[thin space (1/6-em)]](https://www.rsc.org/images/entities/char_2009.gif) :
:![[thin space (1/6-em)]](https://www.rsc.org/images/entities/char_2009.gif) 7 ALE
7 ALE![[thin space (1/6-em)]](https://www.rsc.org/images/entities/char_2009.gif) :
:![[thin space (1/6-em)]](https://www.rsc.org/images/entities/char_2009.gif) PAL ratio. According to these results and to gain insight into the nature of phases I and II, molecular dynamics simulations were carried out in singular mixtures: 75
PAL ratio. According to these results and to gain insight into the nature of phases I and II, molecular dynamics simulations were carried out in singular mixtures: 75![[thin space (1/6-em)]](https://www.rsc.org/images/entities/char_2009.gif) :
:![[thin space (1/6-em)]](https://www.rsc.org/images/entities/char_2009.gif) 25 and 25
25 and 25![[thin space (1/6-em)]](https://www.rsc.org/images/entities/char_2009.gif) :
:![[thin space (1/6-em)]](https://www.rsc.org/images/entities/char_2009.gif) 75 (ALE
75 (ALE![[thin space (1/6-em)]](https://www.rsc.org/images/entities/char_2009.gif) :
:![[thin space (1/6-em)]](https://www.rsc.org/images/entities/char_2009.gif) PAL) considered as ideal and non-ideal systems, respectively. The ideal and non-ideal concept arises from whether or not the surface coverage in ALE
PAL) considered as ideal and non-ideal systems, respectively. The ideal and non-ideal concept arises from whether or not the surface coverage in ALE![[thin space (1/6-em)]](https://www.rsc.org/images/entities/char_2009.gif) :
:![[thin space (1/6-em)]](https://www.rsc.org/images/entities/char_2009.gif) PAL mixtures can be described as the sum of the individual components (ALE and PAL).
PAL mixtures can be described as the sum of the individual components (ALE and PAL).
3.2 Energy stability of dispersed and segregated systems
In this section, we discuss the stability of the systems from the analysis of the configurational energy. The results for systems with 75![[thin space (1/6-em)]](https://www.rsc.org/images/entities/char_2009.gif) :
:![[thin space (1/6-em)]](https://www.rsc.org/images/entities/char_2009.gif) 25 and 25
25 and 25![[thin space (1/6-em)]](https://www.rsc.org/images/entities/char_2009.gif) :
:![[thin space (1/6-em)]](https://www.rsc.org/images/entities/char_2009.gif) 75 (ALE
75 (ALE![[thin space (1/6-em)]](https://www.rsc.org/images/entities/char_2009.gif) :
:![[thin space (1/6-em)]](https://www.rsc.org/images/entities/char_2009.gif) PAL) compositions are shown in Fig. 4A and B, respectively. For 75
PAL) compositions are shown in Fig. 4A and B, respectively. For 75![[thin space (1/6-em)]](https://www.rsc.org/images/entities/char_2009.gif) :
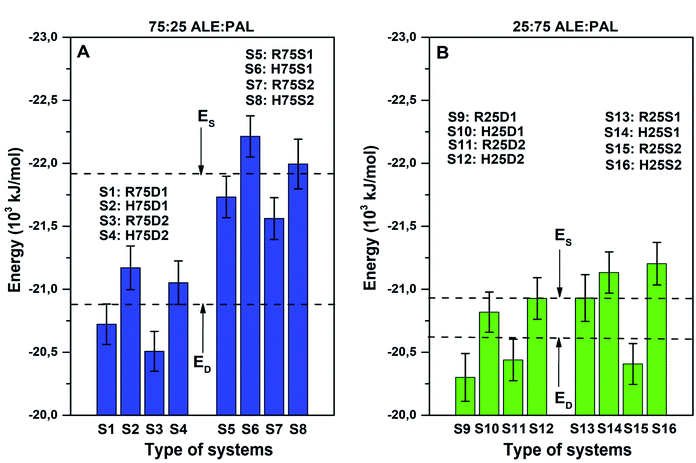
:![[thin space (1/6-em)]](https://www.rsc.org/images/entities/char_2009.gif) 25, all segregated systems (R75S1, R75S2, H75S1, and H75S2) are more stable than the dispersed ones (R75D1, R75D2, H75D1, and H75D2) when comparing the mean configurational energy values: −21.99 and −20.98 MJ mol−1 for segregated and dispersed systems, respectively. Therefore, it would be expected that, for systems with high ALE composition, segregation processes might be favored. In addition, when analyzing each system separately, it is observed that all segregated systems are more stable than any dispersed system, which shows that there is a marked favor in the formation of segregated systems. However, there are dispersed and segregated systems with small differences in configurational energy (H75D1 and R75S2, for example), which suggests a possible coexistence of both systems.
25, all segregated systems (R75S1, R75S2, H75S1, and H75S2) are more stable than the dispersed ones (R75D1, R75D2, H75D1, and H75D2) when comparing the mean configurational energy values: −21.99 and −20.98 MJ mol−1 for segregated and dispersed systems, respectively. Therefore, it would be expected that, for systems with high ALE composition, segregation processes might be favored. In addition, when analyzing each system separately, it is observed that all segregated systems are more stable than any dispersed system, which shows that there is a marked favor in the formation of segregated systems. However, there are dispersed and segregated systems with small differences in configurational energy (H75D1 and R75S2, for example), which suggests a possible coexistence of both systems.
For 25![[thin space (1/6-em)]](https://www.rsc.org/images/entities/char_2009.gif) :
:![[thin space (1/6-em)]](https://www.rsc.org/images/entities/char_2009.gif) 75 (ALE
75 (ALE![[thin space (1/6-em)]](https://www.rsc.org/images/entities/char_2009.gif) :
:![[thin space (1/6-em)]](https://www.rsc.org/images/entities/char_2009.gif) PAL) composition, the mean configurational energy difference between the segregated and dispersed systems decreases to −0.45 MJ mol−1 (see Fig. 4B), making the appearance of dispersed systems feasible. In fact, on analyzing each case, it is observed that, unlike the previous case, there are dispersed systems more stable than segregated ones, such as H25D2 and R25S2.
PAL) composition, the mean configurational energy difference between the segregated and dispersed systems decreases to −0.45 MJ mol−1 (see Fig. 4B), making the appearance of dispersed systems feasible. In fact, on analyzing each case, it is observed that, unlike the previous case, there are dispersed systems more stable than segregated ones, such as H25D2 and R25S2.
Therefore, based on the configurational energy, we can conclude that systems with a higher amount of ALE (75![[thin space (1/6-em)]](https://www.rsc.org/images/entities/char_2009.gif) :
:![[thin space (1/6-em)]](https://www.rsc.org/images/entities/char_2009.gif) 25) favor the formation of segregated phases (ideal behavior), while systems with low ALE composition (25
25) favor the formation of segregated phases (ideal behavior), while systems with low ALE composition (25![[thin space (1/6-em)]](https://www.rsc.org/images/entities/char_2009.gif) :
:![[thin space (1/6-em)]](https://www.rsc.org/images/entities/char_2009.gif) 75) lead to the coexistence of segregated and dispersed phases (non-ideal behavior). Accordingly, phase I can be ascribed to ALE SAMs in both ALE and PAL rich preparations while phase II corresponds to PAL SAMs in low PAL mixtures and to a dispersed ALE-PAL system at high PAL content. In the next sections, a detailed structural description of these systems is provided.
75) lead to the coexistence of segregated and dispersed phases (non-ideal behavior). Accordingly, phase I can be ascribed to ALE SAMs in both ALE and PAL rich preparations while phase II corresponds to PAL SAMs in low PAL mixtures and to a dispersed ALE-PAL system at high PAL content. In the next sections, a detailed structural description of these systems is provided.
4 Structural analysis of model systems
4.1 Tilt angle distributions
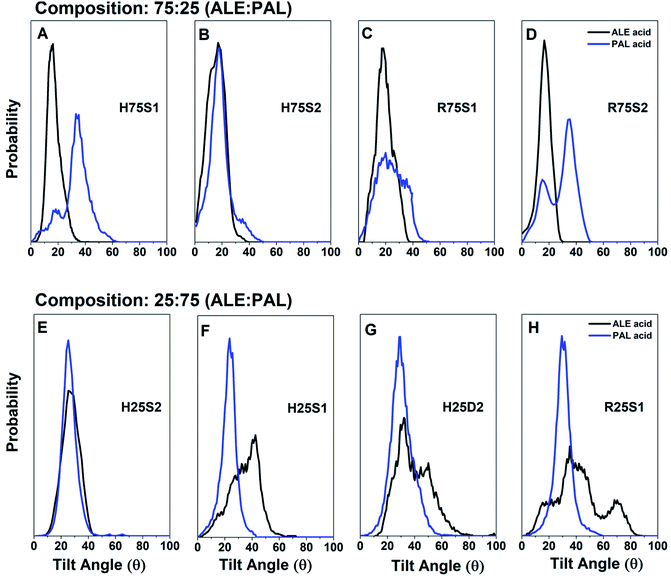
The structural compactness and molecular inclinations are analyzed from the tilt angle distribution function, which is calculated from the ε1 vector and the Z axis. The ε1 vector is computed by diagonalizing the moment of inertia matrix and corresponds to the molecular axis containing the main aliphatic chain of ALE and PAL molecules (see Fig. S2 in ESI†). Results for the most stable configurations in the 75![[thin space (1/6-em)]](https://www.rsc.org/images/entities/char_2009.gif) :
:![[thin space (1/6-em)]](https://www.rsc.org/images/entities/char_2009.gif) 25 and 25
25 and 25![[thin space (1/6-em)]](https://www.rsc.org/images/entities/char_2009.gif) :
:![[thin space (1/6-em)]](https://www.rsc.org/images/entities/char_2009.gif) 75 (ALE
75 (ALE![[thin space (1/6-em)]](https://www.rsc.org/images/entities/char_2009.gif) :
:![[thin space (1/6-em)]](https://www.rsc.org/images/entities/char_2009.gif) PAL) systems are shown in Fig. 5. Fig. S4 and S5† also shows top and side views of representative mixtures to help the systems visualization.
PAL) systems are shown in Fig. 5. Fig. S4 and S5† also shows top and side views of representative mixtures to help the systems visualization.
![[thin space (1/6-em)]](https://www.rsc.org/images/entities/b_char_2009.gif) :
:![[thin space (1/6-em)]](https://www.rsc.org/images/entities/b_char_2009.gif) 25 (ALE
25 (ALE![[thin space (1/6-em)]](https://www.rsc.org/images/entities/b_char_2009.gif) :
:![[thin space (1/6-em)]](https://www.rsc.org/images/entities/b_char_2009.gif) PAL) composition. For systems with 75
PAL) composition. For systems with 75![[thin space (1/6-em)]](https://www.rsc.org/images/entities/char_2009.gif) :
:![[thin space (1/6-em)]](https://www.rsc.org/images/entities/char_2009.gif) 25 composition, the analysis of the tilt angle distributions for ALE and PAL molecules show different behaviors. The ALE molecules present sharp mono-nodal distributions with angles between 0° and 40° and peaked at 17°, resulting in quasi-vertical monolayers. It is also observed that the organization, verticality, and compactness of ALE molecules are enhanced in the most stable systems (segregated systems in hexagonal arrangements). These results indicate that systems with a high ALE composition maintain their capacity to form ordered self-assembled systems.
25 composition, the analysis of the tilt angle distributions for ALE and PAL molecules show different behaviors. The ALE molecules present sharp mono-nodal distributions with angles between 0° and 40° and peaked at 17°, resulting in quasi-vertical monolayers. It is also observed that the organization, verticality, and compactness of ALE molecules are enhanced in the most stable systems (segregated systems in hexagonal arrangements). These results indicate that systems with a high ALE composition maintain their capacity to form ordered self-assembled systems.Concerning PAL molecules, in segregated systems (H75S1, H75S2, R75S1, and R75S2), PAL molecules are not as disorganized as in pure PAL SAMs (ESI, Fig. S2†), due to the restriction that ALE molecules impose, mainly through the interactions between –COOH groups. Therefore, it is expected that PAL molecules that do not interact with ALE molecules tend to behave similarly to the pure PAL, which is a characteristic behavior for non-midchain functionalized amphiphilic alkyl molecules.
Height distribution profile obtained from AFM images for ALE rich (8![[thin space (1/6-em)]](https://www.rsc.org/images/entities/char_2009.gif) :
:![[thin space (1/6-em)]](https://www.rsc.org/images/entities/char_2009.gif) 2 ALE
2 ALE![[thin space (1/6-em)]](https://www.rsc.org/images/entities/char_2009.gif) :
:![[thin space (1/6-em)]](https://www.rsc.org/images/entities/char_2009.gif) PAL) mixtures (Fig. 6) confirms the quasi-vertical packing of ALE molecules into monolayers 24.0 Å high (phase I). Regarding the PAL component, configurational energy values indicate that segregated islands are the most feasible situation and isolated PAL moieties ∼9.0 Å high are detected by AFM (phase II). Such value is slightly lower than the one obtained for pure PAL SAMs (10.0–12.0 Å), but in both cases, they correspond to a tilt of ∼60–70°, in agreement with the tilting susceptibility of PAL predicted by molecular dynamics simulations (∼50–70° and ∼110–130° in Fig. S3†).
PAL) mixtures (Fig. 6) confirms the quasi-vertical packing of ALE molecules into monolayers 24.0 Å high (phase I). Regarding the PAL component, configurational energy values indicate that segregated islands are the most feasible situation and isolated PAL moieties ∼9.0 Å high are detected by AFM (phase II). Such value is slightly lower than the one obtained for pure PAL SAMs (10.0–12.0 Å), but in both cases, they correspond to a tilt of ∼60–70°, in agreement with the tilting susceptibility of PAL predicted by molecular dynamics simulations (∼50–70° and ∼110–130° in Fig. S3†).
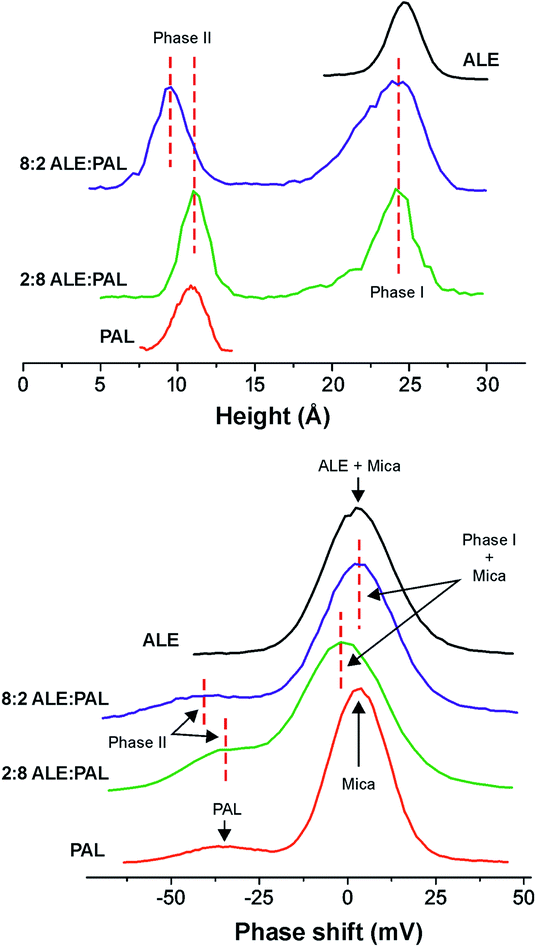 | ||
Fig. 6 (Top) Height and (bottom) phase-shift histograms from AFM images of SAMs obtained from pure ALE and PAL as well as 8![[thin space (1/6-em)]](https://www.rsc.org/images/entities/char_2009.gif) : :![[thin space (1/6-em)]](https://www.rsc.org/images/entities/char_2009.gif) 2 and 2 2 and 2![[thin space (1/6-em)]](https://www.rsc.org/images/entities/char_2009.gif) : :![[thin space (1/6-em)]](https://www.rsc.org/images/entities/char_2009.gif) 8 ALE 8 ALE![[thin space (1/6-em)]](https://www.rsc.org/images/entities/char_2009.gif) : :![[thin space (1/6-em)]](https://www.rsc.org/images/entities/char_2009.gif) PAL mixtures. PAL mixtures. | ||
The weakness of the cohesion between PAL molecules within the SAM results in a low stiffness, which is also reflected in the low phase-shift value observed (phase II). Smaller isolated PAL islands in the 8![[thin space (1/6-em)]](https://www.rsc.org/images/entities/char_2009.gif) :
:![[thin space (1/6-em)]](https://www.rsc.org/images/entities/char_2009.gif) 2 ALE
2 ALE![[thin space (1/6-em)]](https://www.rsc.org/images/entities/char_2009.gif) :
:![[thin space (1/6-em)]](https://www.rsc.org/images/entities/char_2009.gif) PAL (phase II) are more easily compressed than larger PAL SAMs prepared from pure PAL solutions and therefore the height measurement is slightly lower (9.0 Å vs. 11.0 Å). This result also illustrates the structural weakness of PAL SAMs and how the pressure exerted by the AFM probe may cause higher experimental tilt angles that those expected from simulations.
PAL (phase II) are more easily compressed than larger PAL SAMs prepared from pure PAL solutions and therefore the height measurement is slightly lower (9.0 Å vs. 11.0 Å). This result also illustrates the structural weakness of PAL SAMs and how the pressure exerted by the AFM probe may cause higher experimental tilt angles that those expected from simulations.
![[thin space (1/6-em)]](https://www.rsc.org/images/entities/b_char_2009.gif) :
:![[thin space (1/6-em)]](https://www.rsc.org/images/entities/b_char_2009.gif) 75 (ALE
75 (ALE![[thin space (1/6-em)]](https://www.rsc.org/images/entities/b_char_2009.gif) :
:![[thin space (1/6-em)]](https://www.rsc.org/images/entities/b_char_2009.gif) PAL) composition. Configurational energy calculations have shown that the 25
PAL) composition. Configurational energy calculations have shown that the 25![[thin space (1/6-em)]](https://www.rsc.org/images/entities/char_2009.gif) :
:![[thin space (1/6-em)]](https://www.rsc.org/images/entities/char_2009.gif) 75 ALE
75 ALE![[thin space (1/6-em)]](https://www.rsc.org/images/entities/char_2009.gif) :
:![[thin space (1/6-em)]](https://www.rsc.org/images/entities/char_2009.gif) PAL system is less prone to segregation than 75
PAL system is less prone to segregation than 75![[thin space (1/6-em)]](https://www.rsc.org/images/entities/char_2009.gif) :
:![[thin space (1/6-em)]](https://www.rsc.org/images/entities/char_2009.gif) 25 ALE
25 ALE![[thin space (1/6-em)]](https://www.rsc.org/images/entities/char_2009.gif) :
:![[thin space (1/6-em)]](https://www.rsc.org/images/entities/char_2009.gif) PAL. Simulations have also shown that tilt-angle distributions of ALE and PAL are reversed in both systems. Generally, in 25
PAL. Simulations have also shown that tilt-angle distributions of ALE and PAL are reversed in both systems. Generally, in 25![[thin space (1/6-em)]](https://www.rsc.org/images/entities/char_2009.gif) :
:![[thin space (1/6-em)]](https://www.rsc.org/images/entities/char_2009.gif) 75, ALE molecules are more inclined and disorganized than in 75
75, ALE molecules are more inclined and disorganized than in 75![[thin space (1/6-em)]](https://www.rsc.org/images/entities/char_2009.gif) :
:![[thin space (1/6-em)]](https://www.rsc.org/images/entities/char_2009.gif) 25 while PAL units are more vertically packed.
25 while PAL units are more vertically packed.In this sense, AFM height profiles of 2![[thin space (1/6-em)]](https://www.rsc.org/images/entities/char_2009.gif) :
:![[thin space (1/6-em)]](https://www.rsc.org/images/entities/char_2009.gif) 8 ALE
8 ALE![[thin space (1/6-em)]](https://www.rsc.org/images/entities/char_2009.gif) :
:![[thin space (1/6-em)]](https://www.rsc.org/images/entities/char_2009.gif) PAL detect an slight increase of phase II height with respect to the 8
PAL detect an slight increase of phase II height with respect to the 8![[thin space (1/6-em)]](https://www.rsc.org/images/entities/char_2009.gif) :
:![[thin space (1/6-em)]](https://www.rsc.org/images/entities/char_2009.gif) 2 ALE
2 ALE![[thin space (1/6-em)]](https://www.rsc.org/images/entities/char_2009.gif) :
:![[thin space (1/6-em)]](https://www.rsc.org/images/entities/char_2009.gif) PAL system (Fig. 6, top). The sizes of phase II islands in 8
PAL system (Fig. 6, top). The sizes of phase II islands in 8![[thin space (1/6-em)]](https://www.rsc.org/images/entities/char_2009.gif) :
:![[thin space (1/6-em)]](https://www.rsc.org/images/entities/char_2009.gif) 2 and 2
2 and 2![[thin space (1/6-em)]](https://www.rsc.org/images/entities/char_2009.gif) :
:![[thin space (1/6-em)]](https://www.rsc.org/images/entities/char_2009.gif) 8 ALE
8 ALE![[thin space (1/6-em)]](https://www.rsc.org/images/entities/char_2009.gif) :
:![[thin space (1/6-em)]](https://www.rsc.org/images/entities/char_2009.gif) PAL mixtures are very similar (Fig. 3), and consequently, such height growth cannot be ascribed to larger and less compressible SAMs. Besides, surface coverage data show that the presence of ALE molecules favors PAL adsorption. Therefore, it is presumable that phase II in 2
PAL mixtures are very similar (Fig. 3), and consequently, such height growth cannot be ascribed to larger and less compressible SAMs. Besides, surface coverage data show that the presence of ALE molecules favors PAL adsorption. Therefore, it is presumable that phase II in 2![[thin space (1/6-em)]](https://www.rsc.org/images/entities/char_2009.gif) :
:![[thin space (1/6-em)]](https://www.rsc.org/images/entities/char_2009.gif) 8 ALE
8 ALE![[thin space (1/6-em)]](https://www.rsc.org/images/entities/char_2009.gif) :
:![[thin space (1/6-em)]](https://www.rsc.org/images/entities/char_2009.gif) PAL is a dispersed mixed system with few ALE molecules acting as anchorage points and reinforcing lateral interactions within the SAM structure. Such reinforcement would lead to a more vertical distribution of PAL units, as indicated by calculated tilt angle distributions and would explain the higher phase-shift (lower compressibility) values observed for phase II in 2
PAL is a dispersed mixed system with few ALE molecules acting as anchorage points and reinforcing lateral interactions within the SAM structure. Such reinforcement would lead to a more vertical distribution of PAL units, as indicated by calculated tilt angle distributions and would explain the higher phase-shift (lower compressibility) values observed for phase II in 2![[thin space (1/6-em)]](https://www.rsc.org/images/entities/char_2009.gif) :
:![[thin space (1/6-em)]](https://www.rsc.org/images/entities/char_2009.gif) 8 ALE
8 ALE![[thin space (1/6-em)]](https://www.rsc.org/images/entities/char_2009.gif) :
:![[thin space (1/6-em)]](https://www.rsc.org/images/entities/char_2009.gif) PAL.
PAL.
On the other side, the height of phase I (∼24.0 Å) measured by AFM is not consistent with the height reduction predicted for most of the configurations of ALE monolayers in the 25![[thin space (1/6-em)]](https://www.rsc.org/images/entities/char_2009.gif) :
:![[thin space (1/6-em)]](https://www.rsc.org/images/entities/char_2009.gif) 75 ALE
75 ALE![[thin space (1/6-em)]](https://www.rsc.org/images/entities/char_2009.gif) :
:![[thin space (1/6-em)]](https://www.rsc.org/images/entities/char_2009.gif) PAL system. In this regard, it is interesting to notice that the size of phase I is quite small and exhibits straight edges (Fig. 3, right). Our hypothesis is that phase I is mostly a highly ordered (crystalline) ALE domain with a minimal PAL mixing, low enough to not affect island topography but responsible for the slight phase shift reduction with respect to pure ALE monolayers (Fig. 6).
PAL system. In this regard, it is interesting to notice that the size of phase I is quite small and exhibits straight edges (Fig. 3, right). Our hypothesis is that phase I is mostly a highly ordered (crystalline) ALE domain with a minimal PAL mixing, low enough to not affect island topography but responsible for the slight phase shift reduction with respect to pure ALE monolayers (Fig. 6).
In next section, we discuss how the active groups (–COOH, primary and secondary –OH) are distributed for both compositions, and how this distribution determines the stability, compactness and the degree of inclination of the molecules.
4.2 Density profiles
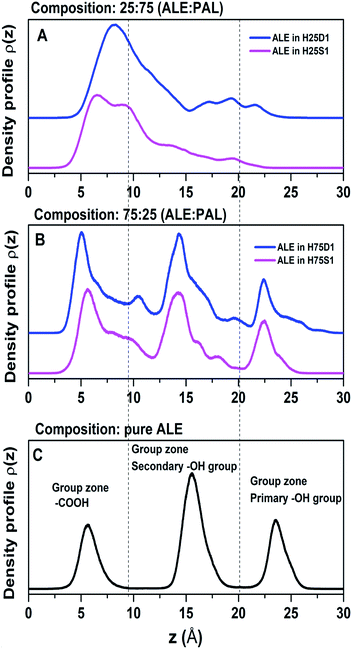
A useful tool for analyzing the degree of structural organization is representing density profiles along the z-direction. Here, we focus on the density distributions of the active groups: –COOH, primary, and secondary –OH. Fig. 7 shows these profiles for the two mixtures and also for pure ALE as a reference case, in which molecules are highly organized (Fig. 7C). It becomes evident that ALE molecules in 75![[thin space (1/6-em)]](https://www.rsc.org/images/entities/char_2009.gif) :
:![[thin space (1/6-em)]](https://www.rsc.org/images/entities/char_2009.gif) 25 are more organized than in 25
25 are more organized than in 25![[thin space (1/6-em)]](https://www.rsc.org/images/entities/char_2009.gif) :
:![[thin space (1/6-em)]](https://www.rsc.org/images/entities/char_2009.gif) 75.
75.
In 75![[thin space (1/6-em)]](https://www.rsc.org/images/entities/char_2009.gif) :
:![[thin space (1/6-em)]](https://www.rsc.org/images/entities/char_2009.gif) 25, the active groups maintain a separation distance between them, minimizing the cross-interactions that favor the disorganization of the systems. In 25
25, the active groups maintain a separation distance between them, minimizing the cross-interactions that favor the disorganization of the systems. In 25![[thin space (1/6-em)]](https://www.rsc.org/images/entities/char_2009.gif) :
:![[thin space (1/6-em)]](https://www.rsc.org/images/entities/char_2009.gif) 75, there is no well-defined separation between the active groups, and it is expected that the cross-interactions might gain relevance leading the systems to lose their ability to form an ordered structure (Fig. 7A).
75, there is no well-defined separation between the active groups, and it is expected that the cross-interactions might gain relevance leading the systems to lose their ability to form an ordered structure (Fig. 7A).
For 25![[thin space (1/6-em)]](https://www.rsc.org/images/entities/char_2009.gif) :
:![[thin space (1/6-em)]](https://www.rsc.org/images/entities/char_2009.gif) 75, the ALE molecules are disorganized because the cross-interactions are predominant, that is, –COOH⋯(primary OH), –COOH⋯(secondary OH) and primary⋯secondary OH interactions. Based on results of tilt angle distributions and density profiles, we propose that in low ALE content SAMs, the molecular disorganization would be a consequence of favoring ALE cross-interactions. In this scenario, ALE molecules would act as anchoring of PAL molecules avoiding their disorganization as indicated in the previous section.
75, the ALE molecules are disorganized because the cross-interactions are predominant, that is, –COOH⋯(primary OH), –COOH⋯(secondary OH) and primary⋯secondary OH interactions. Based on results of tilt angle distributions and density profiles, we propose that in low ALE content SAMs, the molecular disorganization would be a consequence of favoring ALE cross-interactions. In this scenario, ALE molecules would act as anchoring of PAL molecules avoiding their disorganization as indicated in the previous section.
4.3 H-bond interactions
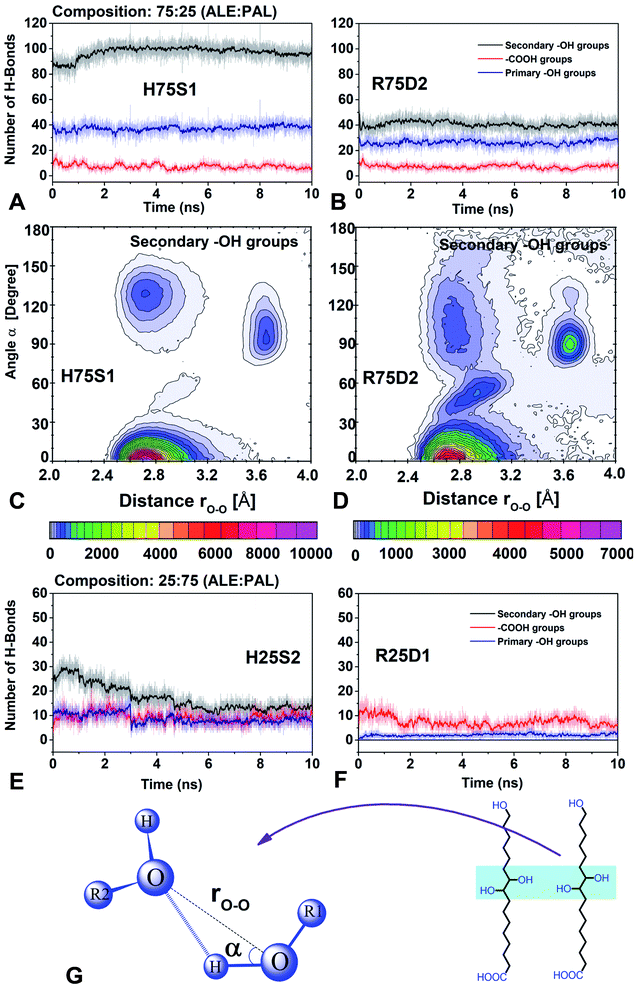
In this section, the role of H-bonds in the structural arrangement of segregated and dispersed systems was examined. The most stable segregated system and the least stable dispersed system were chosen. For 75![[thin space (1/6-em)]](https://www.rsc.org/images/entities/char_2009.gif) :
:![[thin space (1/6-em)]](https://www.rsc.org/images/entities/char_2009.gif) 25 composition, those systems correspond to H75S1 and R75D2, respectively, whereas, for 25
25 composition, those systems correspond to H75S1 and R75D2, respectively, whereas, for 25![[thin space (1/6-em)]](https://www.rsc.org/images/entities/char_2009.gif) :
:![[thin space (1/6-em)]](https://www.rsc.org/images/entities/char_2009.gif) 75, they are H25S2 and R25D1, respectively.
75, they are H25S2 and R25D1, respectively.
For 75![[thin space (1/6-em)]](https://www.rsc.org/images/entities/char_2009.gif) :
:![[thin space (1/6-em)]](https://www.rsc.org/images/entities/char_2009.gif) 25, the amount of H-bonds of the primary and secondary –OH groups is higher in the segregated system than in the dispersed system and the amount of H-bonds of the –COOH groups is the same in both systems (H75S1 and R25D2, Fig. 8A and B). Therefore, segregated systems are more stable mainly due to the H-bonds formed by the –OH primary and secondary groups.
25, the amount of H-bonds of the primary and secondary –OH groups is higher in the segregated system than in the dispersed system and the amount of H-bonds of the –COOH groups is the same in both systems (H75S1 and R25D2, Fig. 8A and B). Therefore, segregated systems are more stable mainly due to the H-bonds formed by the –OH primary and secondary groups.
In addition, it is observed that in all systems the number of H-bonds formed by the active groups always has this behavior: secondary –OH > primary –OH ≫ –COOH. Therefore, the secondary –OH groups are primarily responsible for forming self-assembling systems. On the contrary, the –COOH groups have a minor ability to form H-bonds, and therefore, they have little control over the packing process. This fact confirms that pure PAL systems (see Fig. S3 in ESI†) do not lead to the formation of organized systems. The primary –OH groups have the intermediate capacity to form H-bonds when compared to secondary –OH groups, and therefore, they have a limited control in the organization process.
The next step is to understand why the systems, despite having the same number of secondary –OH groups, have different behavior respect to the ability to form H-bonds. Combined distribution functions (CDF) were used to monitor the variables that define an H-bond, using the TRAVIS code.40 In particular, we use radial and angular distribution functions (RDF and ADF) to monitor the rO–O distance and α angle, respectively (Fig. 8C, D and G). It was observed that in the H75S1 system, the region that favors formation of H-bonds (rO–O = 2.4–3.2 Å and α = 0.0–30.0°) is dominant. It has a relative intensity of 1.42 times than the R75D2 system. In addition, in the less stable system (R75D2) the rO–O and α parameters define zones that have no relation to an H-bond zone (therefore it is less stable), mainly those zones comprising rO–O = 2.4–3.2 Å, α = 30.0–180.0° and rO–O = 3.5–3.8 Å, α = 70.0–150.0° (Fig. 8D). By contrast, in the most stable system (H75S1), the rO–O and α parameters have values concentrated in the zone that favors the H-bond (therefore it is most stable, Fig. 8C).
For 25![[thin space (1/6-em)]](https://www.rsc.org/images/entities/char_2009.gif) :
:![[thin space (1/6-em)]](https://www.rsc.org/images/entities/char_2009.gif) 75 composition, the behavior of the active groups is different for each type of system. For the less stable system (Fig. 8F, R25D1), the –COOH group has the highest number of H-bonds, and there is no H-bond formation between secondary –OH groups. Therefore, the primary and secondary –OH groups have less influence on stability than the –COOH groups. These results indicate that the ALE molecules are not organized, according to the previous results from density profiles. In addition, the predominance of the H-bond between the –COOH groups suggests that ALE molecules are somewhat anchored at their base.
75 composition, the behavior of the active groups is different for each type of system. For the less stable system (Fig. 8F, R25D1), the –COOH group has the highest number of H-bonds, and there is no H-bond formation between secondary –OH groups. Therefore, the primary and secondary –OH groups have less influence on stability than the –COOH groups. These results indicate that the ALE molecules are not organized, according to the previous results from density profiles. In addition, the predominance of the H-bond between the –COOH groups suggests that ALE molecules are somewhat anchored at their base.
In the case of the most stable system (Fig. 8E, H25S2), the secondary –OH groups form a higher number of H-bonds; that is, they are the dominant groups. However, its predominance decreases considerably in the first 5 ns of simulation, after that, all groups have practically the same predominance. As a consequence of this, it is expected that in segregated systems the ALE molecules are a little more organized than in the dispersed systems.
5 Conclusions
Selected hydroxylated linear fatty acids such as 9,10,16 trihydroxyhexadecanoic (aleuritic, ALE) and hexadecanoic (palmitic, PAL) acids have been used to study the role of the functional groups in their ability to form mixed self-assembled monolayers (SAMs) on mica surfaces. AFM data reveal that rich ALE systems behave as ideal mixtures giving rise to segregated SAMs corresponding to either pure ALE or PAL assemblies.On the other side, rich PAL systems are more susceptible to form dispersed structures. Classical molecular dynamics simulations have confirmed that, in systems with a high ALE composition, segregation processes are favored and the presence of dispersed phases is unusual. On the contrary, in low ALE content mixtures, a cooperative effect between ALE and PAL molecules leads to a more extended and better packing of PAL units when compared to the pure PAL system. Carboxylic acid and hydroxyl functional groups have different influence on the self-assembly process. Thus, hydrogen bonding between secondary –OH groups is the main interaction and their preponderance favors the formation of self-assembled systems. On the contrary, –COOH groups, have less influence and they do not guarantee by themselves the formation of self-assembled systems.
Conflicts of interest
There are no conflicts to declare.Acknowledgements
This work was funded in part by Fundação de Amparo à Pesquisa do Estado de São Paulo–FAPESP (2013/07296-2; 2016/23891-6). This work used computational resources of the “Centro Nacional de Processamento de Alto Desempenho em São Paulo” (CENAPAD-SP), “Centro de Computação John David Rogers” (CCJDR-UNICAMP), and the CENAPAD-RJ (SDumont). This work was funded by National Council for the Improvement of Higher Education (CAPES).References
- A. Ulman, An Introduction to Ultrathin Organic Films: From Langmuir--Blodgett to Self--Assembly, Academic press, 2013 Search PubMed.
- H. I. Kim, T. Koini, T. R. Lee and S. S. Perry, Langmuir, 1997, 13, 7192–7196 CrossRef CAS.
- M. Salmeron, CHEMTECH, 1998, 28, 17–23 CAS.
- R. Haneda and K. Aramaki, J. Electrochem. Soc., 1998, 145, 1856–1861 CrossRef CAS.
- G. K. Jennings and P. E. Laibinis, J. Am. Chem. Soc., 1997, 119, 5208–5214 CrossRef CAS.
- F. P. Zamborini and R. M. Crooks, Langmuir, 1998, 14, 3279–3286 CrossRef CAS.
- D. Charych, J. Nagy, W. Spevak and M. Bednarski, Science, 1993, 261, 585–588 CrossRef CAS.
- K. Schierbaum, T. Weiss, E. T. Van Veizen, J. Engbersen, D. Reinhoudt and W. Göpel, Science, 1994, 265, 1413–1415 CrossRef CAS.
- C. B. Gorman, H. A. Biebuyck and G. M. Whitesides, Chem. Mater., 1995, 7, 526–529 CrossRef CAS.
- J. C. Love, L. A. Estroff, J. K. Kriebel, R. G. Nuzzo and G. M. Whitesides, Chem. Rev., 2005, 105, 1103–1170 CrossRef CAS.
- R. Maboudian, MRS Bull., 2013, 23, 47–51 CrossRef.
- R. D. Piner, J. Zhu, F. Xu, S. Hong and C. A. Mirkin, Science, 1999, 283, 661–663 CrossRef CAS.
- S. Xu and G.-y. Liu, Langmuir, 1997, 13, 127–129 CrossRef CAS.
- J. Oviedo, M. A. San-Miguel, J. A. Heredia-Guerrero and J. J. Benítez, J. Phys. Chem. C, 2012, 116, 7099–7105 CrossRef CAS.
- J. J. Benítez, J. A. Heredia-Guerrero and A. Heredia, J. Phys. Chem. C, 2007, 111, 9465–9470 CrossRef.
- J. J. Benítez, J. A. Heredia-Guerrero, M. A. San-Miguel and H. C. Galloway, J. Phys. Chem. B, 2018, 122, 493–499 CrossRef.
- A. S. Côté, R. Darkins and D. M. Duffy, J. Phys. Chem. C, 2014, 118, 19188–19193 CrossRef.
- A. S. Côté, C. L. Freeman, R. Darkins and D. M. Duffy, J. Phys. Chem. C, 2013, 117, 7148–7153 CrossRef.
- J. H. E. Cartwright, A. G. Checa, J. D. Gale, D. Gebauer and C. I. Sainz-Díaz, Angew. Chem., Int. Ed., 2012, 51, 11960–11970 CrossRef CAS.
- M. C. Warren, M. T. Dove, E. R. Myers, A. Bosenick, E. J. Palin, C. I. Sainz-Diaz, B. S. Guiton and S. A. T. Redfern, Mineral. Mag., 2018, 65, 221–248 CrossRef.
- J. A. Heredia-Guerrero, M. A. San-Miguel, M. S. P. Sansom, A. Heredia and J. J. Benítez, Phys. Chem. Chem. Phys., 2010, 12, 10423–10428 RSC.
- M. A. San-Miguel, J. Oviedo, J. A. Heredia-Guerrero, A. Heredia and J. J. Benitez, J. Mol. Model., 2014, 20, 2329 CrossRef.
- J. Benítez, J. Heredia-Guerrero, E. Dominguez, M. San-Miguel and A. Heredia, Adv. Mater. Sci. Res., 2011, 6, 181–212 Search PubMed.
- I. Horcas, R. Fernández, J. M. Gómez-Rodríguez, J. Colchero, J. Gómez-Herrero and A. M. Baro, Rev. Sci. Instrum., 2007, 78, 013705 CrossRef CAS.
- W. Smith, C. W. Yong and P. M. Rodger, Mol. Simul., 2002, 28, 385–471 CrossRef CAS.
- S. Nosé, Mol. Phys., 1984, 52, 255–268 CrossRef.
- L. Rosso and I. R. Gould, J. Comput. Chem., 2008, 29, 24–37 CrossRef CAS.
- J. Hautman and M. L. Klein, Mol. Phys., 1992, 75, 379–395 CrossRef CAS.
- J. Hautman and M. L. Klein, J. Chem. Phys., 1989, 91, 4994–5001 CrossRef CAS.
- J. A. Heredia-Guerrero, M. A. San-Miguel, M. S. P. Sansom, A. Heredia and J. J. Benítez, Langmuir, 2009, 25, 6869–6874 CrossRef CAS.
- R. P. S. Fartaria, F. F. M. Freitas and F. M. S. Silva Fernandes, J. Electroanal. Chem., 2005, 574, 321–331 CrossRef CAS.
- L.-J. Zhang, Y. Zhang, R.-J. Zhang and X.-S. Feng, Colloids Surf., A, 2007, 293, 195–200 CrossRef CAS.
- S. Campen, J. H. Green, G. D. Lamb and H. A. Spikes, Tribol. Lett., 2015, 57, 18 CrossRef.
- G. S. Patil, R. Matthews and D. Cornwell, J. Lipid Res., 1976, 17, 197–202 CAS.
- G. L. G. JUN and D. Tabor, Nature, 1956, 178, 1304 Search PubMed.
- M. Deleu, K. Nott, R. Brasseur, P. Jacques, P. Thonart and Y. F. Dufrêne, Biochim. Biophys. Acta, Biomembr., 2001, 1513, 55–62 CrossRef CAS.
- C. E. Taylor and D. K. Schwartz, Langmuir, 2003, 19, 2665–2672 CrossRef CAS.
- S. Magonov, V. Elings and M.-H. Whangbo, Surf. Sci., 1997, 375, L385–L391 CrossRef CAS.
- J. J. Benítez, J. A. Heredia-Guerrero, F. M. Serrano and A. Heredia, J. Phys. Chem. C, 2008, 112, 16968–16972 CrossRef.
- M. Brehm and B. Kirchner, J. Chem. Inf. Model., 2011, 51, 2007–2023 CrossRef CAS.
Footnote |
| † Electronic supplementary information (ESI) available: Support figures. See DOI: 10.1039/c9ra06799j |
| This journal is © The Royal Society of Chemistry 2019 |


