 Open Access Article
Graphene quantum dots mediated electron transfer in DNA base pairs†
Chang
Liu
 ,
Linqing
Guo
,
Biao
Zhang
and
Liping
Lu
,
Linqing
Guo
,
Biao
Zhang
and
Liping
Lu
 *
*
Key Laboratory of Beijing on Regional Air Pollution Control, Beijing University of Technology, Beijing 100124, China. E-mail: lipinglu@bjut.edu.cn
First published on 4th October 2019
Abstract
Graphene quantum dots (GQDs) were connected to [Ru(bpy)3]2+ to sense DNA-mediated charge transfer. Interaction between abasic site double stranded DNA (Abasic-DNA) and [Ru(bpy)3–GQD]2+ was investigated by absorption spectroscopy, gel electrophoresis, circular dichroism, and melting temperature measurements. The results indicate that [Ru(bpy)3–GQD]2+ could be intercalated into double stranded DNA. Using [Ru(bpy)3–GQD]2+ as a signal molecule, the charge transfer performance of DNA-intercalated [Ru(bpy)3–GQD]2+ was determined using electrochemical and electrochemiluminescence measurements. Various DNA types were immobilized on Au electrodes via Au–S bonds. Electrochemiluminescence and electrochemical measurements indicate that [Ru(bpy)3–GQD]2+ could enhance DNA-mediated charge transfer when intercalated into an abasic site of double stranded DNA. And comparing with [Ru(bpy)3]2+, it can be concluded that GQDs intercalate into the DNA duplex by acting as a base analog, thus enhancing DNA charge transfer. These findings suggest that the DNA–GQD structure could aid the development of molecular devices and electric drivers, and broaden the application of DNA charge transfer.
1. Introduction
Graphene is a monolayer of carbon atoms with a dense honeycomb crystal structure that can be stacked into graphite. As an emerging material, graphene quantum dots/carbon dots has been widely used in biosensing.1–9 Graphene quantum dots (GQDs) are small graphene fragments, which can be one layer thick. GQDs stacked on top of each other have a structure similar to the stacked base pairs of DNA.10–13 Consecutive base pairs of DNA are stacked closely together, allowing the interaction of adjacent aromatic systems of DNA. Double stranded DNA (dsDNA) is capable of mediating charge transport through its π-stacked base pairs,14,15 and graphene exhibits outstanding electrical conductivity.16–18 For this reason, GQDs are well suited for monitoring charge transport (CT) in DNA.In the past few decades, DNA CT has received significant interest from biologists, physicists and chemists.14,19,20 The rapid development of electronic techniques has led to the miniaturization of electronic devices, and thus to the development of molecular electronics.21,22 DNA is a good candidate for molecular devices because of its unique identifiability and self-assembly capability.23 Recent investigations have shown that CT is of great significance in understanding the mechanisms of genetic damage and message transmission, and for exploring methods for gene therapy.
A method of injecting charge onto a DNA strand and for reporting the CT event is necessary for investigating DNA CT.24–27 Many studies have shown that metal complexes are good probes of DNA CT.28–30 Varying the metal ligands and DNA-binding features are important parameters for governing DNA-mediated electron transfer. In addition, ancillary ligands can influence the electrochemical or photophysical properties of these complexes.31,32 Particularly effective examples are transition metal complexes, which can sensitively tune their electronic and electrochemical or luminescent properties upon interaction with duplex DNA.33,34 Since the [Ru(phen)3]2+ complex was reported to be capable of recognizing DNA,35–37 polypyridyl ruthenium complexes have been widely used as probes of DNA secondary structure.38–41 For example, the ruthenium complexes [Ru(bpy)3]2+ and [Ru(bpy)2dppz]2+ have been used as DNA probes.30,42,43 The use of non-natural base analogues will further our understanding of the effect of close interactions between bases on DNA CT. Many base analogues only slightly perturb the geometry and structure of the base stack, because they interact in a natural way with other bases and become part of the base stack.
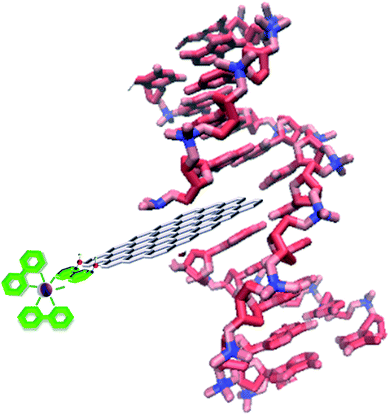
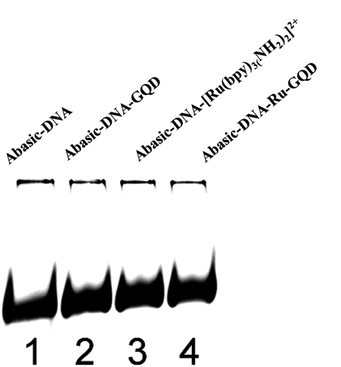
In the current study, GQDs were tailored as ligands or base analogues to sense CT in DNA, with the aim of enhancing CT in DNA. [Ru(bpy)3]2+ was used as a bridge to connect DNA and GQDs. Absorption spectroscopy, circular dichroism (CD), and polyacrylamide gel electrophoresis were used to investigate the interaction between the [Ru(bpy)3–GQD]2+ complex and DNA duplex. Electrochemical and electrochemiluminescence (ECL) results illustrate the advantages of GQDs as a base analogue for studying CT in DNA.
2. Experimental
2.1 Materials and reagents
NaCl, NaH2PO4, Na2HPO4, K3[Fe(CN)6], K4[Fe(CN)6] and KCl were purchased from Beijing Chemical Works (P. R. China). Tripropylamine (TPA) was purchased from TCI Inc. (Japan). 1-(3-Dimethylaminopropyl)-3-ethylcarbodiimide hydrochloride (EDC), 2,2′-bipyridine-4,4′-diamine [bpy(NH2)2] and cis-bis-(2,2′-bipyridine)dichlororuthenium(II) [RuCl2(bpy)2]2+ were purchased from Sigma Chemical Co. Ltd. N-Hydroxysuccinimide (NHS) was purchased from Sinopharm Chemical Reagent Co. Ltd. GQDs were purchased from Nanjing XFNANO Materials Tech Co. Ltd. Other reagents were purchased from Beijing Dingguo Changsheng Biotechnology Co. Ltd. Ultrapure water was used throughout, and was obtained from a Millipore Water Milli-Q water purification system. All reagents were of analytical grade. Oligonucleotide sequences were synthesized and purified by Sangong Biotech Co. Ltd.2.2 Apparatus and measurements
Fluorescence spectra were recorded on a Hitachi F-4600 fluorescence spectrophotometer. The excitation wavelength was set at 380 nm, and emission spectra were recorded with the wavelength range of 400–680 nm. The widths of the excitation and emission slits were 10 nm. Proton nuclear magnetic resonance (1H NMR) spectra were recorded on a Varian-500 spectrometer. Ultraviolet-visible (UV-vis) spectra were recorded on a Shimadzu UV-2450 spectrophotometer. CD spectra were recorded on an Applied Photophysics Pistar π-180 CD spectrometer, and the wavelength range was 350–200 nm. Native polyacrylamide gel electrophoresis was performed with a mini-gel apparatus (DYY-7C, Beijing Liuyi Scientific Equipment Ltd, P. R. China) using 20% acrylamide gel, and imaged on a Bio-Rad Gel Doc XR+ Imaging System.2.3 Synthesis of dsDNA
All DNA solutions were thoroughly deoxygenated with argon prior to annealing, and stored in phosphate buffer saline (PBS) (5 mM, 0.1 M NaCl, pH 7.4). Equimolar amounts of single-stranded DNA (ssDNA) were combined and annealed by heating to 90 °C and subsequently cooling to ambient temperature over 90 min, to form duplexes. Abasic site dsDNA (labeled as Abasic-DNA) was obtained by hybridizing ssDNA-1, ssDNA-2, and ssDNA-3, as shown in Table S1.† Well matched double stranded DNA (WM-DNA) was obtained by hybridizing ssDNA-1 and ssDNA-4, as shown in Table S1.† One base-mismatched double stranded DNA (MM-DNA) was obtained by hybridizing ssDNA-1 and ssDNA-5, as shown in Table S1.† DNA synthesis reactions were carried out in a Bio-RAD T100 Thermal Cycler. The base sequences of DNA used in this study were:ssDNA: 5′-CTC GGG GGC GCC AGC GGC CCC GGC TGC ATG AGC TGC AAG TGC GTG CTG AGC TGA GGA TCC-3′
Abasic-DNA: 3′- GAG CCC CCG CGG TCG CCG GGG CCG ACG TAC TCG A◆G TTC ACG CAC GAC TCG ACT CCT AGG-5′
WM-DNA: 3′-GAG CCC CCG CGG TCG CCG GGG CCG ACG TAC TCG ACG TTC ACG CAC GAC TCG ACT CCT AGG-5′
MM-DNA: 3′-GAG CCC CCG CGG TCG CCG GGG CCG ACG TAC TCG AAG TTC ACG CAC GAC TCG ACT CCT AGG-5′
2.4 Synthesis of [Ru(bpy)2(bpy(NH2)2)]2+
The [RuCl2(bpy)2·2H2O]2+ (1 mM, 0.52 g) and bpy(NH2)2 (1.5 mM, 0.279 g) were dissolved in 20 mL of ethylene glycol/water (v/v, 9![[thin space (1/6-em)]](https://www.rsc.org/images/entities/char_2009.gif) :
:![[thin space (1/6-em)]](https://www.rsc.org/images/entities/char_2009.gif) 1) in a three-necked flask. The solution was heated at reflux (120 °C) for 6 h, yielding a dark red solution, which was subsequently cooled to room temperature. 20 mL of water was added, and the resulting solution was filtered to obtain a dark red filtrate. The solution was then poured into 300 mL of aqueous NH4PF6, forming an orange-yellow precipitate. The precipitate was filtered off, washed with water and then acetonitrile, and dried under vacuum. The crude orange-yellow product was purified by column chromatography on neutral alumina with acetonitrile/methylbenzene as the eluent. The solvent was removed by rotary evaporation yielding red crystals (423 mg, yield 60%). 1H NMR confirmed that [Ru(bpy)2(bpy(NH2)2)]2+ was obtained (Fig. S-1†).
1) in a three-necked flask. The solution was heated at reflux (120 °C) for 6 h, yielding a dark red solution, which was subsequently cooled to room temperature. 20 mL of water was added, and the resulting solution was filtered to obtain a dark red filtrate. The solution was then poured into 300 mL of aqueous NH4PF6, forming an orange-yellow precipitate. The precipitate was filtered off, washed with water and then acetonitrile, and dried under vacuum. The crude orange-yellow product was purified by column chromatography on neutral alumina with acetonitrile/methylbenzene as the eluent. The solvent was removed by rotary evaporation yielding red crystals (423 mg, yield 60%). 1H NMR confirmed that [Ru(bpy)2(bpy(NH2)2)]2+ was obtained (Fig. S-1†).
2.5 Synthesis of [Ru(bpy)2(bpy(NH2)2)–GQD]2+
0.1 M EDC (20 μL) and 0.1 M NHS (10 μL) were added into an aqueous dispersion of GQDs, to activate the carboxylic acid groups. [Ru(bpy)2(bpy(NH2)2)]2+ was then incubated in the GQD solution ([Ru(bpy)2(bpy(NH2)2)]2+ (10 μM)![[thin space (1/6-em)]](https://www.rsc.org/images/entities/char_2009.gif) :
:![[thin space (1/6-em)]](https://www.rsc.org/images/entities/char_2009.gif) GQDs (1 μg mL−1) = 1
GQDs (1 μg mL−1) = 1![[thin space (1/6-em)]](https://www.rsc.org/images/entities/char_2009.gif) :
:![[thin space (1/6-em)]](https://www.rsc.org/images/entities/char_2009.gif) 5 v/v) for 30 min in a shaker to produce [Ru(bpy)2(bpy(NH2)2)–GQD]2+ (labeled as [Ru(bpy)3–GQD]2+) (Fig. S-3†).
5 v/v) for 30 min in a shaker to produce [Ru(bpy)2(bpy(NH2)2)–GQD]2+ (labeled as [Ru(bpy)3–GQD]2+) (Fig. S-3†).
2.6 Incubation of [Ru(bpy)3–GQD]2+ and dsDNA
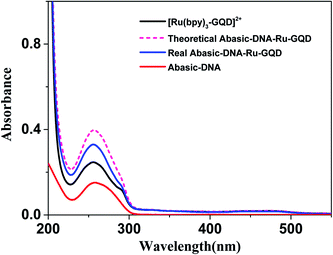
[Ru(bpy)3–GQD]2+ was gently stirred in a warm bath at 37 °C. Different amounts of 25 μM Abasic-DNA were then added to the solution, which was incubated for another 10 min. The product was labeled as Abasic-DNA–Ru-GQD.2.7 Fabrication of DNA-modified electrodes for electrochemical and ECL detection
Before surface modification, the Au electrode was polished in a 0.05 μm alumina/water slurry, followed by successive sonication in ultrapure water, ethanol and ultrapure water. The electrode was then immersed in freshly prepared piranha solution (98% H2SO4![[thin space (1/6-em)]](https://www.rsc.org/images/entities/char_2009.gif) :
:![[thin space (1/6-em)]](https://www.rsc.org/images/entities/char_2009.gif) 30% H2O2, 7
30% H2O2, 7![[thin space (1/6-em)]](https://www.rsc.org/images/entities/char_2009.gif) :
:![[thin space (1/6-em)]](https://www.rsc.org/images/entities/char_2009.gif) 3 v/v) for 10 min. The treated electrode was then rinsed thoroughly with ultrapure water and dried in a stream of N2.
3 v/v) for 10 min. The treated electrode was then rinsed thoroughly with ultrapure water and dried in a stream of N2.
Immobilization of DNA was accomplished by dropping 10 μL of 25 μM thiolated ssDNA-1 (ssDNA), Abasic-DNA, ferrocene labeled Abasic-DNA (Fc-DNA), MM-DNA, or WM-DNA on the pre-cleaned Au electrode, which were labeled as ssDNA/Au, Abasic-DNA/Au, Fc-DNA/Au, MM-DNA/Au, and WM-DNA/Au, respectively. The reaction was maintained for 16–24 h in a humid environment, to ensure the formation of a DNA monolayer on the Au electrode via thiol–Au bonds. And then 6-hydroxy-1-hexanethiol (MCH) was used for backfilling by casting 10 μL of 1 mM MCH onto the surface of Au electrode and incubated for 40 min to block the remaining active sites. The resulting electrodes were rinsed thoroughly with 5 mM PBS (pH 7.4), before use in detection measurements.
2.8 Electrochemical and ECL detection
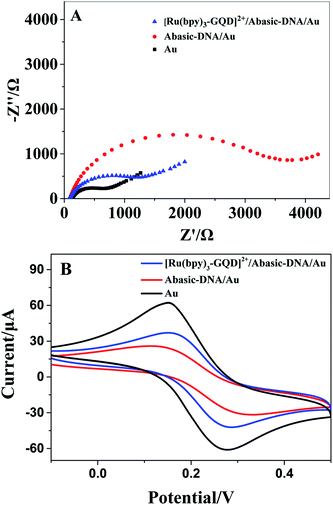
Electrochemical impedance spectroscopy (EIS) measurements were conducted in 5.0 mM K3[Fe(CN)6]/K4[Fe(CN)6] with a frequency ranging from 1 to 105 Hz. Electrochemical signals of ferrocene were obtained by recording cyclic voltammetry (CV) curves in 0.1 M phosphate buffer (pH 7.4). ECL measurements were performed using a MPI-E electroluminescent analyzer (Xian, P. R. China) with a potential range of 0.4–1.4 V and a scan rate of 100 mV s−1. The ECL intensity was detected in 0.1 M TPA (pH 7.4, 0.1 M PBS) (Scheme 1).3. Results and discussion
3.1 UV-vis and fluorescence analyses of [Ru(bpy)3–GQD]2+ complex
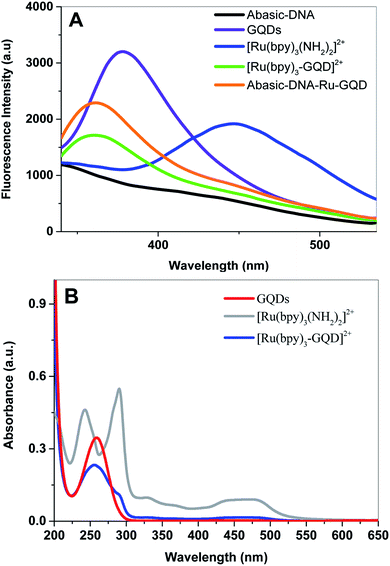
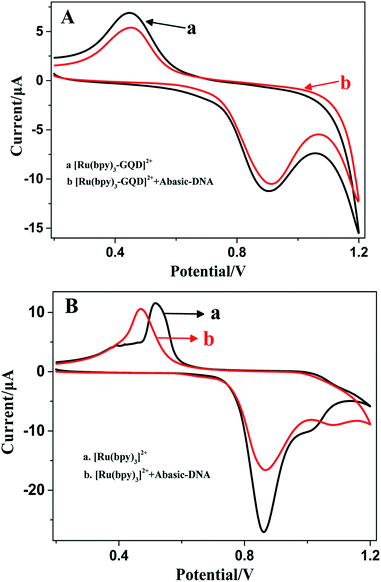
Fluorescence emission spectra of aqueous solutions of GQDs, [Ru(bpy)2(bpy(NH2)2)]2+ and [Ru(bpy)3–GQDs]2+ are shown in Fig. 1A. The GQD solution exhibits a strong photoluminescence emission centered at ca. 378 nm (dark purple). In contrast, a photoluminescence emission band at ca. 447 nm is observed for [Ru(bpy)2(bpy(NH2)2)]2+ (dark blue). There is a significant decrease in the characteristic fluorescent intensity of [Ru(bpy)3–GQDs]2+ solution (dark green), when compared to that of the GQDs. The fluorescence intensity at ca. 447 nm disappears in comparison with pure [Ru(bpy)2(bpy(NH2)2)]2+. This result suggests that GQDs as ligands for [Ru(bpy)2(bpy(NH2)2)]2+ have a strong fluorescence quenching effect.44–46 A blue-shift in emission band to around 361 nm is observed for the [Ru(bpy)3–GQDs]2+ compared to GQDs. The blue shift is attributed to coupling of the conjugated hexagonal rings of the GQDs and [Ru(bpy)2(bpy(NH2)2)]2+ functional groups.47,48UV-vis absorption spectra of solutions containing [Ru(bpy)2(bpy(NH2)2)]2+, [Ru(bpy)3–GQDs]2+ and GQDs are shown in Fig. 1B. The GQD solution exhibits an absorption band at ca. 260 nm. Two strong absorption bands appear at ca. 240 nm and 280 nm, and a broad absorption appears at ca. 450 nm. These correspond to the π–π* transition and metal-to-ligand charge transfer (MLCT) adsorptions of [Ru(bpy)2(bpy(NH2)2)]2+.49,50 When the GQDs are bound with [Ru(bpy)2(bpy(NH2)2)]2+, the π orbital of [Ru(bpy)2(bpy(NH2)2)]2+ can couple with the π orbital of the GQDs, with the coupled π orbital being partially filled with electrons. This decreases the energy of the π–π* transition, resulting in hypochromicity.51 The absorption peak of [Ru(bpy)3–GQD]2+ is significantly red shifted compared with that of [Ru(bpy)2(bpy(NH2)2)]2+. This is attributed to the significant decrease in HOMO–LUMO energy gap of [Ru(bpy)3–GQD]2+.52
3.2 Interaction between [Ru(bpy)3–GQD]2+ complex and Abasic-DNA
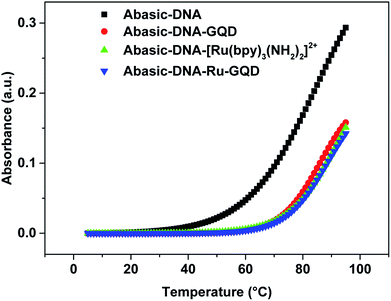 | ||
| Fig. 3 Melting curves for Abasic-DNA and Abasic-DNA–Ru-GQD from the temperature dependence of CD at 260 nm. | ||
Circular dichroism (CD) originates from interactions between chiral molecules and circularly polarized electromagnetic radiation. CD can be used to detect changes in DNA morphology. The band has a base stacking of 275 nm and a right-handed helicity of 248 nm, which make it sensitive to DNA interactions with small molecules.61,62 CD spectra of Abasic-DNA (shown as Fig. S-2†) are characterized by a positive long wavelength band or bands at about 260–280 nm. These are due to base stacking. A negative band at around 250 nm results from the DNA helicity, and indicates a right-handed B-form helical conformation.63–65 The conformation of Abasic-DNA changes after incubation with [Ru(bpy)3–GQD]2+ (shown as Fig. S-2†). The negative band at 247 nm is red shifted to 248 nm. The positive long wavelength band at 274 nm shifts to 272 nm. The results also indicate the interaction between [Ru(bpy)3–GQD]2+ and Abasic-DNA, which leads to a conformational change in Abasic-DNA.66
3.3 Electron transfer assay
The Barton group has utilized transition metal complexes combined with DNA to mediate the CT response.10,75 The current study investigates the use of metal complexes of [Ru(bpy)3–GQD]2+ as probes for initiating and monitoring DNA CT events by electrochemistry and ECL. The results have demonstrated the intercalation of [Ru(bpy)2(bpy(NH2)2)–GQD]2+ into Abasic-DNA. To investigate the performance of GQDs as a base, the CT of Abasic-DNA–Ru-GQD was studied using electrochemistry and ECL.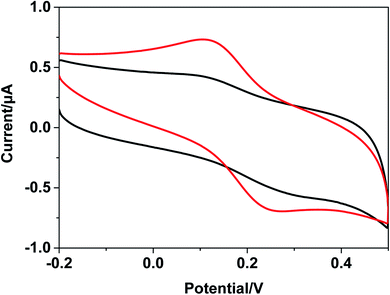 | ||
| Fig. 7 Cyclic voltammograms with Fc-DNA/Au (black line) and [Ru(bpy)3–GQD]2+/Fc-DNA/Au (red line) in 0.1 M PBS. | ||
The ferrocenyl redox peak current is significantly increased in the presence of [Ru(bpy)3–GQD]2+ in solution (red line in Fig. 7). This result is attributed to the interaction of [Ru(bpy)3–GQD]2+ with Abasic-DNA, which forms ordered base stacking in the DNA duplex. It also promotes electron transfer between the DNA probe and electrode surface, because the GQDs have highly efficient electron transfer.80,81 This further supports the conclusion that [Ru(bpy)3–GQD]2+ intercalated into Abasic-DNA acts as a base and mediates DNA CT.
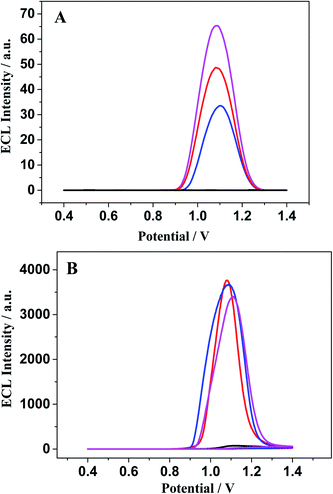
The ECL response of [Ru(bpy)3]2+ (Fig. 8B) is distinctly different from that of [Ru(bpy)3–GQD]2+ on the dsDNA-modified electrodes. The interaction between [Ru(bpy)3]2+ and dsDNA is groove binding and electrostatic interaction.83,84 Approximately the same ECL intensities are obtained for the MM-DNA/Au and WM-DNA/Au electrodes, and Abasic-DNA/Au has a slightly lower ECL intensity. This is because the absent base can disturb the formation of the duplex conformation and thus negatively affect CT.
4. Conclusions
In a word, We successfully synthesized the [Ru(bpy)2(bpy(NH2)2)]2+ and acquired [Ru(bpy)3–GQD]2+ complex through amide bond. The optical properties of complex were characterized by UV-vis and fluorescence techniques. Besides, We employed UV-vis absorption, fluorescence, melting temperature analyses as well as polyacrylamide gel electrophoresis techniques to further explore the interaction between [Ru(bpy)3–GQD]2+ and DNA duplex. Electrochemical and ECL analyses results indicated that abasic site domains could be substituted with GQDs, which Abasic-DNA was assembled on the Au electrode. Excitingly, the CT of the dsDNA was further enhanced in this way.To the best of our knowledge, this is the first report about graphene quantum dots are connected with [Ru(bpy)3]2+ as a extended ligand. Graphene quantum dots were bound to [Ru(bpy)3]2+ as an ancillary ligand, which facilitated the binding of [Ru(bpy)3–GQD]2+ with single-base deleted dsDNA. In addition, this is also the first to demonstrate that graphene quantum dots could be intercalated into the DNA duplex by acting as a base analog, and enhancing DNA charge transfer. From the above, GQDs intercalated in DNA duplex possesses great potential in the development of biotechnology and biosensors.
Conflicts of interest
The authors declare no competing financial interest.Acknowledgements
This work was financially supported by the National Natural Science Foundation of China (No. 21527808, 21876005) and Beijing Municipal High Level Innovative Team Building Program (IDHT 20180504).References
- H. Li, X. Wang, Z. Cai, L. Lu, J. Tao, B. Sun, Y. Yang, Q. Xu, Z. Yu and P. Zhao, Anal. Bioanal. Chem., 2017, 409, 6655–6662 CrossRef CAS.
- S. Lu, G. Xiao, L. Sui, T. Feng, X. Yong, S. Zhu, B. Li, Z. Liu, B. Zou, M. Jin, J. Tse, H. Yan and B. Yang, Angew. Chem., Int. Ed., 2017, 56, 6187–6191 CrossRef CAS.
- S. Lu, L. Sui, J. Liu, S. Zhu, A. Chen, M. Jin and B. Yang, Adv. Mater., 2017, 29, 1603443 CrossRef.
- S. Tao, S. Lu, Y. Geng, S. Zhu, S. A. T. Redfern, Y. Song, T. Feng, W. Xu and B. Yang, Angew. Chem., Int. Ed., 2018, 57, 2393–2398 CrossRef CAS.
- S. Lu, L. Sui, M. Wu, S. Zhu, X. Yong and B. Yang, Adv. Sci., 2019, 6, 1801192 CrossRef.
- Q. Wang, S. Zhang, B. Wang, X. Yang, B. Zou, B. Yang and S. Lu, Nanoscale Horiz., 2019, 4, 1227–1231 RSC.
- W. Li, Y. Liu, M. Wu, X. Feng, S. A. T. Redfern, Y. Shang, X. Yong, T. Feng, K. Wu, Z. Liu, B. Li, Z. Chen, J. Tse, S. Lu and B. Yang, Adv. Mater., 2018, 30, 1800676 CrossRef.
- Z. Chen, C. Wu, Z. Zhang, W. Wu, X. Wang and Z. Yu, Chin. Chem. Lett., 2018, 29, 1601–1608 CrossRef CAS.
- P. Zhao, Q. Xu, J. Tao, Z. W. Jin, Y. Pan and C. M. Yu, et al., Near infrared quantum dots in biomedical applications: current status and future perspective, Wiley Interdiscip. Rev.: Nanomed. Nanobiotechnol., 2017, e1483 Search PubMed.
- J. K. Barton, E. D. Olmon and P. A. Sontz, Coord. Chem. Rev., 2011, 255, 619–634 CrossRef CAS.
- A. K. Geim and K. S. Novoselov, Nat. Mater., 2007, 6, 183–191 CrossRef CAS PubMed.
- J. Balapanuru, J. Yang, S. Xiao, Q. Bao, M. Jahan, L. Polavarapu, J. Wei, Q. Xu and K. P. Loh, Angew. Chem., Int. Ed., 2010, 49, 6549–6553 CrossRef CAS.
- T. Premkumar and K. E. Geckeler, Prog. Polym. Sci., 2012, 37, 515–529 CrossRef CAS.
- S. O. Kelley and J. K. Barton, Science, 1999, 283, 375–381 CrossRef CAS.
- C. G. Pheeney and J. K. Barton, J. Am. Chem. Soc., 2013, 135, 14944–14947 CrossRef CAS.
- A. H. Castro Neto, F. Guinea, N. M. R. Peres, K. S. Novoselov and A. K. Geim, Rev. Mod. Phys., 2009, 81, 109–162 CrossRef CAS.
- F. Xia, T. Mueller, Y. Lin, A. Valdes-Garcia and P. Avouris, Nat. Nanotechnol., 2009, 4, 839–843 CrossRef CAS.
- A. Ambrosi and M. Pumera, Phys. Chem. Chem. Phys., 2010, 12, 8944–8948 RSC.
- D. B. Hall, R. E. Holmlin and J. K. Barton, Nature, 1996, 382, 731–735 CrossRef CAS.
- T. Rajh, Z. Saponjic, J. Q. Liu, N. M. Dimitrijevic, N. Scherer, F. M. Vega-Arroyo, P. Zapol, L. A. Curtiss and M. C. Thurnauer, Nano Lett., 2004, 4, 1017–1023 CrossRef CAS.
- C. Joachim, J. K. Gimzewski and A. Aviram, Nature, 2000, 408, 541–548 CrossRef CAS.
- R. L. Carroll and C. B. Gorman, Angew. Chem., Int. Ed., 2002, 41, 4378–4400 CrossRef.
- J. C. Genereux and J. K. Barton, Nat. Chem., 2009, 1, 106–107 CrossRef CAS.
- X. Guo, A. A. Gorodetsky, J. Hone, J. K. Barton and C. Nuckolls, Nat. Nanotechnol., 2008, 3, 163–167 CrossRef CAS.
- J. Jortner, M. Bixon, T. Langenbacher and M. E. Michel-Beyerle, Proc. Natl. Acad. Sci. U. S. A., 1998, 95, 12759–12765 CrossRef CAS.
- G. B. Schuster, Acc. Chem. Res., 2000, 33, 253–260 CrossRef CAS.
- E. M. Boon, D. M. Ceres, T. G. Drummond, M. G. Hill and J. K. Barton, Nat. Biotechnol., 2000, 18, 1096–1100 CrossRef CAS.
- K. E. Erkkila, D. T. Odom and J. K. Barton, Chem. Rev., 1999, 99, 2777–2795 CrossRef CAS PubMed.
- B. M. Zeglis, V. C. Pierre and J. K. Barton, Chem. Commun., 2007, 44, 4565–4579 RSC.
- C. Hiort, P. Lincoln and B. Norden, J. Am. Chem. Soc., 1993, 115, 3448–3454 CrossRef CAS.
- A. M. Pyle, J. P. Rehmann, R. Meshoyrer, C. V. Kumar, N. J. Turro and J. K. Barton, J. Am. Chem. Soc., 1989, 111, 3051–3058 CrossRef CAS.
- X. Q. Lu, K. M. Zhu, M. Zhang, H. D. Liu and J. W. Kang, J. Biochem. Biophys. Methods, 2002, 52, 189–200 CrossRef CAS.
- Z. Chang, J. Zhou, K. Zhao, N. Zhu, P. He and Y. Fang, Electrochim. Acta, 2006, 52, 575–580 CrossRef CAS.
- T. Huang and R. W. Murray, Langmuir, 2002, 18, 7077–7081 CrossRef CAS.
- H. Gorner, A. B. Tossi, C. Stradowski and D. Schultefrohlinde, J. Photochem. Photobiol., B, 1988, 2, 67–89 CrossRef CAS.
- M. Eriksson, M. Leijon, C. Hiort, B. Norden and A. Graslund, Biochemistry, 1994, 33, 5031–5040 CrossRef CAS.
- H. Y. Han, Z. K. He, E. E. Zeng and J. Fresen, Anal. Chem., 1999, 364, 782–785 CrossRef CAS.
- I. Haq, P. Lincoln, D. Suh, B. Norden, B. Z. Chowdhry and J. B. Chaires, J. Am. Chem. Soc., 1995, 117, 4788–4796 CrossRef CAS.
- K. F. Mårtensson, M. Abrahamsson, E. M. Tuite and P. Lincoln, Inorg. Chem., 2019, 58, 9452–9459 CrossRef.
- V. Brabec and J. Kasparkova, Coord. Chem. Rev., 2018, 376, 75–94 CrossRef CAS.
- P. Lincoln, E. Tuite and B. Nordén, J. Am. Chem. Soc., 1997, 119, 1454–1455 CrossRef CAS.
- A. E. Friedman, J. C. Chambron, J. P. Sauvage, N. J. Turro and J. K. Barton, J. Am. Chem. Soc., 1990, 112, 4960–4962 CrossRef CAS.
- L. Hu, Z. Bian, H. Li, S. Han, Y. Yuan, L. Gao and G. Xu, Anal. Chem., 2009, 81, 9807–9811 CrossRef CAS.
- E. Treossi, M. Melucci, A. Liscio, M. Gazzano, P. Samori and V. Palermo, J. Am. Chem. Soc., 2009, 131, 15576–15577 CrossRef CAS.
- H. Dong, J. Zhang, H. Ju, H. Lu, S. Wang, S. Jin, K. Hao, H. Du and X. Zhang, Anal. Chem., 2012, 84, 4587–4593 CrossRef CAS PubMed.
- L. Sheng, J. Ren, Y. Miao, J. Wang and E. Wang, Biosens. Bioelectronics, 2011, 26, 3494–3499 CrossRef CAS.
- Z. Qu, X. Zhou, L. Gu, R. Lan, D. Sun, D. Yu and G. Shi, Chem. Commun., 2013, 49, 9830–9832 RSC.
- C. Zhu, S. Yang, J. Sun, P. He, N. Yuan, J. Ding, R. Mo, G. Wang, G. Ding and X. Xie, Synth. Met., 2015, 209, 468–472 CrossRef CAS.
- Z. Xu, J. Yu and G. Liu, Sens. Actuators, B, 2013, 181, 209–214 CrossRef CAS.
- Y. Du, B. Qi, X. Yang and E. Wang, J. Phys. Chem. B, 2006, 110, 21662–21666 CrossRef CAS.
- M. Zhao, N. Liao, Y. Zhuo, Y. Chai, J. Wang and R. Yuan, Anal. Chem., 2015, 87, 7602–7609 CrossRef CAS PubMed.
- J. Song, P. Amaladass, S. Wen, K. K. Pasunooti, A. Li, Y. Yu, X. Wang, W. Deng and X. Liu, New J. Chem., 2011, 35, 127–136 RSC.
- K. Bhadra and G. S. Kumar, Biochim. Biophys. Acta, Gen. Subj., 2011, 1810, 485–496 CrossRef CAS.
- C. Wei, J. Wang and M. Zhang, Biophys. Chem., 2010, 148, 51–55 CrossRef CAS.
- J. Jaumot and R. Gargallo, Curr. Pharm. Des., 2012, 18, 1900–1916 CrossRef CAS.
- J. Liu, T. X. Zhang, T. B. Lu, L. H. Qu, H. Zhou, Q. L. Zhang and L. N. Ji, J. Inorg. Biochem., 2002, 91, 269–276 CrossRef CAS.
- G. Barone, C. F. Guerra, N. Gambino, A. Silvestri, A. Lauria, A. M. Almerico and F. M. Bickelhaupt, J. Biomol. Struct. Dyn., 2008, 26, 115–129 CrossRef CAS PubMed.
- P. Nagababu, D. A. Kumar, K. L. Reddy, K. A. Kumar, M. B. Mustafa, M. Shilpa and S. Satyanarayana, Met.-Based Drugs, 2008, 275084 Search PubMed.
- A. Schallon, C. V. Synatschke, D. V. Pergushov, V. Jerome, A. H. E. Mueller and R. Freitag, Langmuir, 2011, 27, 12042–12051 CrossRef CAS PubMed.
- K. Huang, Z. Chen, Y. Liu, M. Wang, J. Wei, X. Xie, J. Zhang, K. Hu and H. Liang, Eur. J. Med. Chem., 2013, 70, 640–648 CrossRef CAS.
- M. Kaneko and C. Nagata, Chem.-Biol. Interact., 1971, 3, 459–468 CrossRef CAS.
- Z. Liu, Y. Si and X. Chen, Acta Pharm. Sin. B, 2010, 45, 1478–1484 CAS.
- J. Kypr, I. Kejnovska, D. Renciuk and M. Vorlickova, Nucleic Acids Res., 2009, 37, 1713–1725 CrossRef CAS.
- H. Qiu, J. B. Gilroy and I. Manners, Chem. Commun., 2013, 49, 42–44 RSC.
- P. K. Yata, M. Shilpa, P. Nagababu, M. R. Reddy, L. R. Kotha, N. M. Gabra and S. Satyanarayana, J. Fluoresc., 2012, 22, 835–847 CrossRef CAS.
- S. T. Saito, G. Silva, C. Pungartnik and M. Brendel, J. Photochem. Photobiol., B, 2012, 111, 59–63 CrossRef CAS.
- A. Kulkarni, S. A. Patil and P. S. Badami, Eur. J. Med. Chem., 2009, 44, 2904–2912 CrossRef CAS.
- R. Rastogi, N. Dhindsa, C. R. Suri, B. D. Pant, S. K. Tripathi, I. Kaur and L. M. Bharadwaj, Mater. Chem. Phys., 2012, 135, 268–276 CrossRef CAS.
- X. Wang, C. Ho, L. Yan, X. Chen, K. Cheung and W. Wong, J. Inorg. Organomet. Polym., 2010, 20, 478–487 CrossRef CAS.
- Q. Feng, N. Q. Li and Y. Y. Jiang, Anal. Chim. Acta, 1997, 344, 97–104 CrossRef CAS.
- T. Dong, H. Lin, S. Lin, C. Huang, Y. Wen and L. Lee, Organometallics, 2008, 27, 555–562 CrossRef CAS.
- X. Chu, G. L. Shen, J. H. Jiang, T. F. Kang, B. Xiong and R. Q. Yu, Anal. Chim. Acta, 1998, 373, 29–38 CrossRef CAS.
- S. Shujha, A. Shah, Z. U. Rehman, N. Muhammad, S. Ali, R. Qureshi, N. Khalid and A. Meetsma, Eur. J. Med. Chem., 2010, 45, 2902–2911 CrossRef CAS.
- M. T. Carter and A. J. Bard, J. Am. Chem. Soc., 1987, 109, 7528–7530 CrossRef CAS.
- T. T. Williams, D. T. Odom and J. K. Barton, J. Am. Chem. Soc., 2000, 122, 9048–9049 CrossRef CAS.
- K. Hu, D. Lan, X. Li and S. Zhang, Anal. Chem., 2008, 80, 9124–9130 CrossRef CAS.
- M. Cho, S. Lee, S. Han, J. Park, M. A. Rahman, Y. Shim and C. Ban, Nucleic Acids Res., 2006, 34, 755–763 CrossRef.
- Y. Ge, J. Wu, H. Ju and S. Wu, Talanta, 2014, 120, 218–223 CrossRef CAS.
- Y. T. Long, C. Z. Li, T. C. Sutherland, M. Chahma, J. S. Lee and H. B. Kraatz, J. Am. Chem. Soc., 2003, 125, 8724–8725 CrossRef CAS PubMed.
- E. Wong and J. J. Gooding, Anal. Chem., 2003, 75, 3845–3852 CrossRef CAS.
- G. D. Hartwich, J. Caruana, T. de Lumley-Woodyear, Y. B. Wu, C. N. Campbell and A. Heller, J. Am. Chem. Soc., 1999, 121, 10803–10812 CrossRef CAS.
- Y. Osakada, K. Kawai, M. Fujitsuka and T. Majima, Nucleic Acids Res., 2008, 36, 5562–5570 CrossRef CAS.
- N. Kobayashi, S. Uemura, K. Kusabuka, T. Nakahira and H. Takahashi, J. Mater. Chem., 2001, 11, 1766–1768 RSC.
- J. M. Kelly, A. B. Tossi, J. D. Mcconnell and C. Ohugin, Nucleic Acids Res., 1985, 13, 6017–6034 CrossRef CAS.
Footnote |
| † Electronic supplementary information (ESI) available. See DOI: 10.1039/c9ra05481b |
| This journal is © The Royal Society of Chemistry 2019 |

