 Open Access Article
Adsorption performance of antimony by modified iron powder
Chun
Zhang
 *,
Haiyan
Jiang
,
Yumei
Deng
and
Aihe
Wang
School of Municipal and Mapping Engineering, Hunan City University, Yiyang 413000, China. E-mail: zhangchun7912@163.com; Fax: +86 737 4628718; Tel: +86 737 4628718
First published on 4th October 2019
Abstract
Antimony pollution resulting from industrial production is a great threat to the environment, ecology and the human body. Zero-valent iron powder is low-cost and easy to obtain. Nevertheless, the lower adsorption capacity limits its application when it is used as an adsorbent. In the present study, ball-milling and acid modification were developed to change its surface characteristics and γ-Fe2O3, γ-FeOOH and Fe3O4 were obtained after treatment, which promoted its adsorption capacity. Compared with the raw iron powder, the adsorption capacities for Sb(III) and Sb(V) using the modified material were increased from 12.93 mg g−1 and 5.47 mg g−1 to 17.96 mg g−1 and 10.58 mg g−1, respectively. The study showed that the experimental data fitted the Langmuir model and the pseudo-first-order kinetic model better; the adsorption process was monolayer and chemically controlled at pH 5.0 ± 0.2. XPS and FT-IR analysis showed that Fe–O–Sb bonds arose during the adsorption process. The effect of pH on the adsorption capacity was also studied and the pH affected the adsorption of Sb(V) more than the adsorption of Sb(III). In addition, the modified iron powder presented better efficiency when applied to the removal of low levels of antimony in drinking water. Based on the increase of adsorption capacity and low cost, iron powder should be a promising adsorbent for aqueous antimony removal.
1 Introduction
Antimony was widely used as an industrial additive in past decades in various industrial production processes, such as flame retardancy, in bearing and gear production, for corrosion-resistant chemical pipes, in rubber, in gasoline, as a catalyst for organic synthesis and even in ammunition production and so on.1,2 Because of its carcinogenicity and as a cumulative heavy metal, the wide application of antimony also brought serious environmental problems. Because of its high toxicity, antimony and its compounds have been classified as the pollutants for priority control by the Environmental Protection Agency of United States (US EPA) and the European Environment Agency (EEA) and the maximum contaminant concentration is strictly set as 6 μg L−1 in drinking water by the US EPA and as 5 μg L−1 by the EEA.3,4As the largest antimony producer in the world, 90% of the antimony in the world comes from China; the vast majority of antimony in China was produced in the Lengshuijiang Xikuang area in Hunan province, which is known as ‘the antimony capital of the world’.5 The soil, plants and the Zijiang River near the Xikuang deposits are under the threat of serious antimony pollution caused by antimony mining and processing. In November 2015, the leakage of more than 3000 tons of tailings containing antimony in the Longxing Antimony Industry Co. Ltd., in Gansu province in China resulted in excessive amounts of antimony in more than 300 km of the Jialing River and the western Han River. The leakage event involved Gansu, Shanxi and Sichuan provinces and brought great threat to the safety of the drinking water and the ecological system.6,7 After diffusion into the ecological environment, it is difficult for antimony to be enriched; the antimony contaminated soil and water resources may cause great harm to the human body through the food chain. Consequently, it is necessary to develop efficient technologies to treat antimony containing wastes to reduce the antimony pollution factor from the emission source.
Antimony has two valence states, trivalent antimony (Sb(III)) and pentavalent antimony (Sb(V)). The Sb(III) has more toxicity than Sb(V) and can be oxidized into Sb(V) in oxidizing atmospheres. The occurrence of the Sb(V) species is ranked as SbO2− at pHs below 2, H2SbO4 at pH 2 and 2.7, H2SbO4− and Sb(OH)6− at pH 2.7 and 10.47. Antimony containing wastewater is one of the most important wastes in the process of antimony production. Presently, adsorption, electrochemical methods, biological methods, co-precipitation and coagulation-precipitation are generally used to treat antimony containing waste water.3 Considering the cost, its application and the secondary pollution, adsorption has been considered as an attractive method because it has been proved to be efficient, cost-effective and simple to perform compared to other methods.3,8 Nevertheless, the core part of the adsorption techniques is the adsorption material, which is the key factor of the treatment.
As reported, iron oxides have strong binding for antimony and multiple iron oxides have been demonstrated to be effective for Sb removal. Both Sb(III) and Sb(V) appear to be adsorbed strongly to iron oxides, and thereby greatly affect the speciation, mobility and the fate in the environment. The iron oxide minerals, including the hydrous ferric oxides: goethite, akageneite, lepidocrocite, and hematite showed favourable affinity for Sb(III) and Sb(V). Additionally, some magnetic iron oxides and metal-doped ferrites were synthesized to remove the antimony in wastewater.9,10 Previous researchers synthesized validated iron oxy-hydroxide (FeOOH) and amorphous Fe3O4/FeOOH nanocomposite for the removal of Sb(III) and Sb(V) from drinking water with an Sb level below the regulation limit of 5 μg L−11. In recent years, the zero-valent iron (Fe0) has drawn increasing attention as an effective remediation medium for many contaminants and was considered to be promising and cost-effective. Whereas, the zero-valent iron nanoparticles generally present high agglomeration and lack chemical stablity.12,13
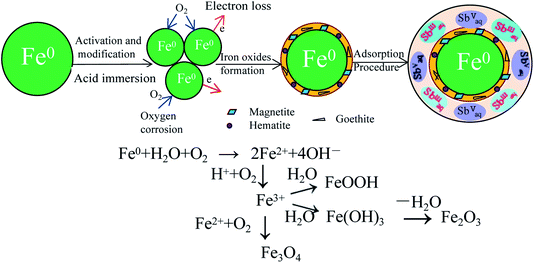
In this research, the granulated zero-valent iron powders were adopted as a new adsorbent and then they were activated and stabilized using acetic acid. The physicochemical characteristics of the modified and activated iron powders were determined by the particle size, XRD and SEM analyses. Additionally, the characteristics of the antimony adsorption process and the antimony removal mechanisms by the granular adsorbent were determined using a combination of XRD, XPS and FT-IR observations and the probable schematic process diagram for the adsorption process was developed.
2 Materials and methods
2.1 Materials
All the chemical regents used in this study were of analytical grade and were purchased from Sinopharm Chemical Reagent Beijing Co., Ltd., and used without further purification. All the solutions used were prepared using deionized water. The weighed K2H2Sb2O7·4H2O was dissolved in 1 L of deionized water to prepare the Sb(V)-containing solution and Sb2O3(III) was dissolved using 2.0 mol L−1 HCl. It should be noted that Sb(III) in all figures in this paper represents uncomplexed-Sb(III) for simplification.2.2 Sample preparation and characterization
The iron powders adopted in the experiments were obtained from the pharmaceutical group, China. The stainless-steel balls were used as the ball grinding medium. After grinding for two hours, the sample was collected and the particle size change was determined. Then, the ground iron powders were immersed in acetic acid solution with a pH of 5.0 and mixed for 24 hours at a speed of 160 rpm. After filtration using a 0.45 μm membrane, the immersed iron powders were collected and dried in a vacuum drying oven and characterized, and were then ready for the following batch experiments.2.3 Batch adsorption experiments
2.4 Analytical methods
The residual Sb(III) or Sb(V) concentrations in the solutions were determined by ICP-AES (VG PQ ExCell, Thermo Electron Corporation). The pH of the solutions was measured using a pH meter (PHS-3B, Jingke, Shanghai, China). The X-ray diffraction patterns of the material were recorded using an X-ray diffractometer (D8 Discover, Bruker) with Cu Kα radiation (40 kV, 40 mA). The SEM, and FT-IR analyses were completed using scanning electron microscopy (Tecnai G2, FEI), and the Fourier-Transform Infrared Spectrometry (Nicolet iS10, Nicolet), respectively. The X-ray photoelectron spectroscopy (XPS) spectra were obtained with an XPS analyzer (ESCALAB250Xi, ThermoFisher) with an Al Kα X-ray source (power: 200 W).3 Results and discussion
3.1 Material characterization
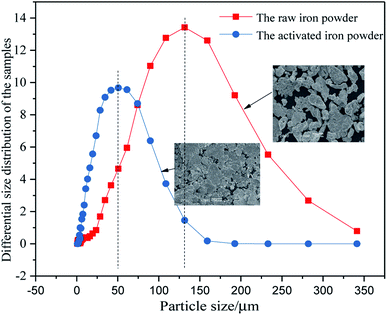
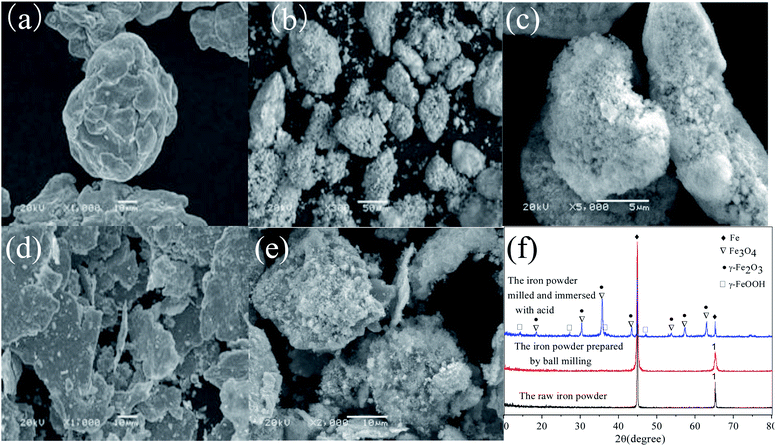
The differential particle size distribution of the raw and the ground iron powders are presented in Fig. 1. The average particle size was reduced from about −105 μm to −50 μm after the raw iron powders were milled. As Fig. 1 shows, the largest particle size between 108.61 μm and 131.47 μm was obtained for 13.42% of the total particles before ball-milling treatment. Accordingly, the largest size between 41.84 μm and 50.64 μm was obtained for 9.67% of the total particles after ball-milling treatment. The ground iron powders were immersed in the acetic acid solution with pH of 5.0 and mixed for 24 hours. The iron powders with a smaller particle size possessed a more active physical chemistry, which led to the faster formation of the corrosion layer. Then, the immersed iron powders were dried in a vacuum drying oven and characterized. The results are presented in Fig. 2. The surface of the activated and modified iron powders became rough, as shown in Fig. 2(b) and (d), when compared with Fig. 2(a), which implied that new phases had been obtained. The ground iron powders are presented in Fig. 2(d) and the corrosive ground iron powders are shown in Fig. 2(e). The X-ray diffraction analysis of the samples in Fig. 2(f) showed that the diffraction peaks of Fe3O4, γ-Fe2O3 and γ-FeOOH appeared, which implied that the physicochemical property of the treated iron powder had changed greatly.3.2 Adsorption isotherm
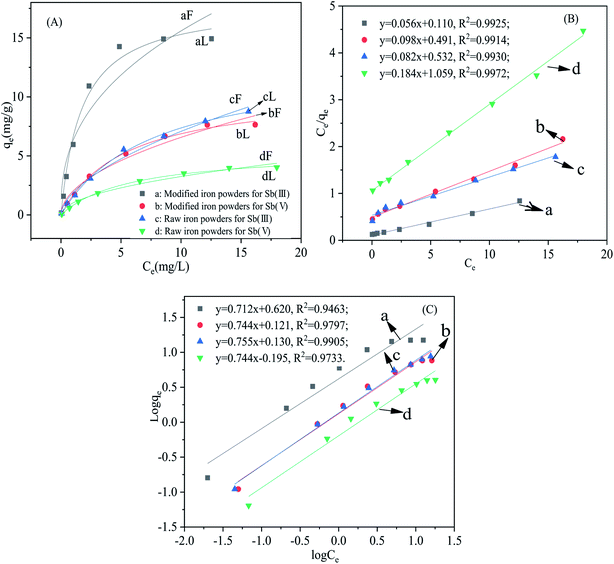
The relationship between the equilibrium concentration of Sb(III) and Sb(V) in the solution and the loading on the adsorbents is presented in Fig. 3(A). The experimental data fitted was based on the Langmuir and the Freundlich models. The linearized forms of the Langmuir and Freundlich equations of Ce/qe ∼ Ce and log![[thin space (1/6-em)]](https://www.rsc.org/images/entities/char_2009.gif) qe ∼ log
qe ∼ log![[thin space (1/6-em)]](https://www.rsc.org/images/entities/char_2009.gif) Ce are shown in Fig. 3(B) and (C), respectively. The Langmuir isotherm model is described according to the following expression:
Ce are shown in Fig. 3(B) and (C), respectively. The Langmuir isotherm model is described according to the following expression: | (1) |
The nonlinear Langmuir isotherm expression can be converted into the following linear model:
 | (2) |
The Freundlich isotherm model is an empirical equation used to express adsorption on a heterogeneous surface; the nonlinear and linear expressions are shown in eqn (3) and (4), respectively:
| qe = KFCe1/n | (3) |
 | (4) |
The adsorption isotherms for Sb(III) and Sb(V) and the fitting results are presented in Fig. 3. The related parameters of the adsorption process and maximum adsorption capacity were estimated according to the fitted linear equations of the Langmuir and Freundlich model and are presented in the Table 1. Just as the Table 1 showed, the correlation coefficients for the Langmuir model (0.9871 < R2 < 0.9978) were higher than the correlation coefficients for the Freundlich model (0.9184 < R2 < 0.9873). The correlation coefficients for all the adsorption cases revealed that the Langmuir model fitted the adsorption of Sb(III) and Sb(V) better than the Freundlich model based on the higher correlation coefficients. The Langmuir model is based on the theory of monolayer adsorption on a uniform surface and the adsorption ability of the adsorption sites is uniform.2,14
| Material type | Equation | Langmuir | Freundlich (qe = KFCe1/n) | ||||
|---|---|---|---|---|---|---|---|
| Parameter | q m (mg g−1) | K L (L mg−1) | R 2 | K F (mg g−1) | n | R 2 | |
| The modified iron powders | Sb(III) | 17.96 | 0.57 | 0.9871 | 6.27 | 2.53 | 0.9184 |
| The modified iron powders | Sb(V) | 10.58 | 0.18 | 0.9960 | 2.01 | 1.92 | 0.9731 |
| The raw iron powders | Sb(III) | 12.93 | 0.13 | 0.9981 | 1.87 | 1.73 | 0.9873 |
| The raw iron powders | Sb(V) | 5.47 | 0.17 | 0.9978 | 1.01 | 1.98 | 0.9782 |
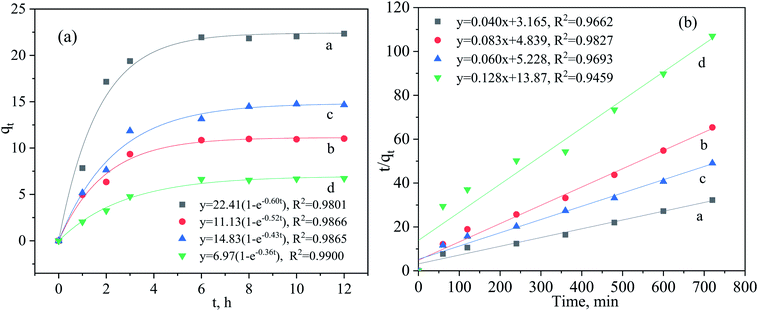
The uptake of the adsorbate only happens on the surface of the adsorbent. The maximum adsorption capacities of the modified iron powders for Sb(III) and Sb(V) were 17.96 mg g−1 and 10.58 mg g−1, respectively, which was greatly elevated compared with adsorption of the raw iron powders. However, the adsorption capacities for Sb(III) and Sb(V) were still below the values reported in the previous reports.2,14 The lower maximum adsorption capacity was because the iron oxides just occurred on the surface of the iron powders, but the completely synthesized iron oxides were adopted in the study. The value of Ka of the modified iron powders for Sb(III) was higher than that for Sb(V), which implied that there was a larger affinity for Sb(III) than Sb(V) on the adsorbent. Although the correlation coefficient for the Freundlich model was smaller than that of the Langmuir model, the value of KF for the adsorption process using the modified iron powders was higher than that of the raw material, which showed a higher adsorption and bonding affinity.14,15
3.3 Adsorption kinetics
Based on the previous experiments, it was clear that the adsorption capacity of the modified iron powders increased dramatically compared with the raw iron powders. Moreover, the adsorption kinetics were always used to assess the adsorption efficiency of Sb(III) and Sb(V) by the raw and the modified iron powders. In this study, the pseudo-first-order kinetic model, the pseudo-second-order kinetic model and the intraparticle diffusion were used to complete the relative calculation.2,16The non-linear pseudo-first-order kinetic model is expressed as follows:
 | (5) |
The above non-linear expression can be converted into the following linear form:
 | (6) |
The pseudo-second-order kinetic model is expressed as follows:
 | (7) |
The corresponding linear form is as follows:
 | (8) |
The effect of the reaction time on the adsorption capacity (qt) of Sb(III) and Sb(V) at time t by the modified and the raw iron powders are presented in Fig. 4. The non-linear pseudo-first-order kinetic model and the linear pseudo-second-order kinetic model were adopted to fit the adsorption data.4,9 According to the results shown in Fig. 4(a), the uptake of Sb on the adsorbents increased greatly in the first two hours, which was always attributed to the adsorption by the high affinity sites or the precipitation of adsorbate on the surface of the adsorbent. About 85% uptake of Sb(III) on the adsorbent occurred in the first three hours and in the following stage, intraparticle diffusion may dominate the adsorption process and the adsorption reached equilibrium after reaction for 6 h. As shown in Table 2, the calculated qe, resulting from the pseudo-first-order kinetic model, was approximately equal to that from the Langmuir isotherm model and the reaction process was monolayer adsorption and was controlled by the chemical reaction, which was also demonstrated by the results of the XPS and FT-IR analyses. Although the maximum adsorption capacities of the modified iron powders for Sb(III) and Sb(V) obtained in this study were relatively lower than those for the pure α-FeOOH, α-Fe2O3 and metal doped Fe3O4,9,14 the adsorbent (the modified iron powders) in present study can be easily obtained and the method is financially feasible, which could be the greatest advantage of using this material.
| Material type | Pseudo-first-order kinetic model | Pseudo-second-order kinetic model | ||||
|---|---|---|---|---|---|---|
| k 1 (h−1) | q e (mg g−1) | R 2 | k 2 (g mg min−1) | q e (mg g−1) | R 2 | |
| Modified iron powders for Sb(III) | 0.60 | 22.41 | 0.9801 | 0.51 × 10⁻³ | 25.00 | 0.9662 |
| Modified iron powders for Sb(V) | 0.52 | 11.13 | 0.9866 | 1.42 × 10⁻³ | 12.05 | 0.9827 |
| Raw iron powders for Sb(III) | 0.43 | 14.83 | 0.9865 | 0.69 × 10⁻³ | 16.67 | 0.9693 |
| Raw iron powders for Sb(V) | 0.36 | 6.97 | 0.9900 | 1.18 × 10⁻³ | 7.81 | 0.9459 |
3.4 Effect of pH on the adsorption process
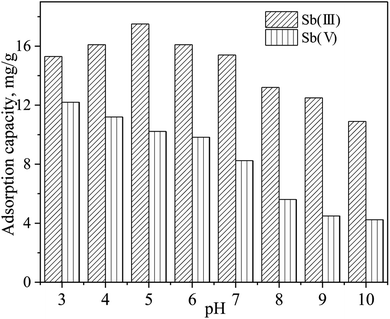
The effects of the initial solution pH (from 3 to 10) on the removal of Sb(III) and Sb(V) by the modified iron powders were determined and the results are presented in Fig. 5. According to the results in Fig. 5, the adsorption capacity was reduced from 15.3 mg g−1 to 10.9 mg g−1 for Sb(III) and from 12.2 mg g−1 to 4.24 mg g−1 for Sb(V). The initial solution pH affected the removal of Sb(III) slightly. However, the adsorption capacity of Sb(V) decreased greatly with the increase of pH from 3 to 10. Results in previous reports showed that the adsorption process of Sb(III) by hydroxyapatite (at pHs between 5 and 10) and by goethite (at pHs between 2 and 12) was not greatly influenced by the initial solution pH.13,17 The adsorption behavior can also be explained by the values of the points of zero charge. As previously reported, the zero charge of γ-Fe2O3, γ-FeOOH and Fe3O4 were 8.6, 7.3 and 4.5, respectively.2,16 Below the value of the zero charge, the surface of the iron oxides can be protonated according to the reaction:![[triple bond, length as m-dash]](https://www.rsc.org/images/entities/char_e002.gif) FeOH + H+ ↔
FeOH + H+ ↔ ![[triple bond, length as m-dash]](https://www.rsc.org/images/entities/char_e002.gif) Fe–OH2+; the protonated form can also promote electrostatic adsorption of Sb anionic species (H2SbO3−, Sb(OH)4−, H2SbO4−, Sb(OH)6−).10 However, above the value of the zero charge, the surface of the iron oxides on the corrosion layer could be coated with negative groups, which decreased the adsorption by the repulsive electrostatic forces according to the reaction:
Fe–OH2+; the protonated form can also promote electrostatic adsorption of Sb anionic species (H2SbO3−, Sb(OH)4−, H2SbO4−, Sb(OH)6−).10 However, above the value of the zero charge, the surface of the iron oxides on the corrosion layer could be coated with negative groups, which decreased the adsorption by the repulsive electrostatic forces according to the reaction: ![[triple bond, length as m-dash]](https://www.rsc.org/images/entities/char_e002.gif) FeOH ↔
FeOH ↔ ![[triple bond, length as m-dash]](https://www.rsc.org/images/entities/char_e002.gif) Fe–O−+ H+; such adsorption behavior was also detected by previous researchers.10,18 The Sb(III) mainly exists as H3SbO3 and Sb(OH)3 at pHs between 2.0 and 10.4 and as H2SbO3− and Sb(OH)4− at pHs above 10.4. Meanwhile, Sb(V) mainly exists as H2SbO4− and Sb(OH)6− when the pH is above 2.7.7 The more negatively charged surfaces increased the repulsive forces and inhibited the adsorption of the anionic H2SbO3− and Sb(OH)4−. The decreased adsorption capacity might be attributed to the electrostatic repulsion.
Fe–O−+ H+; such adsorption behavior was also detected by previous researchers.10,18 The Sb(III) mainly exists as H3SbO3 and Sb(OH)3 at pHs between 2.0 and 10.4 and as H2SbO3− and Sb(OH)4− at pHs above 10.4. Meanwhile, Sb(V) mainly exists as H2SbO4− and Sb(OH)6− when the pH is above 2.7.7 The more negatively charged surfaces increased the repulsive forces and inhibited the adsorption of the anionic H2SbO3− and Sb(OH)4−. The decreased adsorption capacity might be attributed to the electrostatic repulsion.
3.5 Application of the modified for adsorption of low-level antimony
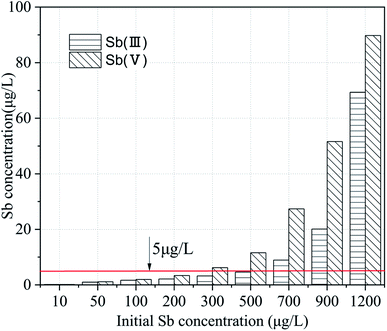
The Zijiang river basin lies in the Hunan province, China and provides drinking water to the people in the cities along the river basin. The Lengshuijiang city called ‘the Antimony City of the world’ is just located in the upper reaches of the Zijiang river and produces more than 30% of the total antimony production in the world. The concentration of antimony in the river water was between 11 and 14 μg L−1 on sunny days and was always more than 10 times the concentration on rainy days, which resulted from the rain washing the antimony down the river. The concentration of antimony during the monitoring period exceeded the concentration 5 μg L−1 specified in the specification of the “Standards for drinking water quality” (GB5749-2015) of China. The application of the modified iron powders was used for the advanced treatment to remove the antimony from the drinking water. A simulated raw water with different initial antimony concentrations was prepared and the atomic fluorescence spectrometry mothed was adopted to determine the low-level antimony concentration. The treatment results are presented in Fig. 6. The modified iron powders can reduce the antimony concentration to below 5 μg L−1 when the Sb(III) and Sb(V) was no more than 500 μg L−1 and 300 μg L−1, respectively, which implied that the modified iron powders can be used for the treatment of drinking water with a low-level antimony content. Previous researchers used iron-based oxy-hydroxides as adsorbents to treat groundwater containing Sb to meet the requirements of the drinking water regulations. The higher efficiency of the validated FeOOH was confirmed by rapid small-scale column tests, because an adsorption capacity of 3 mg Sb(III) g−1 was determined at a breakthrough concentration of 5 μg L−1. However, it completely failed to achieve Sb(V) concentrations below 5 μg L−1 even at the beginning of the column experiments.11 In view of this, the researchers developed a new amorphous Fe3O4/FeOOH nanocomposite to treat drinking water containing Sb(V). The addition of the reducing agent such as Fe3O4 results in the improvement of the Sb(V) uptake capacity and the intermediate reduction of Sb(V) to Sb(III) followed by Sb(III) adsorption onto the FeOOH is the possible mechanism which explains the experimental findings.19 Compared with the synthesized iron oxide based adsorbents, the preparation of the adsorptive material in the present study has a cost advantage.3.6 Adsorption mechanism
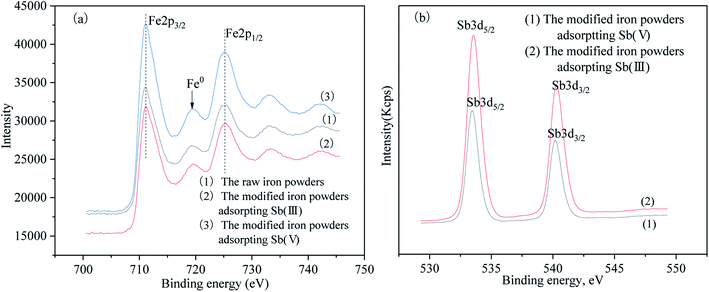
The Sb 3d3/2 peaks were found at the 540.19 eV, which appeared in both the modified iron powders after the adsorption of Sb(III) and Sb(V).13 According to results in Table 3, the surface contents of Sb(III) and Sb(V) were 6.6% and 4.49%, respectively. Because of the similar binding energies, the Sb(III) and Sb(V) oxidation states cannot be distinguished. Furthermore, the combination of Sb(III) and Sb(V) adsorbed on the surface of the iron oxides cannot be distinguished because of the lack of reported binding energy references in the literature to correlate this. Nevertheless, the Sb 3d3/2 binding energy peaks demonstrated that Sb(III) and Sb(V) in the solution were both chemically adsorbed onto the surface of the modified iron powders. Moreover, the intensity of the Sb 3d3/2 peak for the modified iron powder adsorbed Sb(III) was stronger than the powders which adsorbed Sb(V), which was in agreement with the higher binding affinity of Sb(III) to the iron oxides on the surface of the modified iron powders than Sb(V) and was consistent with the experimental results of the adsorption isotherm.9,13
| Name | Start BE | Peak BE | End BE | Height (CPS) | FWHM (eV) | Area (P) (CPS.eV) | Area (N) | Atomic% |
|---|---|---|---|---|---|---|---|---|
| Fe 2p | 738.29 | 711.09 | 706.19 | 22![[thin space (1/6-em)]](https://www.rsc.org/images/entities/char_2009.gif) 046.07 046.07 |
3.73 | 188![[thin space (1/6-em)]](https://www.rsc.org/images/entities/char_2009.gif) 577.8 577.8 |
0.34 | 23.28 |
| Fe 2p | 737.89 | 711.16 | 706.39 | 14![[thin space (1/6-em)]](https://www.rsc.org/images/entities/char_2009.gif) 555.14 555.14 |
3.58 | 111![[thin space (1/6-em)]](https://www.rsc.org/images/entities/char_2009.gif) 154.1 154.1 |
0.20 | 17.07 |
| Fe 2p | 737.39 | 711.03 | 705.89 | 14![[thin space (1/6-em)]](https://www.rsc.org/images/entities/char_2009.gif) 493.87 493.87 |
3.44 | 100![[thin space (1/6-em)]](https://www.rsc.org/images/entities/char_2009.gif) 607.4 607.4 |
0.18 | 13.29 |
| Sb 3d | 550.01 | 540.19 | 537.71 | 47![[thin space (1/6-em)]](https://www.rsc.org/images/entities/char_2009.gif) 719.02 719.02 |
1.26 | 115![[thin space (1/6-em)]](https://www.rsc.org/images/entities/char_2009.gif) 451.3 451.3 |
0.10 | 6.6 |
| Sb 3d | 549.61 | 540.08 | 537.71 | 28![[thin space (1/6-em)]](https://www.rsc.org/images/entities/char_2009.gif) 863.87 863.87 |
1.12 | 63![[thin space (1/6-em)]](https://www.rsc.org/images/entities/char_2009.gif) 074.44 074.44 |
0.05 | 4.49 |
4 Conclusions
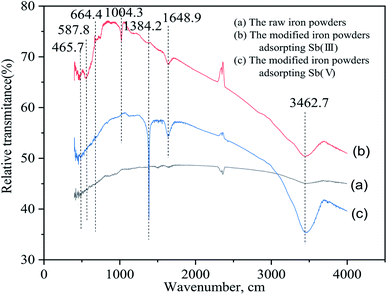
In summary, an adsorbent was obtained using zero-valent iron powders by ball-milling and acid modification. Such iron oxides as Fe3O4, γ-Fe2O3 and γ-FeOOH were obtained in the corrosion layer on the surface of the zero-valent iron powders. The modified iron powders were adopted to remove Sb(III) and Sb(V) in solution. The study showed that the experimental data fitted the Langmuir model and the pseudo-first-order kinetic model better and the adsorption process was monolayer and chemically controlled at pH 5.0 ± 0.2. The XPS and FT-IR analysis showed that the O–Sb bond arose during the adsorption process. The schematic process diagram was completed to show the probable mechanism. The ball-milling and acid modification increased the adsorption capacity for Sb(III) and Sb(V) from 12.93 mg g−1 and 5.47 mg g−1 to 17.96 mg g−1 and 10.58 mg g−1, respectively. Although the adsorption capacities were relatively lower than those reported for pure iron oxides, the material availability contributed to the benefits of its application.Conflicts of interest
There are no conflicts to declare.Acknowledgements
This work was financially supported by the Natural Science Foundation of Hunan Province (2017JJ2020), the Outstanding Youth Project of the Department of Education of Hunan Province (16B049), the Science and Technology Projects of Yiyang (2015JZ26), the Science and Technology Program of Education Department of Hunan Province (16C0303) and the Science and Technology Program of Education Department of Hunan Province (18C0840).Notes and references
- C. Shan, Z. Ma and M. Tong, J. Hazard. Mater., 2014, 268, 229–236 CrossRef CAS
.
- J. Xi, M. He, K. Wang and G. Zhang, J. Geochem. Explor., 2013, 132, 201–208 CrossRef CAS
.
- J. Li, B. Zheng, Y. He, Y. Zhou, X. Chen, S. Ruan, Y. Yang, C. Dai and L. Tang, Ecotoxicol. Environ. Saf., 2018, 156, 125–134 CrossRef CAS
.
- X. Li, X. Dou and J. Li, J. Environ. Sci., 2012, 24, 1197–1203 CrossRef CAS
.
- J. Xi, M. He and C. Lin, Microchem. J., 2011, 97, 85–91 CrossRef CAS
.
- V. J. Ritchie, A. G. Ilgen, S. H. Mueller, T. P. Trainor and R. J. Goldfarb, Chem. Geol., 2013, 335, 172–188 CrossRef CAS
.
- X. Y. Guo, Y. T. Xin, H. Wang and Q. H. Tian, Trans. Nonferrous Met. Soc. China, 2015, 25, 4175–4182 CrossRef
.
- G. Ungureanu, S. Santos, B. Rui and C. Botelho, J. Environ. Manage., 2015, 151, 326–342 CrossRef CAS
.
- Z. Qi, T. P. Joshi, R. Liu, H. Liu and J. Qu, J. Hazard. Mater., 2017, 329, 193–204 CrossRef CAS
.
- R. Liu, W. Xu, Z. He, H. Lan, H. Liu, J. Qu and T. Prasai, Chemosphere, 2015, 138, 616–624 CrossRef CAS
.
- K. Simeonidis, V. Papadopoulou, S. Tresintsi, E. Kokkinos, I. A. Katsoyiannis, A. I. Zouboulis and M. Mitrakas, Sustainability, 2017, 9, 238–249 CrossRef
.
- P. Fan, Y. Sun, J. Qiao, I. Lo and X. Guan, J. Hazard. Mater., 2017, 343, 266–275 CrossRef PubMed
.
- X. Zhao, X. Dou, M. Dinesh, P. U. Charles, S. O. Yong and J. Xin, Chem. Eng. J., 2014, 247, 250–257 CrossRef CAS
.
- X. Guo, Z. Wu, M. He, X. Meng, X. Jin, N. Qiu and J. Zhang, J. Hazard. Mater., 2014, 276, 339–345 CrossRef CAS
.
- F. Kolbe, H. Weiss, P. Morgenstern, R. Wennrich, W. Lorenz, K. Schurk, H. Stanjek and B. Daus, J. Colloid Interface Sci., 2011, 357, 460–465 CrossRef CAS
.
- Z. Lan, J. Wei, Z. Xuan, F. Li and J. Feng, Chem. Eng. J., 2015, 277, 378–387 CrossRef
.
- X. Wang, M. He, C. Lin, Y. Gao and Z. Lei, Geochemistry, 2012, 72, 41–47 CrossRef CAS
.
- B. J. Lafferty, M. Gindervogel, M. Zhu, K. J. T. Livi and D. L. Sparks, Environ. Sci. Technol., 2010, 44, 8467–8472 CrossRef CAS
.
- K. Simeonidis, K. Kalaitzidou, E. Kaprara, G. Mitraka, T. Asimakidou, L. Balcells and M. Mitrakas, Water, 2019, 11 Search PubMed
.
- Z. Qi, T. P. Joshi, R. Liu, Y. Li, H. Liu and J. Qu, J. Hazard. Mater., 2017, 343, 36 CrossRef
.
- L. R. Braga, A. A. Rosa and A. C. B. Dias, Anal. Methods, 2014, 6, 4029 RSC
.
| This journal is © The Royal Society of Chemistry 2019 |

