 Open Access Article
Creative Commons Attribution 3.0 Unported Licence
A Cu2+-doped two-dimensional material-based heterojunction photoelectrode: application for highly sensitive photoelectrochemical detection of hydrogen sulfide
Siyuan Yuab,
Xia Chenb,
Chaobiao Huang *a and
Deman Han
 *b
*b
aCollege of Chemistry and Life Sciences, Zhejiang Normal University, Jinhua 321004, China. E-mail: hcb@zjnu.cn
bDepartment of Chemistry, Taizhou University, Jiaojiang, 318000, China. E-mail: hdmtzc@126.com
First published on 9th September 2019
Abstract
In this work, on the basis of a Cu2+-doped two-dimensional material-based heterojunction photoelectrode, a novel anodic photoelectrochemical (PEC) sensing platform was constructed for highly sensitive detection of endogenous H2S. Briefly, with g-C3N4 and TiO2 as representative materials, the sensor was fabricated by modifying g-C3N4/TiO2 nanorod arrays (NAs) onto the surface of fluorine-doped tin oxide (FTO) and then doping Cu2+ as a CuxS (x = 1, 2) precursor. After the binding of S2− with surface-attached Cu2+, the signal was quenched owing to the in situ generation of CuxS which offers trapping sites to hinder generation of photocurrent signals. Since the photocurrent inhibition was intimately associated with the concentration of S2−, a highly sensitive PEC biosensor was fabricated for H2S detection. More importantly, the proposed sensing platform showed the enormous potential of g-C3N4/TiO2 NAs for further development of PEC bioanalysis, which may serve as a common basis for other semiconductor applications and stimulates the exploration of numerous high-performance nanocomposites.
1. Introduction
Since hydrogen sulfide (H2S) was found to be the third endogenously generated gaseous signaling molecule following nitric oxide and carbon monoxide with cytoprotective properties, great attention has been drawn in the field of clinical diagnostics.1–4 In addition, H2S has also been known to play a crucial role in a series of physiological processes, including antioxidation,5 anti-inflammation6 and apoptosis.7 On the other hand, when the release concentration of H2S in the atmosphere is greater than the olfactory perception threshold of 300 ppb, it will harm human health and induce nausea, headaches, and lung irritation.8 Even chronic, low-level exposures can also lead to irreversible health effects.9,10 From this point of view, there is an essential demand to develop a reliable and high-performance approach for H2S monitoring.Photoelectrochemical bioanalysis represents an elegant route for highly sensitive detection and exhibits versatile advantages of decreased costs, simple sample preparation, high sensitivity and selectivity,11–18 which has inspired the rapid development of this field in recent years. Previously, many PEC analytical methods have been exploited for H2S detection.19–24 The most common strategy is in situ generated CdS on the surface of TiO2 to enhance the photocurrent response.20–24 But the strategy of in situ sensitization via CdS has its own limitations on only fitting for the PEC substrates with low photoelectrical activity. And to the best of our knowledge, few works had been conducted for H2S detection with the strategy of in situ quenching.
2D materials have been among the most important research hotspots in the past years for their superlative physical properties and manifold implications in various fields. These materials consist of atomically thin sheets with large specific surface area exhibiting covalent in-plane bonding and weak interlayer and layer–substrate bonding. Besides, 2D materials can not only display improved inherent properties of the bulk materials but also give birth to new properties that the corresponding bulk materials do not possess.25–27 On the other hand, in pursuit of achieving better semiconducting performances, heterostructures comprised by different semiconductors are being considered as favorite schemes as compared to the pure ones. It is believed that such a structure could integrate different properties of the individual semiconductors and thus generate enhanced properties.28–32 Hence, of particular interest here is the possibility of utilizing ingenious 2D material-based heterojunction for innovative PEC detection of S2−. We hypothesize that such a PEC platform possesses great potential in improving performance of PEC detection of S2−. If possible, the great enhancement of light-harvesting efficiency is benefiting from the feature of 2D material with large surface area, meanwhile, heterojunction is taken fully advantages of the contribution to the photoinduced charge separation in both the semiconductors and inhibition of the charge recombination, resulting in the improvement in photocurrent generation.33,34
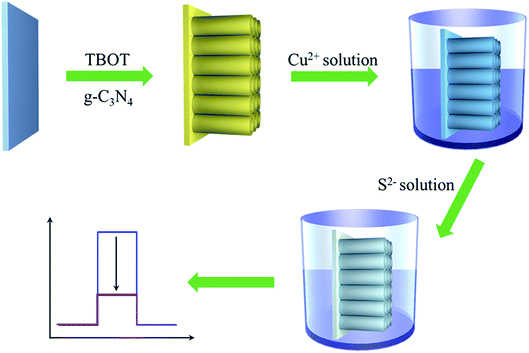
To verify this hypothesis, with g-C3N4 and TiO2 as representative materials, herein, we put forward a novel and general PEC sensing platform for highly sensitive detection of H2S through modifying FTO substrate with Cu2+-doped g-C3N4/TiO2 NAs (Scheme 1). In this work, different from the previous strategies for PEC sensors of H2S, the obvious photocurrent quenching is appeared upon exposure to S2−, owing to in situ formed CuxS (x = 1, 2) has a much lower conduction band edge than g-C3N4 and offers plentiful surface recombination centers.35,36 Thereby, in the presence of S2−, the photocurrent intensity is expected to have an evident slip and by monitoring the reduction of photocurrent, we could quantitatively determine the concentration of S2−.
2. Experimental
2.1 Materials and reagents
Fluorine-doped tin oxide (FTO) glass substrate with a thickness of 1.1 mm (sheet resistance ≤ 15 Ω per square) was ordered from South China Science & Technology Co. Ltd. Urea (CO(NH2)2), tetrabutyl titanate (C16H36O4Ti), hydrochloric acid (HCl), acetone (C3H6O), anhydrous ethanol (C2H5OH), copper sulfate (CuSO4) and triethanolamine (TEOA) were all purchased from Sinopharm Chemical Reagent Co. Ltd. All other reagents were of analytical grade and used as received. Additionally, all aqueous solutions were prepared with deionized water (DI water, 18 MΩ cm−1), which was obtained from a MilliQ water purification system.2.2 Synthesis of g-C3N4 nanosheets
10.0 g of urea was put into an alumina crucible with a cover, heated with a ramp rate of 10 °C min to 550 °C in air atmosphere in a muffle furnace, and maintained for 4 h. Afterward, the resulting pale yellow agglomerate was milled into powder by a mortar and the g-C3N4 nanosheets were obtained by liquid exfoliation of the bulk g-C3N4 powder in water. Briefly, the bulk g-C3N4 powder was dispersed into 100 mL of distilled water and ultrasonicated for 2 h. The residual unexfoliated bulk g-C3N4 was removed by centrifugation at 4500g. Subsequently, the supernatant was further centrifuged at 8000g, and the obtained precipitation was dried at 70 °C in a oven.2.3 Preparation of the biosensor
The g-C3N4/TiO2/FTO was first prepared as follows using a one-step hydrothermal method. First, 10 mg of as-prepared g-C3N4 powder was homogeneously dispersed in 6 mL of ultrapure water via sonication, and the obtained suspension was mixed with equal volume of concentrated hydrochloric acid. After 5 min stirring, 200 μL of tetrabutyl titanate (TBOT) was added into the above suspension and stirred for 30 min. Then the above mixture was transferred into a Teflon-lined stainless steel autoclave. Subsequently, pieces of cleaned FTO substrate were placed against the wall of the autoclave with conductive sides facing down. The autoclave was kept in an oven at 150 °C for 10 h and then allowed to cool down to room temperature. Finally, the FTO substrates were removed, rinsed with ultrapure water, put into a muffle furnace and annealed at 450 °C for 1 h to form TiO2/g-C3N4 NAs on the FTO substrate surface. To prepare CuxS precursor, the obtained g-C3N4/TiO2/FTO was immersed into 1.0 mM CuSO4 solution with 1 h gently shaking to dope Cu2+ on electrode surface.2.4 PEC measurement
The as-prepared PEC sensing platform was exposed to different concentration of Na2S solution (H2S in the aqueous medium) for 10 min. Followed by washing with ultrapure water thoroughly to remove excess S2−. After that, the resulted substrate was transferred into the PEC detection cell for photocurrent measurement.3. Results and discussion
3.1 Materials characterization
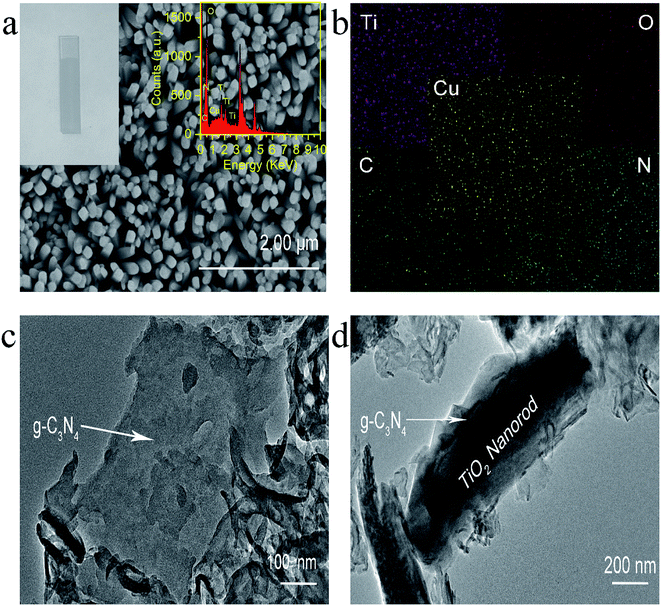
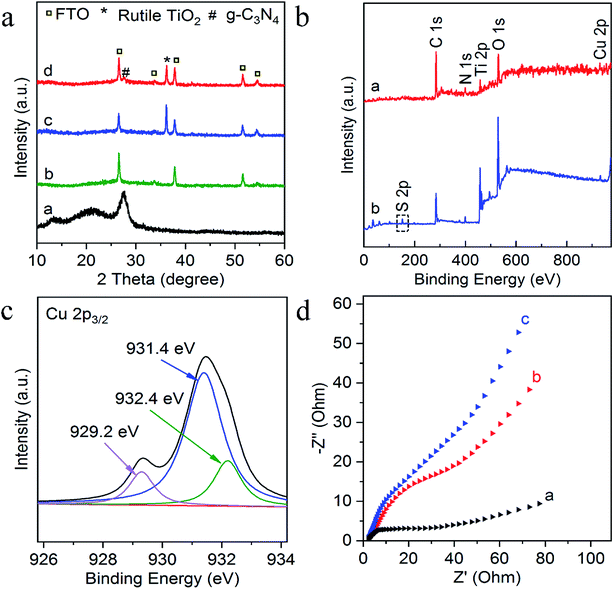
Experimentally, g-C3N4 and g-C3N4/TiO2/FTO were prepared through a thermo-polymerization method32 and a modified hydrothermal method according to a previous report.37 The structural and morphology information of the as-prepared g-C3N4/TiO2 NAs were characterized by scanning electron microscopy (SEM), transmission electron microscopy (TEM). As exhibited in Fig. 1a, Cu2+-doped g-C3N4/TiO2 NAs were vertically grown on the surface of FTO and g-C3N4 could not distinctly tell via SEM. As indicated in the left inset of Fig. 1a, white g-C3N4/TiO2 film shows the great affinity to FTO. As shown in the right inset of Fig. 1a, the energy dispersive X-ray spectrum (EDX) of Cu2+-doped g-C3N4/TiO2/FTO distinctly verify the existence of Ti, O, C, N and Cu elements. The strong peaks for O and Ti elements were found in the spectrum, due to its abundant amount in the composites. Moreover, the presence of Cu in the spectrum revealed that the doping was successful. Fig. 1b of elemental mapping also indicates a uniform distribution of Ti, O, C, N and Cu elements in the sample. Through the TEM image, a typical planar sheet-like the exfoliated g-C3N4 sample with an irregular shape was displayed in Fig. 1c. In addition, Fig. 1d indicates TiO2 NRs was fully wrapped by g-C3N4 and the existence of a very close and distinguishable g-C3N4/TiO2 interface, revealing the moderate interfacial contact and successful synthesis of g-C3N4/TiO2 nanohybrid.The composition and crystal-phase properties of g-C3N4/TiO2/FTO was identified by X-ray diffraction (XRD). As Fig. 2a displayed, two diffraction peaks (curve a) of pristine g-C3N4 sample at 27.5° and 13.1° corresponds to the (002) and (100) crystal planes, respectively, of graphite-like hexagonal g-C3N4 (JCPDS no. 87-1526). Diffraction peaks of the bare FTO are clearly shown in curve b. Additionally, the feature peaks of TiO2 NAs on FTO at 36.1° (curve c) can be exactly indexed to (101) crystal planes of the well-crystallized rutile phase (JCPDS no. 21-1276). No peaks corresponding to the (110), (111), and (211) crystal planes of the rutile phase were not observed, indicating the growth of TiO2 on FTO substrates with high orientation selectivity. No other impurity peaks were detected. As for the g-C3N4/TiO2/FTO (curve d), the feature diffraction at 27.5° could properly match the (002) plane of g-C3N4 (curve a), implying that g-C3N4 was successfully modified on the surface of TiO2 nanorods. Then as illustrated in Fig. 2b, X-ray photoelectron spectroscopy (XPS) was applied to study the surface chemical compositions and oxidation states of Cu2+-doped g-C3N4/TiO2/FTO before (curve a) and after (curve b) reaction with S2−. Curve a verifies the presence of C, N, Ti, O and Cu peaks and a new characteristic peak of S 2p emerged, suggesting the presence of sulfur element on the electrode. Fig. 2c reveals the high-resolution XPS spectrum of Cu 2p3/2, which could be further distributed into three parts located at 932.4, 931.4, and 929.2 eV. As reported in the previous work,38 the main peak at 931.4 eV of Cu+ was produced from the interaction between superficial Cu2+ and S2−, indicating the presence of CuxS (x = 1, 2) on the surface of g-C3N4/TiO2 NAs. Besides, the one weak peak at 932.4 eV was attributed to CuS,39 while the other at 929.2 eV was assigned to the tiny amount of CuO. Combined with above results, CuxS was newly formed on the electrode surface after incubation of S2−. In addition, the electrochemical impedance spectroscopy (EIS) was also employed to analyze the interfacial properties of the modified electrode in 5 mM [Fe(CN)6]4−/3− (as the redox probe) containing 0.1 M KCl. The impedance spectrum includes a semicircular portion at higher frequencies and a linear portion at lower frequencies. The diameter of the semicircle is equal to the electron transfer resistance (Ret). As shown in Fig. 2d, the Ret value of FTO (curve a) was very small, after coating g-C3N4/TiO2 on electrode surface, Ret value increased significantly (curve b), which may be due to the introduction of g-C3N4/TiO2 hindered the electron transfer on the electrode. Then, the Ret value increased after the modified electrode treated with 50 nM S2− (curve c). The reason for the increase in the resistance value were owing to the generation of CuxS which offered the trapping sites with new energy levels and thus suppressed the electron transfer on the surface of the g-C3N4/TiO2/FTO.
3.2 Optimization of experimental conditions
As PEC sensing performance was affected by some factors influencing the photocurrent response like the length of TiO2 NAs and the mass of g-C3N4, the optimal preparation conditions were conducted. The length of TiO2 NAs could be controlled via hydrothermal reaction time. As revealed in Fig. 3a, the photocurrent intensity was increasing with the increased reaction time of TiO2 NAs. However, if reaction time is extended to over 10 h, the white film composed of aligned TiO2 NAs starts to peel off from the FTO substrate during annealing because the length of TiO2 NAs was too long to adhere to the FTO substrate consistently. As a result, 10 h is the optimal reaction time associated with maximal photocurrent intensity of TiO2 NAs. Fig. 3b shows the effects on photocurrent response of g-C3N4/TiO2/FTO prepared with different mass of g-C3N4. It can be told that g-C3N4/TiO2/FTO produced the highest photocurrent with 10.0 mg g-C3N4 added. As the mass grew, g-C3N4 immobilized on TiO2 film gradually increased, thereby leading to wider light absorption range. With more g-C3N4 added, excessive g-C3N4 immobilization occurred on TiO2 film, which offered more surface recombination centers and the resistance to decrease the photocurrent intensity. Thereby, 10.0 mg of g-C3N4 was added into the mixture in subsequent experiments.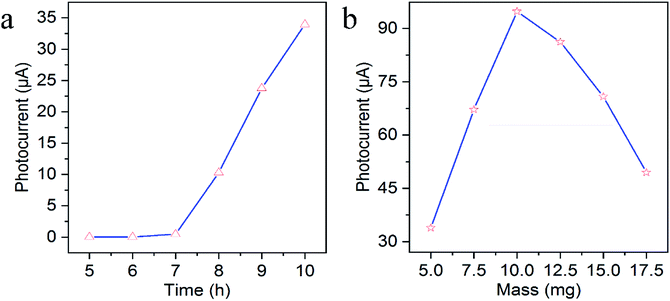 | ||
| Fig. 3 Effects of (a) the hydrothermal reaction time of TiO2 NAs and (b) the mass of g-C3N4 on photocurrent response of g-C3N4/TiO2/FTO. | ||
3.3 Characterization of the PEC biosensor
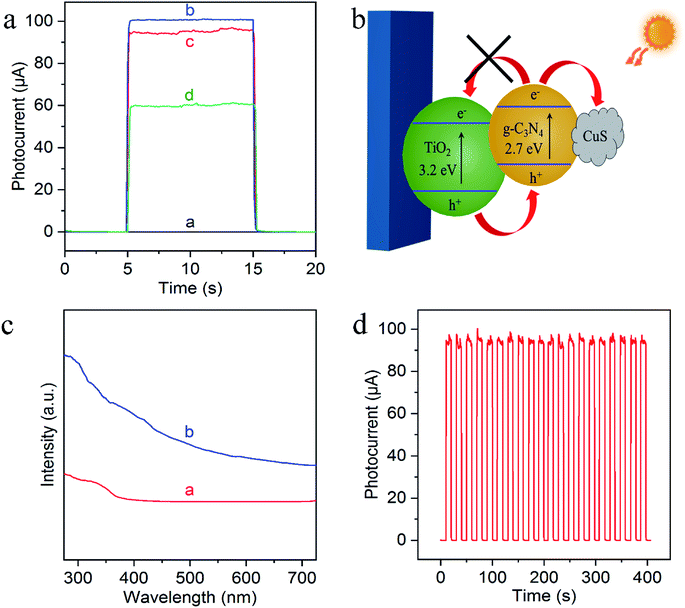
To evaluate the feasibility of the sensing platform, their PEC behaviors were then characterized by chronoamperometric i–t curves from the stepwise transient photocurrent responses upon intermittent light irradiation. As shown in Fig. 4a, the photocurrent of bare FTO is negligible (curve a), while g-C3N4/TiO2 NAs electrode exhibited the significantly strong photocurrent (curve b). Compared with g-C3N4/TiO2/FTO, the photocurrent response of Cu2+-doped g-C3N4/TiO2/FTO appeared a small decrease (curve c) which resulted from the capture of photoelectrons by Cu2+. And as can be seen from curve d, the photocurrent signal of Cu2+-doped g-C3N4/TiO2/FTO with the exposure of the electrode to a 50 nM Na2S solution caused a noticeable quenching, because of the generation of CuxS which offered the trapping sites with new energy levels and thus suppressed the electron transfer on the surface of the g-C3N4/TiO2/FTO, as illustrated in Fig. 4b.40 In addition, the corresponding UV-vis diffuse reflectance spectra were also performed to further confirmed the enhanced absorption after the successful preparation of Cu2+-doped g-C3N4/TiO2/FTO, as shown in Fig. 4c. Fig. 4d indicated the signal response of g-C3N4/TiO2/FTO upon irradiation repeated every 10 s. The irradiation process was repeated over 400 s and no obvious variation could be observed, featuring the high stability of the biosensor. Thereby, all of these results demonstrated the feasible fabrication of the PEC sensing platform.3.4 Analytical performance
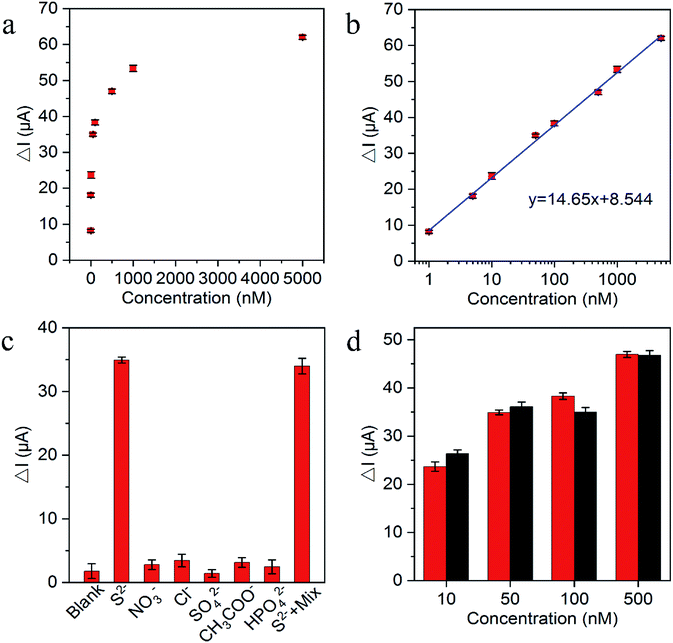
The substantial photocurrent decrement in the presence of trace amounts of the H2S captured in an aqueous medium (for convenience, Na2S was used as the source here) demonstrated the suitability of the fabricated biosensor for S2− and H2S determination. Fig. 5a exhibited the decrement of photocurrent after reaction with various S2− concentrations. Fig. 5b shows the photocurrent decrement linearly increased with the increasing S2− concentrations from 1 × 10⁻⁹ to 5 × 10⁻⁶ M and the lowest detection limit of S2− was estimated at 5.8 × 10⁻¹¹ M (S/N = 3), which was comparable to other H2S PEC sensors in Table 1. As demonstrated in Table 1, different than the common zero-dimensional and one-dimensional material-based heterojunction photoelectrode, g-C3N4/TiO2/FTO as the representative two-dimensional material-based heterojunction photoelectrode truly has the relatively better photoelectric conversion efficiency and perfectly fits for H2S detection with in situ quenching strategy. The reproducibility of the PEC biosensor was assessed on the basis of the relative standard deviation (RSD) for the intra-assay and interassay precision. The intra-assay precision was obtained by parallel measuring S2− five times at concentrations of 10 nM, 50 nM, and 100 nM, which yielded a RSD values of 4.0%, 3.6%, and 5.2%, respectively. The interassay precision was determined by assaying S2− at the same concentration using five sensing electrodes prepared under identical conditions, where the RSD values were 5.8%, 4.6%, and 5.4%, respectively. These results indicated the satisfactory precision and reproducibility of this biosensor. To verify the selectivity of the PEC sensor, the common anions and other species potentially coexisting in the solution, including NO3−, Cl−, SO42−, CH3COO− and HPO42− were selected for interference test. As displayed in Fig. 5c, the photocurrent response to the interfering ions with the addition of 100-fold excess in comparison with S2− were very close to the blank test, because of the interfering ions cannot have the reaction with Cu2+ to in situ generate the substrate insoluble in aqueous solution. Moreover, the photocurrent of the mixture containing S2− was approximately the same as pure S2−, indicating that the coexistence of the S2− with the interfering ions did not have a significant effect on the photocurrent of the sensing platform. Additionally, the long term stability performance of the designed sensing platform was also evaluated. There was no apparent change of the photocurrent response after the biosensor was stored at 4 °C in a refrigerator for over 1 month, and 94.4% of the initial photocurrent response was maintained after storage for over 2 months, suggesting the robustness of the as-designed PEC sensor. For the feasibility of practical application, the performance of the sensing platform was tested in human plasma. Different concentrations of mixed anions were then added. As shown in Fig. 5d, the small signal difference between normal human plasma and Tris–HCl solution samples indicated the precision of the sensing platform and the potential for practical applications.4. Conclusions
In summary, we successfully designed and fabricated a novel and general PEC sensing platform for highly sensitive H2S detection based on Cu2+-doped g-C3N4/TiO2 NAs heterojunction photoelectrode, in situ formed CuxS would open a new pathway for the electron−hole recombination and thus efficiently inhibit the photocurrent generation of the sensing platform. Importantly, the above biosensor was highly sensitive and easy to prepare, manifesting a wide linear response range with S2− detection limit of 58 pM. This study displayed the desirable potential of g-C3N4/TiO2 as the representative 2D material-based heterojunction in improving performance of PEC detection and was expected to inspire more interests in the implementation of numerous other semiconductor applications. Further work will focus on experimental optimization for better performance.Conflicts of interest
There are no conflicts to declare.Acknowledgements
This work was supported by the National Natural Science Foundation of China (No. 21575097) and Public Welfare Projects in Zhejiang Province (LGF19B050002).References
- C. C. Hwang, G. Ruan, L. Wang, H. Zheng, E. L. G. Samuel, C. Xiang, W. Lu, W. Kasper, K. Huang, Z. Peng, Z. Schaefer, A. T. Kan, A. A. Martí, M. S. Wong, M. B. Tomson and J. M. Tour, ACS Appl. Mater. Interfaces, 2014, 6, 7652–7658 CrossRef CAS PubMed.
- C. Liu, J. Pan, S. Li, Y. Zhao, L. Y. Wu, C. E. Berkman, A. R. Whorton and M. Xian, Angew. Chem., Int. Ed., 2011, 50, 10327–10329 CrossRef CAS PubMed.
- Y. Han, J. Qin, X. Chang, Z. Yang and J. Du, Cell. Mol. Neurobiol., 2006, 26, 101–107 CrossRef PubMed.
- J. Flávio da Silveira Petruci, P. R. Fortes, V. Kokoric, A. Wilk, I. M. Raimundo, A. A. Cardoso and B. Mizaikoff, Analyst, 2014, 139, 198–203 RSC.
- J. W. Calvert, S. Jha, S. Gundewar, J. W. Elrod, A. Ramachandran, C. B. Pattillo, C. G. Kevil and D. J. Lefer, Circ. Res., 2009, 105, 365–374 CrossRef CAS PubMed.
- L. Li, M. Bhatia, Y. Z. Zhu, Y. C. Zhu, R. D. Ramnath, Z. J. Wang, F. B. M. Anuar, M. Whiteman, M. Salto-Tellez and P. K. Moore, FASEB J., 2005, 19, 1196–1198 CrossRef CAS PubMed.
- G. Yang, L. Wu and R. Wang, FASEB J., 2006, 20, 553–555 CrossRef CAS.
- J. F. d. S. Petruci and A. A. Cardoso, Anal. Chem., 2016, 88, 11714–11719 CrossRef CAS.
- S. M. Rosolina, T. S. Carpenter and Z. L. Xue, Anal. Chem., 2016, 88, 1553–1558 CrossRef CAS PubMed.
- E. Bitziou, M. B. Joseph, T. L. Read, N. Palmer, T. Mollart, M. E. Newton and J. V. Macpherson, Anal. Chem., 2014, 86, 10834–10840 CrossRef CAS PubMed.
- W. W. Zhao, J. J. Xu and H. Y. Chen, Chem. Soc. Rev., 2015, 44, 729–741 RSC.
- W. W. Tu, Z. Wang and Z. Dai, TrAC, Trends Anal. Chem., 2018, 105, 470–483 CrossRef CAS.
- D. P. Tang and J. Shu, Chem.–Asian J., 2017, 12, 2780–2789 CrossRef.
- W. W. Zhao, X. D. Yu, J. J. Xu and H. Y. Chen, Nanoscale, 2016, 8, 17407 RSC.
- W. W. Zhao, J. J. Xu and H. Y. Chen, Analyst, 2016, 141, 4262–4271 RSC.
- X. Zhang, Y. Guo, M. Liu and S. Zhang, RSC Adv., 2013, 3, 2846–2857 RSC.
- Y. Liu, R. Li, P. Gao, Y. Zhang, H. Ma, J. Yang, B. Du and Q. Wei, Biosens. Bioelectron., 2015, 65, 97–102 CrossRef CAS PubMed.
- B. Fan, Q. Fan, M. Cui, T. Wu, J. Wang, H. Ma and Q. Wei, ACS Appl. Mater. Interfaces, 2019, 11, 24764–24770 CrossRef CAS PubMed.
- H. Li, J. Li, Y. Zhu, W. Xie, R. Shao, X. Yao, A. Gao and Y. Yin, Anal. Chem., 2018, 90, 5496–5502 CrossRef CAS PubMed.
- J. Tang, Y. Zhang, B. Kong, Y. Wang, P. Da, J. Li, A. A. Elzatahry, D. Zhao, X. Gong and G. Zheng, Nano Lett., 2014, 14, 2702–2708 CrossRef CAS PubMed.
- H. Li, Y. Tian, Z. Deng and Y. Liang, Analyst, 2012, 137, 4605–4609 RSC.
- Y. Wang, S. Ge, L. Zhang, J. Yu, M. Yan and J. Huang, Biosens. Bioelectron., 2017, 89, 859–865 CrossRef CAS.
- Y. C. Zhu, Q. Wang, L. B. Zhang, W. W. Zhao, J. J. Xu and H. Y. Chen, ChemElectroChem, 2017, 4, 1011–1015 CrossRef CAS.
- L. Ding, C. Ma, L. Li, L. Zhang and J. Yu, J. Electroanal. Chem., 2016, 783, 176–181 CrossRef CAS.
- J. Di, J. Xiong, H. Li and Z. Liu, Adv. Mater., 2018, 30, 17045–17048 CrossRef.
- X. Zhang and Y. Xie, Chem. Soc. Rev., 2013, 42, 8187–8199 RSC.
- Y. Sun, S. Gao, F. Lei, C. Xiao and Y. Xie, Acc. Chem. Res., 2015, 48, 3–12 CrossRef CAS.
- C. Wang, C. Shao, X. Zhang and Y. Liu, Inorg. Chem., 2009, 48, 7261–7268 CrossRef CAS.
- L. Q. Mai, F. Yang, Y. L. Zhao, X. Xu, L. Xu and Y. Z. Luo, Nat. Commun., 2011, 2, 381 CrossRef.
- X. Y. Jiang, L. Zhang, Y. L. Liu, X. D. Yu, Y. Y. Liang, P. Qu, W. W. Zhao, J. J. Xu and H. Y. Chen, Biosens. Bioelectron., 2018, 107, 230–236 CrossRef CAS.
- M. Hassannezhad, M. Hosseini, M. R. Ganjali and M. Arvande, Anal. Methods, 2019, 11, 2064–2071 RSC.
- M. Jahurul Islam, D. Amaranatha Reddy, N. S. Han, J. Choi, J. K. Song and T. K. Kim, Phys. Chem. Chem. Phys., 2016, 18, 24984–24993 RSC.
- K. Zhang, S. Lv, Z. Lin and D. P. Tang, Biosens. Bioelectron., 2017, 95, 34–40 CrossRef CAS PubMed.
- M. Lu, Z. Pei, S. Weng, W. Feng, Z. Fang, Z. Zheng, M. Huang and P. Liu, Phys. Chem. Chem. Phys., 2014, 16, 21280–21288 RSC.
- L. P. Mei, X. Y. Jiang, X. D. Yu, W. W. Zhao, J. J. Xu and H. Y. Chen, Anal. Chem., 2018, 90, 2749–2755 CrossRef CAS PubMed.
- Q. Shen, X. Zhao, S. Zhou, W. Hou and J. J. Zhu, J. Phys. Chem. C, 2011, 115, 17958–17964 CrossRef CAS.
- B. Liu and E. S. Aydil, J. Am. Chem. Soc., 2009, 131, 3985–3990 CrossRef CAS PubMed.
- P. Wang, J. Lei, M. Su, Y. Liu, Q. Hao and H. Ju, Anal. Chem., 2013, 85, 8735–8740 CrossRef CAS PubMed.
- J. R. Vegelius, K. O. Kvashnina, H. Hollmark, M. Klintenberg, Y. O. Kvashnin, I. L. Soroka, L. Werme and S. M. Butorin, J. Phys. Chem. C, 2013, 116, 22293–22300 CrossRef.
- J. Tang, J. Li, Y. Zhang, B. Kong, Yiliguma, Y. Wang, Y. Quan, H. Cheng, A. M. Al-Enizi, X. Gong and G. Zheng, Anal. Chem., 2015, 87, 6703–6708 CrossRef CAS PubMed.
| This journal is © The Royal Society of Chemistry 2019 |

![[thin space (1/6-em)]](https://www.rsc.org/images/entities/char_2009.gif) 000
000