 Open Access Article
Study on the influence of coconut oil on flow pattern and pressure drop of two-phase swirl flow
Shuli
Wang
,
Boyang
Ding
 ,
Yongchao
Rao
* and
Feng
Chen
School of Petroleum Engineering, Changzhou University, Jiangsu 213164, China. E-mail: ryc@cczu.edu.cn
First published on 14th October 2019
Abstract
In view of the widespread existence of swirl flow in surfactant systems in oil drilling, gas gathering, and gathering pipelines, surfactants can affect interfacial tension and thus change the flow pattern. In order to further study and master the swirl flow characteristics in surfactant systems, this experimental investigation was presented, focused on gas–liquid flow during swirl flow, and aiming to evaluate the effect of surfactant in flow patterns. The experimental medium was air and water, the swirler was a vane and the surfactant was natural coconut oil. The purity of coconut oil was 99.9%, and the concentration was 100–900 ppm. The surface tension of the surfactant solution was measured using a surface tension meter to determine the concentration of the coconut oil solution at the minimum surface tension. By analyzing the flow characteristics of the gas–liquid interface with a high-resolution camera, the flow pattern of the gas–liquid two-phase swirl flow under the surfactant system was divided into the swirl linear flow, the swirl wave stratified flow, the swirl axial flow, and the swirl dispersed flow. Compared with the gas–liquid two-phase flow swirl flow pattern without surfactant, it was found that the swirl bubble flow and the swirl slug flow were not present, which was related to the stability of the gas–liquid interface weakened by the decrease of surface tension between the gas and liquid. The effects of flow pattern, gas content, vane parameters, surfactant concentration and flow rate on pressure drop were systematically investigated. Finally, based on the experimental data, we modified the pressure drop model of the gas–liquid two-phase swirl flow under the surfactant system with the vane as the spinner. The calculated value of the pressure drop model agrees well with the experimental data. This model can provide technical support for the safe operation of oil and gas pipelines.
1. Introduction
Swirl flow is a common flow phenomenon in petroleum engineering, such as the flow of drilling fluid between the wellbore and the drill pipe, the fluid flow in the spiral gas anchor, and the fluid flow in the annular space of the surface-driven screw pump. In the above fluid flow process, the fluid often contains polymers and surfactants, and the composition of the fluid is complicated. For example, in the swirl flow of drilling fluid containing polymers, the presence of polymers causes large changes in the viscosity, rheology, and pressure drop of the fluid, so that the swirl flow of the drilling fluid is significantly different from the general fluid flow. In addition, since the use of chemical additives such as polymers and surfactants further exacerbates environmental pollution, degradable surfactants are the focus of future applications in the petroleum industry. Therefore, the systematic research on the flow characteristics of swirl flow under the degradable surfactant system is of great significance for the green, efficient and steady development of the oil and gas gathering and transportation industry.In terms of swirl flow characteristics, in 1961, Nissan1 systematically studied the flow velocity distribution characteristics of swirl flow in horizontal tubes. The experimental results show that the absolute value of the tangential flow velocity is in an inverted U-shaped distribution within the radius of the pipeline. In 1974, Wang et al.2 studied the distribution characteristics of the axial flow velocity and tangential flow velocity of the swirl flow. The results show that the maximum tangential velocity gradually moves toward the center of the pipeline as the flow distance increases. When the axial flow velocity is low, the axial flow velocity only has a maximum value, and as the axial velocity increases, the axial velocity gradually becomes a bimodal structure with two maximum values. In 1990, aiming at the generation and flow mechanism of swirl flow, Horri3 carried out research on swirl flow characteristics using air as experimental working fluid. The flow patterns of different particles under different swirling coefficients, different flow rates and different pipeline conditions were systematically studied. The flow characteristics and mechanism of swirl flow were preliminarily studied. The swirl flow characteristics were studied by using a tangential inlet swirler designed independently.4 In 1999, Xiong and Wei5 used a laser velocimetry to measure the velocity distribution characteristics of the swirl flow generated by the Horri-designed swirler. The experimental results show that the swirl flow is caused by the transition of the asymmetric double vortex structure to a single vortex structure. In 2003, Sun et al.6 studied the flow velocity distribution of tangential flow velocity and axial flow velocity with a local swirl flow generator as the research object. The experimental results show that the tangential flow velocity is linearly distributed in the cross section of the pipeline, and the axial flow velocity is logarithmic. In 2005, Xue et al.7 systematically summarized the different swirling principles and characteristics of different swirlers. The comparison shows that the tangential inflow has a better effect. However, the authors believe that this conclusion needs further experimental verification. In 2008, Vashisth et al.8 conducted an experimental study on the void fraction and flow pattern of gas–liquid two-phase swirl flow. The experiment identified stratified, slug, plug, wave and churn flow patterns. Based on the experimental results, the flow pattern was drawn, the empirical relationship of the gas content in the laminar, transition and turbulent zones was established. In 2011, Wongcharee et al.9 conducted an experimental study on fluid flow characteristics and heat transfer characteristics in a circular tube for the influence of twisted types on flow in different directions of rotation. The experimental results show that the Nusselt number, frictional coefficient and thermal coefficient of the swirl flow are higher than the ordinary flow, indicating that the swirl flow has a good application prospect. In 2012, Kanizawa et al.10 carried out an experimental study on gas–liquid two-phase flow with twisted types. The results showed that five flow patterns were obtained: stratified flow, stagnant flow, intermittent flow, annular-stratified flow and annular flow. A new method was proposed to predict the pressure drop of gas–liquid two-phase swirl flow. In 2014, Zhou11 used CLSVOF method to simulate the flow pattern transition boundary of swirl flow in rectangular spiral pipe, and drew flow pattern maps with different spiral diameters and different spiral angles. In 2015, Liu et al.12 used a high-speed flow visualization method to experimentally study the air–water two-phase flow characteristics in a vertical helical rectangular channel. The flow pattern of the helical rectangular channel was obtained. The evolution process of the flow pattern in different positions of the helical rectangular channel was described, and the problem of bubble and slug aggregation was discussed. In 2016, Wang Shuli also conducted exploratory research on gas–liquid two-phase flow patterns,13–16 and studied the flow pattern and flow pattern transition boundary of gas–liquid two-phase swirl flow with vane and twisted type. Rao et al.17 found that the gas–liquid two-phase swirl flow can be used to enhance the formation of gas hydrates due to the large contact area between gas and liquid and high heat and mass transfer rate. An experimental platform for studying the continuous formation of hydrates in pipeline flow systems was constructed. Wang et al.13,18 summarized the generating device of swirl flow and carried out experimental research. The experimental flow patterns were divided into six types: swirl bubble flow, swirl wave stratified flow, swirl linear flow, swirl axial flow, swirl slug flow and swirl dispersed flow.
For swirl flow studies in surfactant systems, Spedding et al.19 found that surfactants can contribute to the elimination of gravity waves, expand the range of smooth stratified flows. Sylvester and Brill20 pointed out that the addition of surfactants in horizontal annular flow can reduce flow resistance. Kang et al.21 studied the effect of drag reducing agent on oil/gas/water three-phase flow pattern in the inclined pipe,, and pointed out that the addition of drag reducing agent increased the liquid flow velocity needed for the transition from stratified flow pattern to slug flow pattern. Hand et al.22 experimentally studied the effect of surfactants on gas–liquid two-phase flow patterns. The results show that the surfactant addition can transform the gas–liquid two-phase flow pattern from smooth stratified flow to wavy stratified flow at a higher gas flow rate. Previous studies have shown that the addition of low-dose surfactants in square-pipe and circular-tube gas–liquid two-phase flow systems eliminates the ripples, making smooth stratified flow more prone to occur.23 Xia et al.24,25 used the conductance tomography system developed by Reinecke et al.26 to experimentally study the effect of surfactant addition on the liquid fraction of gas–liquid two-phase flow in horizontal tubes. The results show that the addition of surfactant can inhibit or eliminate interface fluctuations and increase the average cross-sectional liquid fraction. The addition of surfactants reduces the liquid fraction of the slug flow, especially when the gas–liquid flow rate is low. As the gas–liquid flow rate increases, the effect of the surfactant on the liquid fraction of the gas–liquid two-phase flow is gradually weakened. Li et al.16 studied the flow pattern and pressure drop of gas–liquid two-phase swirl flow in different concentrations of SDS solution system. The results show that the addition of low-dose SDS can promote the gas–liquid two-phase swirl flow pattern to the swirl dispersed flow and reduce the pressure drop. In 2017, Dai et al.27 conducted an experimental study on the gas–liquid two-phase swirl flow pattern in a horizontal tube under the surfactant system. The results show that SDBS can advance the transition boundary of swirl annular flow, swirl slug flow and swirl dispersed flow.
For the swirl flow pressure drop characteristics, the establishment of the swirl flow pressure drop model is one of the goals of swirl flow characteristics research. For the pressure drop calculation of two-phase flow, the more classical methods are the division phase flow models established by Lockhart & Martinelli28 and Chisholm.29 In 2000, Sun Xihuan30 took the spiral flow in the horizontal pipe as the research object and established the calculation formula of the pipe section pressure. The pressure drop calculation model of swirl flow is similar to Darcy's formula, but there is a significant difference in the calculation of the frictional resistance coefficient. In 2008, Cui et al.31 experimentally studied the two-phase flow and pressure drop characteristics of R134a in micro-foil spiral coils, and obtained three flow patterns: wave stratified flow, intermittent flow and annular flow. The flow pattern map was drawn based on the experimental data, and the flow conversion formula and pressure drop formula were obtained. In 2011, Zohir et al.32 studied the heat transfer and pressure drop of swirl flow through a swirl flow experimental platform. The experimental results show that the pressure drop of the swirl flow is significantly larger than that of the non-swirl. Under the same condition, if the swirler is the propeller, the measured pressure drop is 3 times that of the non-swirl. If the swirler is the coil spring, the measured pressure drop is 1.5 times that of the non-swirl. In 2011, Chang et al.33 carried out the swirl flow pressure drop characteristics experiment with the swirl flow of the piston cooling channel of marine diesel engine. The experimental results show that the existence of swirl flow significantly improves the heat transfer capacity of the system, and the pressure drop coefficient of the swirl flow is significantly higher than that of the non-swirl flow. In 2016, Li et al.34 studied the frictional resistance characteristics of swirl flow in a circular tube through experiments and numerical simulations. The results show that the larger the Reynolds number, the more severe the turbulence, and the greater the wall shear force and friction coefficient. In 2017, Wang35 conducted an experimental study on pressure drop characteristics of single-phase swirl pipe flow in horizontal and inclined pipes induced by self-rotating twisted tapes. Based on the experimental data and the Darcy–Weisbach formula, the pressure drop calculation model suitable for liquid single-phase swirl pipe flow was obtained. The pressure drop characteristics of the gas–liquid two-phase swirl flow in the horizontal tube were studied.36 The experimental results show that the fluid flow rate is an important factor affecting the frictional resistance characteristics.
Experts have carried out systematic research on swirl flow with different swirlers. However due to the different experimental devices, experimental conditions and research background, the conclusions obtained by different scholars on the swirl flow pressure drop are very different, and there are few studies on the swirl flow pressure drop law under the surfactant system. In addition, the additives in the current petroleum industry are often traditional surfactants or polymers, and there are serious problems such as difficulty in recovery and large environmental pollution. In summary, the natural coconut oil extracted from plants is used as a surfactant to study the surface tension characteristics, spiral flow pattern and pressure drop. It can provide theoretical and technical support for the spiral flow characteristics of complex solutions in the petroleum industry.
2 Experiments
2.1 Experimental apparatus
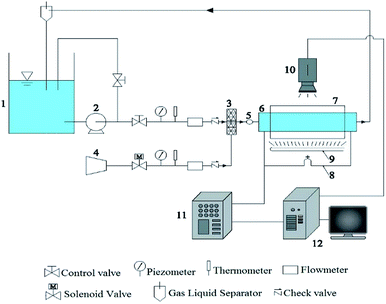
As shown in Figure1, the experimental device consists of four systems, which are a water circulating system, an air supply system, an image collecting system, and the experimental pipe. Water is pumped from the water tank, gas flow is controlled by the gas flowmeter, liquid flow is measured by weighing method and liquid rotameter. Pressurized air is from the air compressor, the gas is mixed with water, and gas and liquid phase enter into experimental device. The gas phase flow is measured by glass rotor flowmeter. When the experiments finish, gas flows into the atmosphere, water flows into the water tank.The water circulating system mainly consists of a pump, a liquid rotameter, and a regulating valve. The rated flow of the pump is 15 m3 h−1, the head is 10 m, and the output shaft power is 0.75 kw. The air supply system consists of an air compressor, an air storage tank, a solenoid valve, a piezometer, a flowmeter, and a check valve. The piston air compressor has an exhaust pressure of 0.9 MPa, a gas tank capacity of 23 L and a rated speed of 120 rpm. There are two gas flow meters ranging from 0.06 to 0.6 m3 h−1 and 0.2 to 2.5 m3 h−1. The superficial velocities of gas and water are each 0 to 4.0 m s−1. The void fraction varies from 10% to 90%. Image acquisition system mainly consists of a illuminating system and a camera. The illuminating system uses a 6500 K color temperature fluorescent tube, which is stable and has no flicker. The image recording system uses the SONY HDR-XR550E high-definition hard disk video camera. The experimental section consists of a transparent pipe, a square box, a swirl flow generator and a pressure measuring device. The transparent pipe is a circular pipe of Φ23 × 3.5 × 2000 (D = 23 mm). The distance between swirl device and inlet is 8D. The distance between pressure measurement point p1 and inlet is 4D. The distance between pressure measurement point p2 and outlet is 4D. This part is made of transparent plexiglass to facilitate visual observation of the experimental phenomenon. When the image is taken, the circular edge wall creates a convex mirror effect that focuses the various points in the same field of view at different levels. Therefore, a square box made of transparent glass is added outside the transparent tube, and is filled with distilled water to reduce the refraction phenomenon and compensate the optical path.
2.2 Swirler
Fig. 2 is a schematic view of a swirl vane in which the meaning of the swirl angle α is as shown. Nine types of swirl vanes are formed by three different vane areas and three different swirl angles. All vanes are used to perform the orthogonal tests. The vane size s is expressed by the percentage of a single blade against the whole vane area, which equates to 33.3%, 27.8%, and 22.2%, respectively. The swirl angle is the angle between the single blade and the vane, which is expressed by a half of the angle between two blades. The swirl angle a used in the experiments is 7.5°, 15°and 22.5°, respectively. As is shown in Table 1:| 7.5° | 15° | 22.5° | |
|---|---|---|---|
| 33.3% | 1# | 2# | 3# |
| 27.8% | 4# | 5# | 6# |
| 22.2% | 7# | 8# | 9# |
2.3 Surface tension measuring experimental device
The main components of the surface tension measuring experimental device include: electronic analytical balance, surface tension meter, HAKKE low temperature circulating water bath, t-type thermocouple. The accuracy of the TG-328A electronic analytical balance is 0.001 g. The surface tension meter is the K11 automatic surface tension meter from KRUSS, Germany. The temperature range of low temperature circulating water bath is 273–323 K.The basic parameters are shown in Table 2. In this experiment, the surface tension of the solution was determined using the Wilhelmy plate method provided by the apparatus. The plate immersed in the liquid to be tested is pulled down by the surface tension. When the liquid surface tension and other forces are balanced, the plate will stop at a certain position inside the liquid. At this point, the sensor can measure the water depth and convert it to the surface tension value of the liquid.
| Measurement methods | Wilhelmy plate method | ||
|---|---|---|---|
| Measuring range | 1–999 mN m−1 | Temperature fraction | ±0.1 K |
| Measurement resolution | 0.1 mN m−1 | Maximum sample weight | 50 g |
| Density resolution | 1 kg m−3 | Maximum lifting distance | >90 mm |
| Temperature measurement range | 213–723 K | Position resolution | 0.1 mm |
2.4 Surfactant
The surfactant selected for this experiment was a degradable natural coconut oil extracted from plants with a purity of 99.9%. In this experiment, the concentration of coconut oil solution was set to 100–900 ppm, which ensured the stability of the experiment and the accuracy of the data. The surfactant is stirred by a stirrer and has good hydrophilicity. Compared to traditional surfactants, the coconut oil used in this experiment is usually used in soaps and shampoos. It has good degradability and is very environmentally friendly.3 Experimental results
3.1 Surface tension characteristics
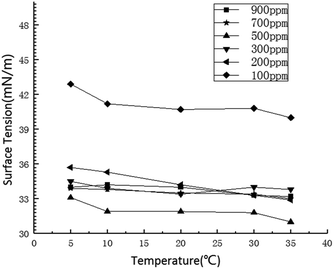
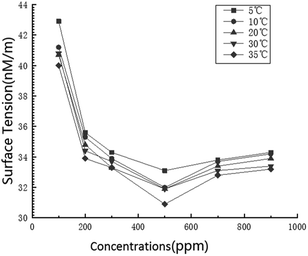
The surface tension decreases with the increase of liquid temperature. The increase of liquid temperature indicates that the intramolecular energy of the liquid increases and the interaction force between the molecules decreases. The surface tension is due to the gravitational force between molecules in the liquid surface layer, and the decrease of the gravitational force results in the decrease of the surface tension.
3.2 Flow patterns
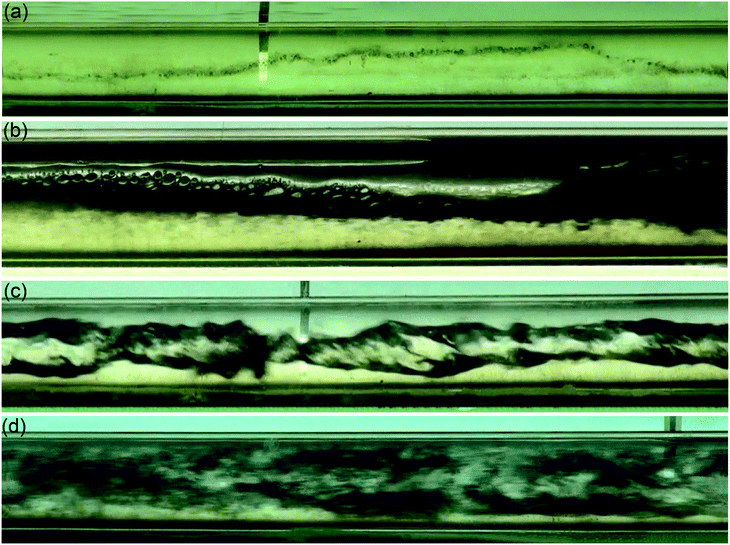
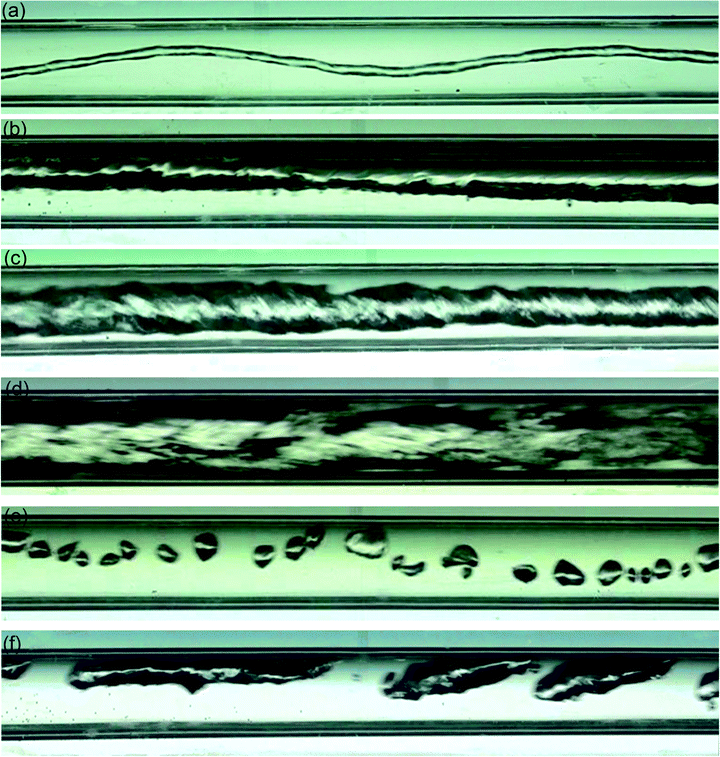
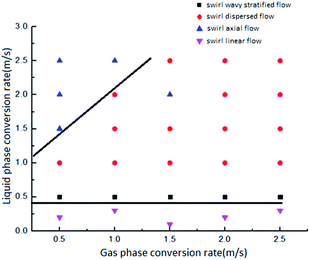
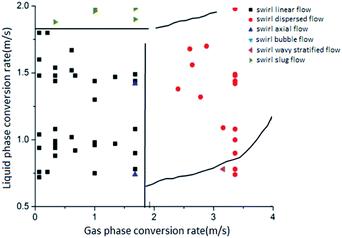
According to the research results of surface tension, when the concentration of the surfactant solution is 500 ppm, the surface tension between gas and liquid is the smallest, so that the experimental results can better reflect the relationship between surface tension and flow pattern conversion. As shown in Fig. 5, in the surfactant solution with a concentration of 500 ppm, there are four types of gas–liquid two-phase swirl flow generated by the vane: swirl linear flow, swirl wave stratified flow, swirl axial flow and swirl dispersed flow. Compared with the gas–liquid two-phase swirl flow pattern under the same working conditions without the surfactant, the swirl bubble flow and the swirl slug flow do not appear (Fig. 6). This is because the addition of low-mass surfactant reduces the gas–liquid interfacial tension, weakens the stability of the gas–liquid interface, and enhances the gas–liquid blending degree, so that the gas phase no longer exists in the form of stable bubbles or air masses, thus causing a conversion of the flow pattern. The four flow patterns appearing in the gas–liquid two-phase swirl flow generated by the impeller under the surfactant system are described in detail below.The swirl wavy stratified flow is characterized by obvious stratification of gas–liquid two phases, as shown in Fig. 5b and 6b. Since the liquid phase density is much larger than the gas phase density, the gas phase occupies the upper space of the pipe, and the liquid phase is distributed in the lower space of the pipe. In general, when such a flow pattern occurs, the gas phase conversion flow rate is greater than the liquid phase conversion flow rate. Because the gas phase flow rate is greater than the liquid phase flow rate, the gas phase will carry a small amount of liquid phase to flow forward along with it, and due to the swirl flow generated by the vane, the gas–liquid interface will oscillate in the vertical direction. These reasons lead to the appearance of waves at the gas–liquid interface. For systems with low-concentration surfactant solutions, this flow pattern is likely to occur in gas–liquid two-phase swirl flows produced by either type of vane when the liquid phase flow rate is not greater than 1.0 m s−1. However, in general, the stable existence of this flow pattern can only be observed when the gas phase conversion flow rate is greater than the liquid phase conversion flow rate. Otherwise, due to the low flow rate of the gas phase, the liquid carrying capacity is insufficient, which may result in the flow pattern having the characteristics of a swirl slug flow or a swirl bubble flow.
The characteristic of the swirl axial flow is that all the gas phase and the partial liquid phase are thoroughly mixed and completely wrapped in the remaining liquid phase, and under the action of the vane, a strong swirl motion is performed around the central axis of the circular glass tube, as shown in Fig. 5c and 6c. The swirl axial flow is an unstable flow pattern. When the degree of gas–liquid mixing increases, it tends to be converted into a swirl dispersed flow, which is also the reason why the swirl axial flow is more demanding on the flow rates of gas and liquid phase. Similar to the system without surfactant, the working condition range of swirl axial flow in the system with low concentration of surfactant is narrow. Only when the liquid phase conversion flow rate is in the range of 1.5–2.5 m s−1 and the gas phase conversion flow rate is not more than 1.0 m s−1, the existence of this flow pattern can be observed more clearly. In the pure water system, it is only possible to obtain the swirl axial flow by fixing the gas phase conversion flow rate in the range of 1.5 to 2.0 m s−1 and fixing the liquid phase conversion flow rate in the range of 1.0 to 2.0 m s−1. For systems with low concentration surfactant solutions, the flow pattern with swirl axial flow characteristics may also occur under certain working conditions in the swirl dispersed flow region. For example, when the gas and liquid phase conversion flow rates are both 2.0 m s−1 and the surfactant concentration is 500 ppm, the gas–liquid two-phase swirl flow generated by the 5# vane is a swirl axial flow. The reasons for this phenomenon are summarized as follows: the addition of a surfactant solution with a low mass concentration reduces the gas–liquid interfacial tension, and further increasing the gas–liquid blending degree, which ultimately leads to the transition from swirl axis flow to swirl dispersed flow. A reasonable explanation for the phenomenon of swirl axial flow in the swirl dispersed flow distribution range is that the surrounding portion of the initial swirl axial flow is converted into a swirl dispersed flow due to the increase of gas and liquid mixing.
The swirl dispersed flow is different from the swirl linear flow, the spiral wave stratified flow and the swirl axial flow. When the swirl dispersed flow appears, the swirl flow in the glass tube is not easy to distinguish the gas–liquid two-phase boundary. The gas–liquid two phases in the swirl dispersed flow are fully mixed, and the gas–liquid mixing degree is the largest. The swirl dispersed flow pattern is shown in Fig. 5d and 6d. For the system with low concentration surfactant solution, most of the gas–liquid two-phase swirl flow generated by the vane in the gas–liquid phase flow rate range of 0–2.5 m s−1 is a swirl dispersed flow. In the case of a liquid phase conversion flow rate of 1.0 to 2.5 m s−1 and a gas phase conversion flow rate of 1.0 to 2.5 m s−1, the swirl dispersed flow occurs. Compared to the system without a surfactant added, it is easier to obtain a swirl dispersed flow pattern under the same gas–liquid phase flow rate. This is because the addition of a low-mass surfactant solution reduces the gas–liquid interfacial tension, and further increasing the degree of gas–liquid blending, and these eventually lead to the formation of the swirl dispersed flow.
Comparing the flow pattern transformation law in the flow pattern map with the gas–liquid two-phase swirl flow pattern transformation law that the group has done without adding surfactant, the following conclusions are obtained:
(1) Four flow patterns were observed during the experiment: swirl linear flow, swirl wave stratified flow, swirl axial flow, and swirl dispersed flow. The swirl bubble flow and the swirl slug flow did not occur compared to the non-added surfactant system.
(2) The most common flow pattern in a pure water system is a swirl linear flow. In contrast, in the low-mass surfactant solution system, when the flow rate of the liquid phase and the gas phase are in the range of 0 to 2.5 m s−1 and 1.0 to 2.5 m s−1 respectively, the main flow pattern is swirl dispersed flow.
(3) In the low-mass concentration surfactant solution system, the appearance of the swirl linear flow is more demanding on the liquid phase conversion flow rate. Only when the liquid phase conversion flow rate is not more than 0.5 m s−1, the swirl linear flow will appear. When the liquid phase conversion flow rate is greater than 0.5 m s−1, the swirl linear flow will be directly converted into a swirl dispersed flow instead of a swirl slug flow.
(4) In the low-mass concentration surfactant solution system, the swirl wave stratified flow has higher requirement for the liquid phase conversion flow rate, but lower requirement for the gas phase conversion flow rate. This flow pattern occurs only when the liquid phase conversion flow rate is in the range of 0.5 to 1.0 m s−1.
(5) Similar to the system without surfactant, the range of swirl axial flow is still narrow. The stable existence of the swirl axial flow can be observed only when the flow rates of the liquid phase and the gas phase are in the range of 1.5 to 2.5 m s−1 and 0.5 to 1.0 m s−1 respectively. When the gas phase conversion flow rate increases, the swirl axial flow tends to turn into a swirl dispersed flow.
(6) In the main region of the swirl dispersed flow distribution, the swirl axial flow appears at some conversion flow rates. For example, when the conversion flow rates of the gas and liquid phase is 2.0 m s−1 and the concentration of the surfactant solution is 500 ppm, the gas–liquid two-phase swirl flow generated by the 5# vane is a swirl axial flow.
3.3 The law of pressure drop
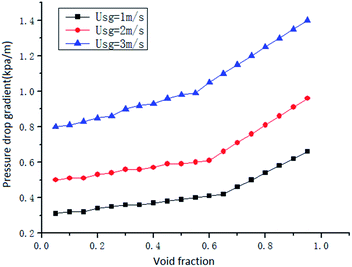
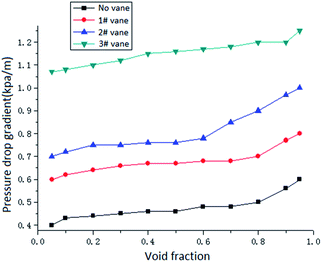
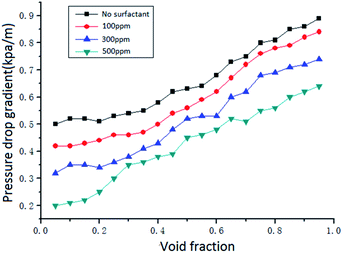
In the gas–liquid two-phase swirl flow in the horizontal pipe, the frictional pressure drop plays a leading role. Under the same conditions, with the increase of gas rate, the disturbance of gas to liquid will increase. The friction between the gas–liquid phase, the gas–liquid phase and the inner wall surface of the pipe is gradually increased, and the flow loss is gradually increased, resulting in an increase in pressure drop. The increase of gas velocity delayed the time of surfactant aggregation on the gas–liquid interface. This makes it impossible for the surfactant to accumulate rapidly on the oscillating interface, which affects its function. And as the void fraction exceeds the critical value, the disturbance of gas phase is further enhanced, which makes the pressure drop increase faster.
The pressure drop gradient of the two-phase flow is composed of three parts: frictional pressure drop, accelerated pressure drop and gravity pressure drop. For the frictional pressure drop, the change of the swirl angle mainly affects the flow direction, and the flow direction is one of the main factors affecting the frictional pressure drop. When the swirl angle becomes larger, the gas–liquid two phases will have a larger tangential velocity after passing through the vane, and the increase of the tangential velocity will increase the friction on the pipe wall and increase the pressure drop. For the accelerated pressure drop, the increase of the swirl angle will increase the slip between the gas and liquid phases, thus increasing the accelerated pressure drop. In general, the accelerated pressure drop is very small compared with the frictional pressure drop and the gravity pressure drop, which can often be neglected. For the gravity pressure drop, it is not necessary to consider the gravity pressure drop because the experimental object is the gas–liquid two-phase swirl flow in the horizontal pipe. In conclusion, the total pressure drop of gas–liquid two-phase swirl flow will increase with the increase of the swirl angle.
The addition of surfactant will reduce the surface tension. When the concentration of surfactant is 500 ppm, the surface tension of the solution will reach the minimum. The reduction of the gas–liquid interfacial tension can weaken the stability of the gas–liquid interface and enhance the mixing of the gas and liquid, so that the occurrence of the swirl dispersed flow is advanced and the range is broadened. The pressure drop of the swirl dispersed flow is relatively small, and the addition of the surfactant also acts to reduce the resistance, thereby affecting the pressure drop.
3.4 Pressure drop model
The Lockhart–Martinelli method is a better one of the horizontal pipe two-phase flow pressure drop calculation methods. Because the experimental conditions are in good agreement with this method, the homogeneous model is used to calculate the pressure drop, and the full liquid phase two-phase frictional multiplier is used to organize the experimental data:| ΦGL2 = ΔPGL/ΔPL | (1) |
In order to better deal with the experimental results, the Lockhart–Martinelli correlation is usually expressed as follows:
 | (2) |
The study found that the value of the correlation coefficient C needs to be re-determined according to the specific conditions of the flow pattern:37
| C = f(λ,φ) = AλRφS | (3) |
From the previous experimental research, it can be found that in the gas–liquid two-phase swirl flow in the horizontal pipe, the void fraction and the vane parameters have important influences on the frictional pressure drop, and it needs to be considered into the model. Therefore, a new correlation coefficient has been established:
| C = ϕ(α,x,G,cb) | (4) |
Because the dominant forces are different in different regions, the pressure drop calculation is divided into two parts according to the void fraction and the gas liquid phase rate: zone 1 is mainly affected by liquid phase inertial force and gravity, corresponding to the low gas and liquid flow rate regions in the flow pattern map. Zone 2 is mainly affected by the axial force and centrifugal force, which make the distribution of gas–liquid two-phase incline to the edge of the pipeline, corresponding to the high gas and liquid flow rate regions in the flow pattern map.
Zone 1 is mainly affected by inertial force and gravity. It is calculated by Froude number. Its formula is as follows:
 | (5) |
The correlation coefficients for zone 1 are as follows:
 | (6) |
In zone 2, the dominant force is the axial force and the centrifugal force, so a coefficient Π is defined as the ratio between the axial thrust and the buoyancy generated by the centrifugal force.
 | (7) |
The correlation coefficient is established for zone 2 as follows.
 | (8) |
Considering that the pressure drop is continuous in the transition between zone 1 and zone 2, the following generalized correlation coefficient is derived from the theory of Churchill.38 The index n is analyzed by regression analysis of experimental data, and its value is 5.
 | (9) |
Finally, the following formula is obtained:
 | (10) |
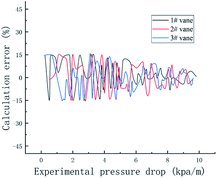
As can be seen from Fig. 12, the pressure drop calculated by the new correlation coefficient is compared with 99.5% of the experimental data, and the error is less than 15%.
4 Conclusions
An experimental study on the patterns and pressure drop characteristics of gas–liquid two-phase swirl flow with surfactant is carried out. The research results are as follows:(1) The surface tension of degradable coconut oil solutions at different temperatures and concentrations was investigated. The experiment found that the optimum concentration of the solution was 500 ppm, and the surface tension of the degradable coconut oil solution was the smallest at this concentration. The experiment also found that the change of surface tension of the solution has a great influence on the stability of the gas–liquid two-phase interface.
(2) In the gas–liquid two-phase swirl flow system with surfactant added, four kinds of flow patterns appear in the gas–liquid two-phase swirl flow generated by the vane, which are swirl linear flow, swirl wave stratified flow, swirl axial flow and swirl dispersed flow. Compared with the flow without surfactant, the swirl bubble flow and the swirl slug flow did not appear. With the addition of the surfactant, the surface tension is gradually reduced, and the stabilizer of the gas–liquid two-phase interface is weakened. Both the swirl bubble flow and the swirl slug flow are in the form of bubbles or air masses (which can be regarded as larger bubbles). When the stability of the gas–liquid interface is weakened, bubbles or larger bubbles cannot maintain their original shape in the liquid phase, resulting in a conversion of the flow pattern. Therefore, the change in surface tension has a large influence on the flow pattern conversion.
(3) Flow pattern, void fraction, vane parameters, surfactant concentration and flow rate have great influence on pressure drop of gas–liquid two-phase swirl flow in pipeline. It is found that the swirl wave stratified flow has the largest pressure drop gradient and the swirl dispersed flow has the smallest pressure drop gradient. The increase in the swirl angle of the vane increases the tangential flow rate, thereby increasing the pressure drop. The addition of a surfactant can significantly reduce the pressure drop of the gas–liquid two-phase swirl flow. And within the experimental concentration range, as the concentration of the surfactant increases, the flow pressure drop gradually decreases. Flow rate is still an important factor affecting the flow pressure drop. As the fluid flow rate increases, the pressure drop also increases.
(4) The use of coconut oil as a surfactant can reduce the resistance in the flow of gas–liquid two-phase flow, thereby reducing the pressure drop of the system. Therefore, based on the gas–liquid two-phase flow, considering the void fraction, vane parameters and surfactant concentration, the gas–liquid two-phase swirl flow pressure drop calculation model under the surfactant system is obtained. The experimental data is used to verify the calculation accuracy of the model. It is found that the theoretical calculation value is in good agreement with the experimental measurement value, and the error is within 15%. The results can lay a good foundation for multiphase flow and hydrate application.
Conflicts of interest
There are no conflicts to declare.Acknowledgements
This research was funded by the National Science Foundation of China, grant number 51574045 and the Postgraduate Research & Practice Innovation Program of Jiangsu Province, grant number SJCX18_0965.References
- A. H. Nissan and V. P. Bresan, Swirling flow in cylinders, AIChE J., 1961, 7(4), 543–547 CrossRef CAS.
- S. Wang and Z. Rusak, The dynamics of a swirling flow in a pipe and transition to axisymmetric vortex breakdown, J. Fluid Mech., 1997, 340(340), 177–223 CrossRef.
- K. Horii, A Study of Spiral Flow (Part 3)-Opening and Orientation Control of Fiber by Spiral Flow, Trans. Jpn. Soc. Aeronaut. Space Sci., 1990, 32(8), 893–899 Search PubMed.
- K. Horii, A Study of Spiral Flow (Part 3)-Opening and Orientation Control of Fiber by Spiral Flow, Trans. Jpn. Soc. Aeronaut. Space Sci., 1990, 32(8), 155–185 Search PubMed.
- A. Xiong and Q. Wei, discussion on analytic solution of axisymmetric spiral flow, Mech. Eng., 2016, 21(05), 15–16 Search PubMed.
- X. Sun and Y. Zhao, Velocity distribution of local swirler and outlet section of swirl flow in circular tube, J. Taiyuan Univ. Technol., 2003, 34(2), 122–125 Search PubMed.
- B. Xue and S. Yang, Contrastive analysis of the formation of swirl flow and various swirlers, J. Mech. Eng. Autom., 2005, 1, 98–100 Search PubMed.
- S. Vashisth and K. D. P. Nigam, Experimental investigation of void fraction and flow patterns in coiled flow inverter, Chem. Eng. Process., 2008, 47(8), 1281–1291 CrossRef.
- K. Wongcharee and S. Eiamsa-Ard, Friction and heat transfer characteristics of laminar swirl flow through the round tubes inserted with alternate clockwise and counter-clockwise twisted-tapes, Int. Commun. Heat Mass Transfer, 2011, 38(3), 348–352 CrossRef.
- F. T. Kanizawa and G. Ribatski, Two-phase flow patterns and pressure drop inside horizontal tubes containing twisted-tape inserts, Int. J. Multiphase Flow, 2012, 47(3), 50–65 CrossRef CAS.
- Y. Zhou and L. Zhang, Numerical Simulation of Gas-Liquid Two-Phase Flow Pattern Conversion in a Rectangular Section of a Spiral Tube, J. Chem. Ind. Eng., 2014, 65(12), 4767–4774 CAS.
- X. Liu, G. Xia and G. Yang, Experimental study on the characteristics of air–water two-phase flow in vertical helical rectangular channel, Int. J. Multiphase Flow, 2015, 73, 227–237 CrossRef CAS.
- S. Wang, Y. Rao and Y. Wu, Experimental research on gas-liquid two-phase spiral flow in horizontal pipe, China Pet. Process. Petrochem. Technol., 2012, 14(3), 24–32 Search PubMed.
- S. Wang, Y. Rao and M. Wei, Experimental study on pressure drop of gas-liquid two-phase swirl flow in horizontal tube, Sci. Technol. Eng., 2013, 13(3), 659–663 Search PubMed.
- S. Wang, Y. Rao and Y. Wu, Experimental study on gas-liquid spiral flow with twisted types, J. Hydrodyn., 2013, 28(1), 105–110 Search PubMed.
- J. Li, S. Wang and Y. Rao, Effect of Surfactants on Flow Characteristics of Gas-Liquid Two-Phase Spiral Tube Flow, J. Hydrodyn., 2015,(1), 18–23 Search PubMed.
- Y. Rao, S. Wang and Y. Wu, Research progress on techniques and methods for gas hydrate enhanced formation, Oil & Gas Storage and Transportation, 2012, 31(10), 725–732 Search PubMed.
- S. Wang, Y. Rao and Y. Han, Comparative analysis and research on spiral flow generator, Fluid Mach., 2013, 41(2), 30–38 Search PubMed.
- P. Spedding and N. Hand, A revised analysis of the effect of surfactants on two-phase phenomena in horizontal air-water pipe flow, Dev. Chem. Eng. Miner. Process., 1997, 5(3–4), 267–279 Search PubMed.
- N. D. Sylvester and J. P. Brill, Drag reduction in two-phase annular-mist flow of air and water, AIChE J., 1976, 22(3), 615–617 CrossRef CAS.
- C. Kang, R. M. Vancko and A. S. Green, Effect of drag-reducing agents in multiphase flow pipelines, J. Energy Resour. Technol., 1998, 120(1), 15–19 CrossRef CAS.
- N. P. Hand, P. L. Spedding and S. J. Ralph, The effect of surface tension on flow pattern, holdup and pressure drop during horizontal air-water pipe flow at atmospheric conditions, Chem. Eng. J., 1992, 48(3), 197–210 CrossRef CAS.
- T. J. Hanratty and A. Hershman, Initiation of roll waves, AIChE J., 1961, 7(3), 488–497 CrossRef CAS.
- G. Xia, Q. Zhao and L. Cheng, Effect of surfactant addition on liquid holding rate of gas-liquid two-phase flow in horizontal pipe, J. Eng. Thermophys., 2005, 26(4), 628–630 CAS.
- G. Xia, Y. Peng and C. Ma, Two-phase flow pattern tomography of gas/surfactant aqueous solution, J. Eng. Thermophys., 2003, 24(5), 789–792 CAS.
- N. Reinecke and G. Petritsch, Tomographic imaging of the phase distribution in two-phase slug flow, Int. J. Multiphase Flow, 1998, 24(4), 617–634 CrossRef CAS.
- Y. Dai, Y. Rao and S. Wang, Experimental study on gas-liquid two-phase spiral flow in horizontal tube under degradable surfactant system, J. Exp. Mech., 2016, 31(1), 134–140 Search PubMed.
- R. Lockhart and R. Martinelli, Proposed correlation of data for isothermal two-phase, two-component flow in pipes, Chem. Eng. Prog., 1949, 45(1), 39–48 Search PubMed.
- D. Chisholm, Pressure gradients due to friction during the flow of evaporating two-phase mixtures in smooth tubes and channels, Int. Commun. Heat Mass Transfer, 1973, 16(2), 347–358 CrossRef CAS.
- X. Sun, Experimental study on hydraulic characteristics and solid suspension mechanism of spiral flow in horizontal axis tube, 2000 Search PubMed.
- W. Cui, L. Li and M. Xin, An experimental study of flow pattern and pressure drop for flow boiling inside microfinned helically coiled tube, Int. J. Heat Mass Transf., 2008, 51(1), 169–175 CrossRef CAS.
- A. E. Zohir and A. Aziz, Heat transfer characteristics in a sudden expansion pipe equipped with swirl generators, Int. J. Heat Fluid Flow, 2011, 32(1), 352–361 CrossRef.
- S. Chang and Z. Cai, Heat transfer and pressure drop in a reciprocating blind duct with swirls generated by a lateral entry jet, Exp. Therm. Fluid Sci., 2011, 35(6), 1067–1085 CrossRef.
- S. Li, C. Dong and Z. Wang, Study on the vibration characteristics of structural of hydrocyclone based on fluid structure interaction, Journal of Measurements in Engineering, 2016, 4(2), 103–111 Search PubMed.
- K. Chang, Y. Rao and S. Wang, Study on the characteristics of swirl flow pressure drop in horizontal and inclined pipelines, China Petroleum Machinery, 2017, 45(1), 105–109 Search PubMed.
- Y. Rao, J. Liang and S. Wang, Experimental study on frictional resistance characteristics of gas-liquid two-phase swirl flow with vane, J. Hydrodyn., 2017, 32(1), 88–95 Search PubMed.
- K. N. Agrawal, H. K. Varma and S. Lal, Pressure drop during forced convection boiling of r-12 under swirl flow, J. Heat Transf., 1982, 104(4), 758–762 CrossRef CAS.
- J. M. Quibén and J. R. Thome, Flow pattern based two-phase frictional pressure drop model for horizontal tubes, Part II: New phenomenological model, Int. J. Heat Fluid Flow, 2007, 28(5), 1060–1072 CrossRef.
| This journal is © The Royal Society of Chemistry 2019 |

