 Open Access Article
Experimental investigation of shale oil recovery from Qianjiang core samples by the CO2 huff-n-puff EOR method
Lei Li ab,
Chengwei Wangab,
Dongsheng Liab,
Jingang Fuab,
Yuliang Su*ab and
Yuting Lv
 c
c
aKey Laboratory of Unconventional Oil & Gas Development (China University of Petroleum (East China)), Ministry of Education, Qingdao, China. E-mail: suyuliang@upc.edu.cn; Tel: +86-15224450387
bSchool of Petroleum Engineering, China University of Petroleum (East China), Qingdao, China
cCollege of Mechanical and Electronic Engineering, Shandong University of Science and Technology, Qingdao, China
First published on 13th September 2019
Abstract
CO2 Huff-n-Puff (HnP) is an effective technique for enhancing oil recovery (EOR) that can be applied to shale oil reservoirs faced with poor natural productivity and low water injectivity. The main objective of this study is to investigate the interactions of CO2 and formation crude oil, and evaluate the CO2 HnP performance in shale oil reservoirs in the Qianjiang depression in China. In this study, the variation rules of oil phase behavior, viscosity, saturation pressure, and swelling factor at different CO2 contents of 0 to 65% were studied. A series of HnP experiments were conducted. The factors affecting the oil recovery were discussed, and Nuclear Magnetic Resonance (NMR) tests were conducted on core samples at different stages of the HnP process. The results show that the injected CO2 can make an positive change in the crude oil phase behavior. The oil–gas two-phase region enlarges and the saturation pressure increases as more CO2 is dissolved in the formation oil, which is beneficial to oil production. The dissolution of CO2 in the oil phase increased the oil swelling degree by 1.492 times, and the viscosity decreased from 1.944 to 0.453 mPa s. The HnP experimental results demonstrate that the soaking time should be determined based on the injection pressure. Miscible conditions is a viable option for CO2 HnP as 10% more oil can be produced using miscible HnP and save more than half of the soaking time. The results illustrate that fracture is the most important factor affecting oil recovery, and the performance of HnP EOR on core samples with fractures is almost 25% better than those without fractures. However, the core matrix permeability has an almost negligible effect on the performance of CO2 HnP. The NMR tests show that the oil recovered in the first cycle was dominated by macropores and mesopores, followed by small pores. In the latter HnP cycles, the oil in small pores and micropores becomes the main oil-producing area. This study may provide a better understanding of the CO2 HnP enhanced recovery strategy for shale reservoirs.
1. Introduction
CO2 is safe, reliable, and has a wide range of sources, and is the most promising gas source for enhanced oil recovery technology.1–4 CO2 has good solubility in crude oil, and the solubility of CO2 increases with the increase of pressure.5,6 Under reservoir conditions, CO2 can dissolve in crude oil, expanding crude oil volume, reducing the oil viscosity and oil–gas interfacial tension, and increasing crude oil mobility.7,8 All these mechanisms provide favorable conditions for crude oil production.9 At the same time, CO2 is a common greenhouse gas. The public has paid more and more attention to the greenhouse effect nowadays. In addition to studying CO2 emissions reduction, the way to make effective use of CO2 also becomes a research hotspot.10,11 CO2 injection technology can effectively develop low-permeability oil and gas resources. Meanwhile, it can alleviate the greenhouse effect to a certain extent.12 There are two types of CO2 injection which are CO2 flooding and CO2 huff-n-puff (HnP). During the CO2 flooding mode, CO2 is injected through one injection well, and oil and gas will be produced from one production well. In the hydraulic fractured shale reservoirs, the injected CO2 will break through from the injection well to the production well along the fractures or high permeability channels in reservoirs. Whereas, CO2 HnP uses one well as both injection well and production well to avoid gas break through. There are three stages during this process: gas injection stage, well soaking stage, and production stage. After the process, the oil under the control of the well will be produced.13,14 Three main characteristics make CO2 HnP an efficient and feasible EOR technology. First, it's economically feasible and relatively easier to inject CO2 to shale reservoirs to keep the reservoir pressure high as compared to most of the other high viscosity injection fluids such as water or polymer.15 With high injectivity, the oil swept volume improved, resulting in more residual oil that can be driven.16 Second, the injected CO2 improved oil displacement efficiency by dissolving into the shale oil and influencing the oil/gas phase equilibrium during the soaking period. Third, during the production stage, a dissolved gas drive is formed when pressure drops. Combined with the function of oil–gas interfacial tension reduction, more oil can be produced.17,18 The HnP schedule such as the work time for the three stages or the gas injection rate and injection pressure can be adjusted based on the properties of reservoirs. Thus, CO2 HnP has the advantages of strong pertinence, short cycle, and fast capital recovery.19CO2 HnP was first applied in heavy oil production. In the mid-1960s in China, the laboratory experiments were conducted in Daqing and Shengli Oilfields, respectively. In the mid-1990s, Daqing oilfield, Jiangsu oilfield, Jilin oilfield, Zhongyuan oilfield in China all carried out some pilot tests.20,21 However, the development progress of this technology is relatively slow due to the shortage of CO2 resources and the prominent gas channeling contradiction in China. In the United States, the CO2 HnP test was carried out in light oil reservoirs. Bretagne (1985) successfully conducted the CO2 HnP test in Shoemaker Oilfield in shallow light-oil-depleted reservoirs.22 Their results showed that crude oil production was increased by 2–3 times, and the water content was reduced by more than 90%. Monger et al. (1988) conducted 14 field tests and combined them with laboratory experiments to study the stimulation effect of CO2 in light oil reservoirs.23 They proved that CO2 could increase the residual oil production after water flooding. Since 1990, the United States Appalachian Basin started CO2 HnP production, which lasted for 5 years, and implemented a total of 390 HnP operations in 240 wells, with a total oil increase of 12![[thin space (1/6-em)]](https://www.rsc.org/images/entities/char_2009.gif) 476 t.24 It is concluded that the change of water/oil relative permeability by CO2 HnP is the main mechanism of the reservoir stimulation. Torabi and Asghari (2010) conducted a laboratory study to examine the performance and efficiency of CO2 HnP in light-oil fractured porous media.25 The results showed that CO2 HnP technology significantly improved the recovery, and it recovered more than 95% of the oil from the fracture-matrix experimental model saturated with normal decane when the CO2 HnP was conducted at 13.34 MPa. They also announced that the effect of core permeability was less pronounced when CO2 was injection at miscible conditions.
476 t.24 It is concluded that the change of water/oil relative permeability by CO2 HnP is the main mechanism of the reservoir stimulation. Torabi and Asghari (2010) conducted a laboratory study to examine the performance and efficiency of CO2 HnP in light-oil fractured porous media.25 The results showed that CO2 HnP technology significantly improved the recovery, and it recovered more than 95% of the oil from the fracture-matrix experimental model saturated with normal decane when the CO2 HnP was conducted at 13.34 MPa. They also announced that the effect of core permeability was less pronounced when CO2 was injection at miscible conditions.
Recent years, CO2 HnP method has been applied to enhance unconventional oil recovery in light oil and tight reservoirs.26–28 Song et al. (2013) compared water and CO2 injection experiments on cores of Bakken tight formation, and obtained that the degree of CO2 recovery under near-miscible and miscible conditions was higher than that under water flooding.29 Gamadi et al. (2014) did experiments to study the cyclic CO2 injection in shale oil EOR using mineral oil and cores from Mancos and Eagle Ford.30 The laboratory results indicated that cyclic CO2 injection improved recovery of shale oil cores from 33% to 85% depending on the shale core type and the other operating parameters. Li and Sheng measured the efficiency of shale oil recovery through laboratory experiments and numerical simulation of using methane HnP.31 Yu et al. (2016) further explored the influences of soaking time and consumption time on fracture-matrix shale reservoirs in huff and puff experiments using N2.32 Li et al. (2019) conducted experiments comparing the effect of N2 and CO2 on EOR performance, verifying the great potential of CO2 in improving shale oil recovery.33 Other researchers use commercial software such as CMG and Eclipse to simulate the process of CO2 HnP, and investigated the influences of parameters including pressure, injection rate, gas diffusivity, soaking time, and fractures on the efficiency of HnP EOR.34–41 Sheng (2017) reviewed and discussed previous experiments and simulations on gas injection recovery in shale reservoirs.42 He concludes that gas injection in shale reservoirs is more practical and effective than other EOR methods. The simulation results reflect the CO2 HnP performance to some extent. However, the simulation method includes lots of assumption, which cannot represent the real core characteristics, such as core heterogeneity, pore size distribution, organic matter properties, and so on. Experiment work on core scale samples have indicated the great potential of CO2 HnP in the recovery of shale oil. However, it is seen that core samples used in the experiments are purely matrix without presence of natural fractures. The experiments of core samples with presence of natural fractures will be more practical significance to evaluate oil production potential from shales. Also, in all the above study, the oil properties changes such as oil swelling properties, phase behavior due to the addition of CO2 are not well discussed. The underlying mechanisms of CO2 HnP cannot be well understood without the analysis of the reaction of CO2 and the target shale oil.
At present, the application of CO2 huff-n-puff technology in shale reservoir is still in the stage of laboratory research and field test. This technology has many advantages than other kinds of EOR method. (1) Cost effective production is the main challenge given the current economic situation of steady low oil prices. CO2 HnP has low injection cost and wide sources of the injection gas. (2) CO2 HnP can be applied to reservoirs with different permeability, especially to shale reservoirs with poor response to water injection and severe water sensitivity. (3) The implementation of technology is simple. (4) The oil development effect and economic benefit are good and the risk is small. At the same time, there are some challenges when applying this technology. The EOR mechanisms are complex, leading to the difficulty of controlling the EOR effect. Another problem is that it's difficult to accurately predict the development effect as so many factors influencing the implement process. Thus, fully understanding the mechanisms of enhanced oil recovery and the influences of different injection parameters of this process are significant.
In this paper, we investigate the changes of formation oil phase behavior, saturation pressure, swelling factor, viscosity deduction when adding different percentage of CO2 to understand the main interactions of injected CO2 and formation crude oil. Then we conducted CO2 HnP tests on shale core samples from Qianjiang depression in China. Matrix cores with different permeability and cores with natural fractures were all applied to evaluate the shale oil production potential. The influence of key factors (gas injection pressure, soaking time, permeability, miscible condition) on the performance of CO2 huff and puff were discussed.
2. Interactions of CO2 and formation crude oil
2.1. Physical properties of CO2
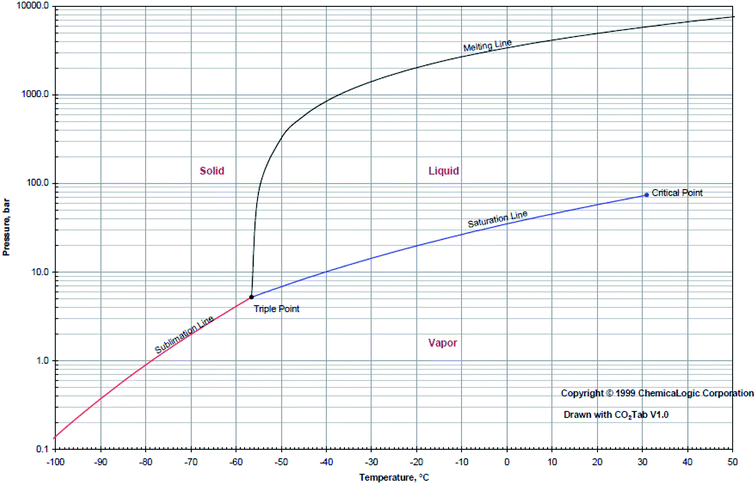
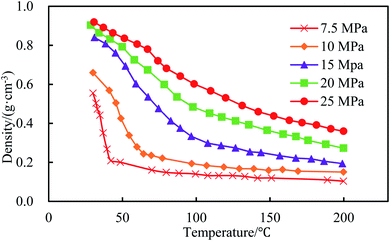
CO2 exists in four forms: gas phase, liquid phase, solid phase and supercritical phase under different pressure and temperature conditions as shown in Fig. 1. The point at which the liquid and gas phase are in equilibrium is called the critical point. The critical temperature of CO2 is about 31.2 °C, and the critical pressure is about 7.38 MPa. When the temperature and pressure are higher than the critical point, CO2 is in supercritical condition. At this condition, the gas–liquid interface disappeared, and its density is close to the density of a fluid. However, its viscosity and diffusion coefficient is still close to ordinary gas. The density of gas-phase CO2 can be calculated by eqn (1). In different phase states, the density of CO2 varies greatly, as shown in Fig. 2. The CO2 density decreases as the system temperature increases or the system pressure decreases.At a certain temperature, the liquid CO2 density is not significantly affected by pressure. As the temperature rises, CO2 changes from liquid phase to gas phase, leading to density decreases. When the system is in a supercritical state, the change of CO2 density is greatly affected by system temperature and pressure.
 | (1) |
2.2. The effect of CO2 on formation oil phase behavior
The shale oil used in this paper is obtained from Qianjiang depression. The initial reservoir pressure is 18.62 MPa, and the temperature is 69.9 °C. The separator oil, separator gas, and formation crude oil compositions are presented in Table 1. The Peng–Robinson equation of state is used to calculate the phase behavior of CO2 and crude oil system as shown in the following equations.
 | (2) |
| α(T) = α(T)αc | (3) |
 | (4) |
| α(T) = [1 + k(1 − Tr0.5)]2 | (5) |
| k = 0.37464 + 1.54226ω − 0.26992ω2 | (6) |
 | (7) |
| Oil composition | Separator oil | Separator gas | Formation crude oil |
|---|---|---|---|
| N2 | 0 | 3.262 | 1.59 |
| CO2 | 0 | 0.621 | 0.3 |
| CH4 | 0.18 | 47.211 | 23.11 |
| C2H6 | 0.22 | 13.139 | 6.52 |
| C3H8 | 1.61 | 19.569 | 10.36 |
| IC4 | 2.77 | 2.773 | 1.73 |
| NC4 | 1.72 | 7.392 | 4.48 |
| IC5 | 2.82 | 1.819 | 2.27 |
| NC5 | 3.38 | 2.028 | 2.72 |
| FC6 | 8.27 | 1.422 | 4.93 |
| FC7 | 4.92 | 0.571 | 2.8 |
| FC8 | 5.87 | 0.193 | 2.95 |
| FC9 | 5.21 | 0 | 2.51 |
| FC10 | 4.06 | 0 | 2.08 |
| C11 to C41 | 58.97 | 0 | 31.65 |
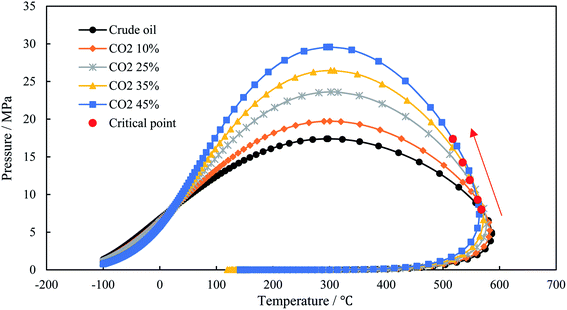
In the process of CO2 HnP, the injected CO2 will affect the formation oil phase behavior. The EOS Peng–Robinson model was used to calculate the phase behavior of CO2 and formation crude oil system under different CO2 mole fraction, as shown in Fig. 3. It shows that with the increase of CO2 content in the oil phase, the oil–gas two-phase zone enclosed by the bubble point line and the dew point line increases continuously. The critical temperature of the system gradually decreases, and the critical pressure of the system gradually increases. It also indicates that during CO2 HnP, the bubble point pressure of crude oil increases after CO2 is injected into the formation, which is beneficial to conduct solution gas drive and contribute to oil production.
2.3. The effect of CO2 on formation oil properties
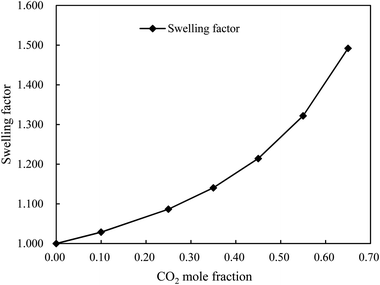
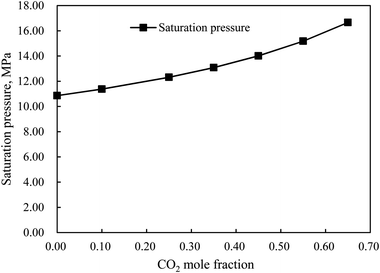
During the gas HnP, when CO2 is injected into the formation, some of the CO2 will dissolve into the crude oil. The solubility of CO2 is related to temperature, pressure, salinity, and molecular weight of crude oil. The CO2 solubility decreases with the increase of salinity and the increase of crude oil molecular weight. The dissolved CO2 will expand the volume of crude oil, changing the crude oil viscosity and density, and reducing interfacial tension. When CO2 is dissolved in light oil, the volume is generally increased by 1.4–1.6 times; when CO2 is dissolved in heavy oil, the volume is generally increased by 1.05–1.32 times. Fig. 4–6 shows the changes of oil viscosity, swelling factor, saturation pressure with different CO2 mole fraction. It can be seen that with the CO2 content increases from 0 to 65 mol%, the oil viscosity declines from 1.94 mPa s to 0.453 mPa s, the swelling factor increases to 1.492, and the saturation pressure increases from 10.86 MPa to 16.66 MPa. It illustrates that CO2 will achieve obvious swelling and viscosity reduction effect when it is injected into a reservoir and fully contacted with formation crude oil.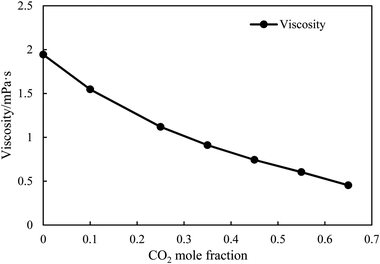 | ||
| Fig. 4 The changes of formation oil viscosity with different CO2 mole fractions at reservoir condition (P = 18.62 MPa, T = 69.9 °C). | ||
3. CO2 huff-n-puff experiments
3.1. Experimental materials
The core samples used in this study were cut from the outcrop of Qianjiang formation in China. A total of 3 cores were used in this study as presented in Fig. 7. We determine the porosity and permeability of the core samples using the pulse decay method by helium injection. The properties of the core samples are shown in Table 2. There are some micro-fractures in Core #2. Thus its total permeability is 2.67 × 10⁻³ μm2, which is much higher than the permeability of the others. The oil used in the core saturation was the separated oil as shown in Table 1 with a density of 0.8545 g cm−3 and a viscosity of 3.49 cP at the temperature of 20 °C. Distilled water is used in the experiment to pressurize the syringe pump. The CO2 used in this study was from Qingdao Tianyuan company, China, with a purity of 99.9%.| Core no. | Length, m | Diameter, m | Porosity, % | Effective porosity, % | Matrix permeability, (10−3 μm2) | Total permeability, (10−3 μm2) |
|---|---|---|---|---|---|---|
| Core #1 | 4.85 | 2.49 | 14.5 | 12.75 | 0.034 | 0.034 |
| Core #2 | 5 | 2.4 | 10.72 | 10.13 | 0.011 | 2.67 |
| Core #3 | 5 | 3.7 | 8.6 | 7.78 | 0.008 | 0.008 |
3.2. Experimental procedures
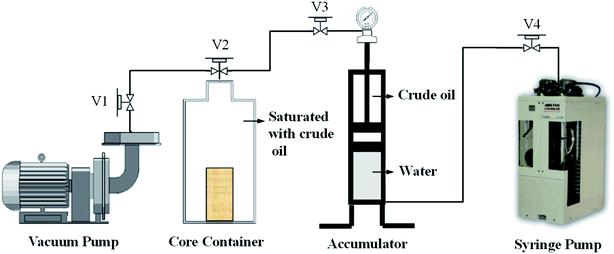
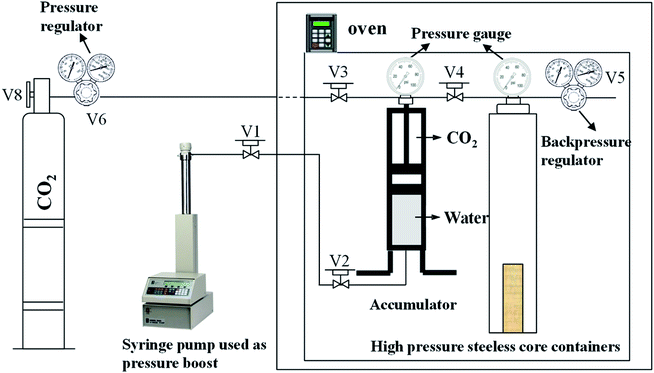
As shown in experiment schematic Fig. 8 and 9, the main instruments and equipment used in this experiment are CO2 cylinder, core container, type II core container, pressure sensor, syringe pump, ISCO pump, accumulator, vacuum pump, and oven.The HnP test contained two parts, including core sample saturation with crude oil and gas HnP process. During the core saturation oil process, the core samples were cleaned with toluene and dried in the oven at 70 °C for 36 h. Then the core samples were weighed and recorded as wd. After that, the core samples were put into the type II core container and vacuumed for 48 h to completely remove the air in the pores. Crude oil was then injected into the core container and a pressure of 30 MPa was maintained for one month to fully saturate the core samples. After these processes, the core samples were removed out and weighed as the saturated core ws.
After saturation, the core sample was put into the HnP vessel. Before starting the experiment, we first test the whole system by injecting N2 at a pressure of 20% higher than the designed experiment pressure and make sure no leakage during all the process. The flow chart of experimental equipment for HnP is shown in Fig. 9. The main procedures of CO2 HnP include injection stage, soaking stage, and production stage. During the injection stage, the core sample was put into the type II container and CO2 gas was injected into the container to the designed pressure (8 MPa/13 MPa/20 MPa). All valves were then closed during soaking period (0.5 h/3 h/8 h) to allow the injected CO2 to fully contact and reacted with the oil in core sample. During the production process, the pressure of container was released to atmosphere pressure. The core sample was weighed again and record as wi when the core mass is no longer changed (usually waiting for 6 hours). After these stages, the first HnP cycle is completed. Repeat the above steps to conduct more HnP cycles based upon experiment requirements.
The experimental operation schedule is shown in Table 3. The oil recovery factor of cycle i (Ri) can be calculated using eqn (8).
 | (8) |
| Cores | Injection pressure/MPa | Soaking time/h | Production time/h |
|---|---|---|---|
| Core #1 | 8 | 0.5 | 1 |
| Core #2 | 3 | ||
| Core #3 | 8 | ||
| Core #1 | 13 | 0.5 | |
| Core #2 | 3 | ||
| Core #3 | 8 | ||
| Core #1 | 20 | 0.5 | |
| Core #2 | 3 | ||
| Core #3 | 8 |
3.3. Nuclear Magnetic Resonance (NMR) experiment
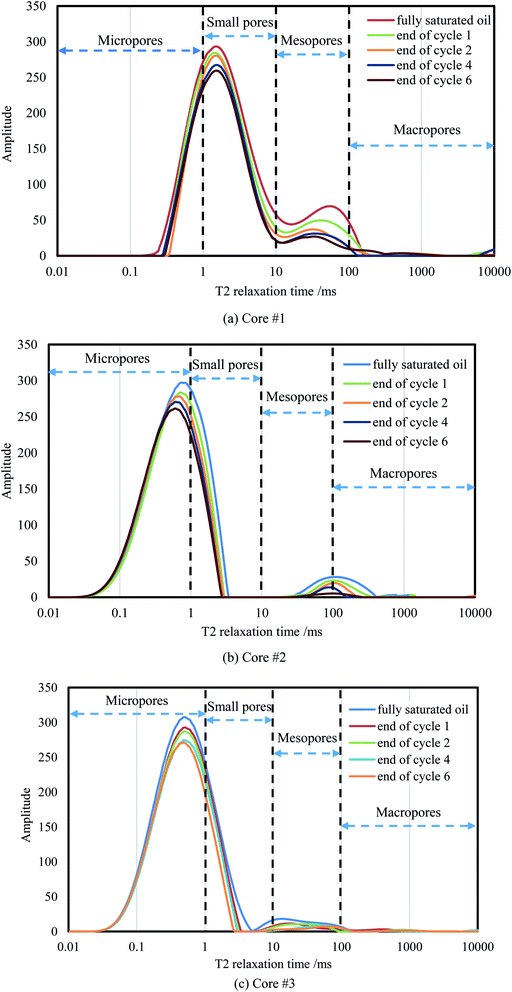
The NMR experiment in this study is to explore the sequence of oil recovered in different pore sizes during the HnP process. In this experiment, five different statuses, including the saturated core, the core after the first, second, fourth, and sixth cycles, were selected to do the NMR analysis. In the generated NMR spectrum, T2 relaxation time has a good correspondence with the shale pore radius. Longer T2 relaxation time results in a larger pore radius. Generally, pores with relaxation time distributed within the range of 0–1 ms are regarded as micropores. Pores with relaxation time within the range of 1–10 ms, 10–100 ms, and greater than 100 ms are small pores, mesopores, and macropores.43 By comparing and analyzing the NMR T2 spectrum of residual oil distribution at the end of different CO2 HnP cycle, the oil production and contribution of different pore sizes to the enhanced oil recovery can be obtained.444. Results and discussion
4.1. The effect of different injection pressure on oil recovery
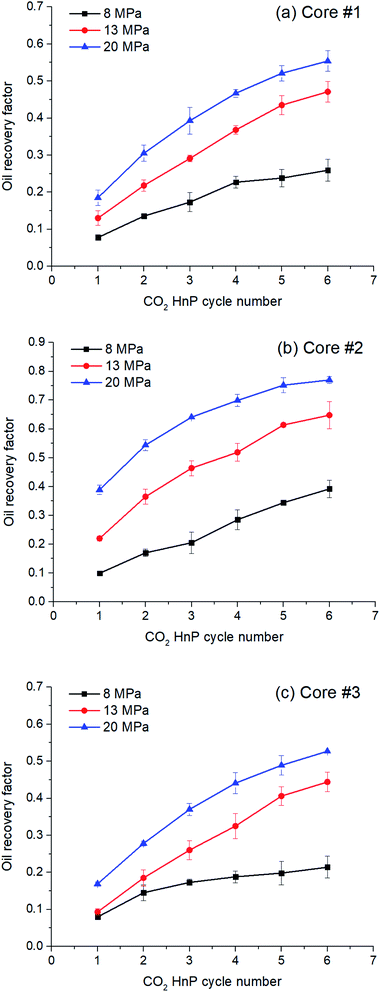
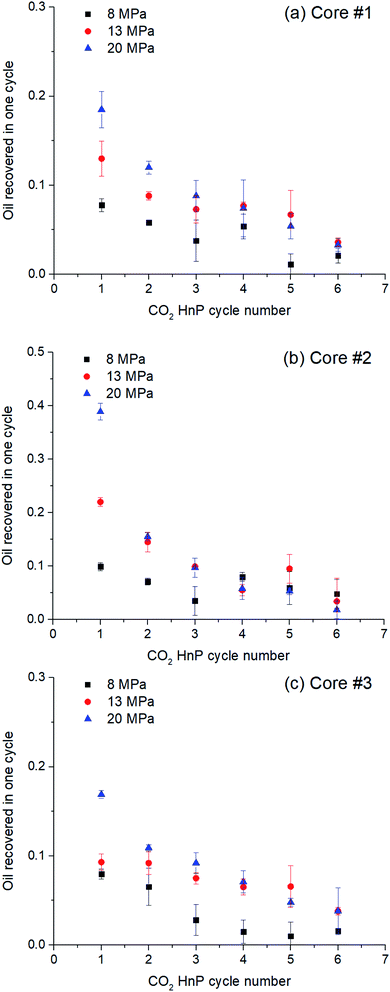
CO2 HnP tests were conducted on three core samples with the same soaking time of 0.5 h and different injection pressures, which were 8 MPa, 13 MPa, and 20 MPa. Each test has 6 HnP cycles. As shown in Fig. 10, CO2 HnP is an effective method to enhance oil recovery in shale cores. After six HnP cycles, the oil recovery factor for Core #1 at injection pressures of 8, 13, and 20 MPa are 25.9%, 47.1%, and 55.4%, respectively. The results also indicate that all these three core samples with different permeability have a similar trend of performance. The oil recovery factor increased as the injection pressure increased. The oil recovered amount in one cycle during CO2 HnP process is presented in Fig. 11. The oil recovery factor obtained in the first HnP cycle is the largest. In the subsequent HnP cycles, the recovered oil increment in each cycle gradually decreases and tends to be stable. For Core #2, the oil recovery differences for three different injection pressures comes from the first three cycles, especially the first cycle. For Core #1 and Core #3, comparing the performance of injection pressures of 8 MPa and 13 MPa, the oil recovered in each cycle at low injection pressure is lower than that at higher injection pressure. However, for the oil recovery of injection pressures 13 MPa and 20 MPa, both exceeding the MMP of CO2 and oil, the main difference of the oil recovery comes from the first three cycles. From the fourth cycle, there is not much difference in the amount of oil recovered in one cycle. This shows that under immiscible condition, the oil recovery increases as the injection pressure increases, and after it reaches the MMP, the effect of injection pressure is not as significant as before. It also indicates that the injection pressure should be higher than MMP of the CO2 and formation oil system to maintain a good EOR performance.4.2. The effect of soaking time on oil recovery
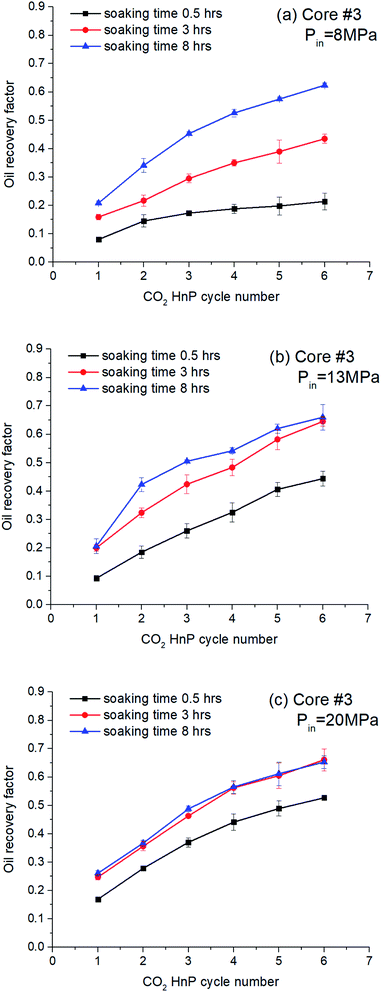
It takes some time for CO2 to dissolve into the crude oil after injected into the reservoir. Therefore, a period of shut-in time called soaking time is required after gas injection. Too short the soaking time will lead to insufficient contact between CO2 and crude oil, which will affect the crude oil swelling. However, if the soaking time is too long, CO2 may diffuse to the reservoir boundary, affecting the energy storage near the area of production well and causing a waste of time. In this section, Core #3 is used to explore the influence of different soaking time on shale oil recovery.The variation of recovery factor with different soaking times of 0.5 h, 3 h, and 8 h under 3 different injection pressures are presented in Fig. 12. These three cases yield the similar trends that the longer the soaking time, the higher the oil recovery factor. The characteristics of low porosity and low permeability of shale cores determine that the substituted crude oil diffuses and flows slowly in the matrix. Comparing with the three figures, we can find that when the injection pressure is low (8 MPa), the oil recovery factor increases as the soaking time increases. However, when the injection pressure becomes higher, the soaking time does not have a significant effect on oil production. It can be found that, when the injection pressure is 20 MPa, the oil produced in different cycles with a soaking time of 3 h is gradually close to that with a soaking time of 8 h. The advantages of long soaking time will gradually lose at high pressure. Therefore, there exists an optimal soaking time in the CO2 HnP EOR method.
4.3. The effect of core permeability and fractures on oil recovery
In these three core samples, Core #2, with a permeability of 2.67 × 10⁻³ μm2, has fractures along the longitudinal section which can be observed from the cross-section of the core. There are no fractures on Core #1 and Core #3. The permeability of Core #1 is 0.034 × 10⁻³ μm2, and the permeability of Core #3 is 0.008 × 10⁻³ μm2. The performances of CO2 HnP after six cycles at different injection pressures are shown in Fig. 13. The core with fractures has an oil recovery more than 17.8% higher than that of matrix cores at injection pressure of 8 MPa. With the injection pressure increases, the advantage of fractures become more obvious. When the injection pressures are 13 MPa and 20 MPa, the oil recovery factors are more than 20.4% and 24.3% than that without fractures. It illustrates that fractures play an important role in enhancing recovery efficiency during CO2 HnP process. For the two cores without fractures, the difference of oil recovery is not significant (less than 3%) as the increase of the matrix permeability. Fig. 14 presents the oil recovery factor at different HnP cycles at an injection pressure of 20 MPa for these three core samples. It indicates that the oil recovery factor difference comes from the first HnP cycle. In the subsequent cycle, fractures do not contribute much to the oil recovery. Thus, it indicates that the oil in fractures has small flow resistance due to the high fracture conductivity. During the CO2 HnP process, the oil in the fractures with low resistance will be produced first. Then the oil in the pores will flow into the fracture and be displaced out in the following HnP cycles.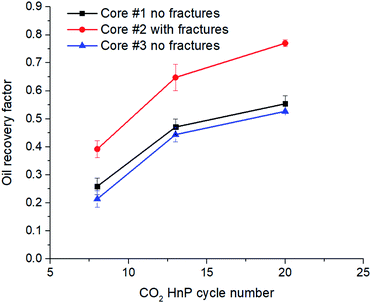 | ||
| Fig. 13 Matrix permeability and fracture effect on CO2 huff-n-puff performance at different injection pressures (six HnP cycles, soaking time = 0.5 h). | ||
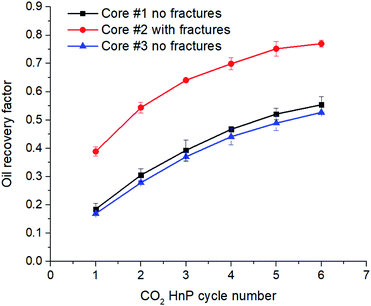 | ||
| Fig. 14 Matrix permeability and fracture effect on CO2 huff-n-puff performance at different HnP cycle (P = 20 MPa, soaking time = 0.5 h). | ||
4.4. The effect of miscible condition on oil recovery
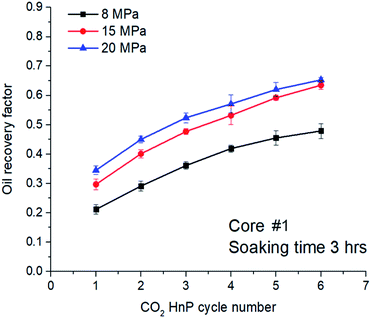
The measured minimum miscible pressure of CO2 and crude oil was 12.75 MPa. The tests were conducted on Core #1 at a soaking time of 3 h Fig. 15 shows the final oil recovery factor of Core #1 after 6 HnP cycles under different operating pressures. By observing the changes of oil recovery factor under different conditions including immiscible (8 MPa), near miscible (13 MPa) and miscible (20 MPa), we can obtain that the oil recovery factors change significantly when the operating conditions vary from immiscible to miscible. The oil recovery factor was 29.7% in the first HnP cycle when CO2 injected at 13 MPa, and 63.7% of the oil was produced at the end of 6 HnP cycles. However, when the injection pressure was 8 MPa, the maximum oil recovery factor achieved for each cycle is much lower than that near miscible condition. Table 4 presents the oil recovered in each of the HnP cycle under three different conditions. It indicates that the increase rate of oil recovered gradually slowed down in the subsequent cycle compared with the previous one. In the last three cycles, the recovery rate gradually decreased. It can be seen that when the HnP cycle increases under miscible condition, the high pressure gradually loses its advantage. Thus, miscible condition is favorable for enhancing oil recovery than immiscible conditions. During the CO2 HnP process, there are three ways of material exchange exist: the injected CO2 will selectively take up components from the oil phase (vaporizing mechanism), the oil may take up components from the gas phase (condensing mechanism), or both oil and gas may take up components from the other phase (combined vaporizing and condensing drive).45 In the immiscible condition, both gas phase and oil phase are present, the gas will have a higher mobility than the oil phase, and this may possibly lead to a gas breakthrough, which means the major part of the production will consist of gas. While, under miscible condition, only one phase is presented in the reservoir, which is advantageous for oil production.45| HnP cycle number | Injection pressure | ||
|---|---|---|---|
| 8 MPa | 13 MPa | 20 MPa | |
| Cycle 1 | 21.2 | 29.7 | 34.5 |
| Cycle 2 | 7.9 | 10.4 | 10.5 |
| Cycle 3 | 7.0 | 7.6 | 7.4 |
| Cycle 4 | 5.8 | 5.5 | 4.7 |
| Cycle 5 | 3.61 | 6 | 4.9 |
| Cycle 6 | 2.39 | 4.3 | 3.3 |
4.5. The microscopic oil production process with NMR tests
By comparing and analyzing the NMR T2 spectrum of microscopic residual oil distribution at the end of different CO2 HnP cycles, the residual oil production with different pore sizes and its contribution to enhancing oil recovery can be obtained. Fig. 16 shows that there are two wave crests in the three core samples. The two wave crests in the spectrum of Core #1 indicate that the pores in Core #1 mainly consist of two sizes of pores. The crest on the left represents micropores and small pores, and the crest on the right represents relatively large pores. The higher the permeability, the larger the amplitude of right wave crest and the larger proportion of larger pore size. The spectrum of Core #2 has two crests, but there is little transition between the two crests. Moreover, the second wave crest is distributed around T2 relaxation time equals 100, indicating that right wave crest represents macropores which are fractures. The matrix of Core #2 was relatively homogeneous, with T2 relaxation time ranging from 0.1 to 2. Core #3 is also homogeneous with most of the oil is distributed on the left wave crest. While the amplitude of the right wave crest is small, indicating that the core is mainly composed of micro pores, with a few mesopores and macropores.During the CO2 HnP production, the distribution curve T2 spectrum gradually moves downward to the left, indicating that crude oil in the large pores comes out first, which is consistent with the study by Ma et al. (2019). The oil recovered in the first cycle was dominated by macropores and mesopores, followed by small pores. With the increase of the number of cycles, most of the removable oil in macropores and mesopores has been produced, the oil in small pores and micropores become the main oil-producing area.
4. Conclusions
In this study, the interaction of CO2 and formation oil was discussed, and a series of experiments were conducted on the improvement of shale oil production by CO2 HnP injection. Here, we summarize the main conclusions based on the experimental results.(1) The purpose of CO2 HnP is to keep the reservoir pressure high and influences the oil/gas phase equilibrium in the reservoir. The interactions of CO2 and formation crude oil include oil viscosity decline, oil swelling, saturation pressure and critical pressure increasing, which are all beneficial to shale oil production.
(2) The parameters affecting CO2 HnP EOR performance include reservoir properties such as matrix permeability, induced fractures, and operation parameters such as injection pressure, soaking time, and miscible condition. The influences cannot be determined by one parameter, but needed to synthetically consider other factors together. In general, fracture is the fundamental factor affecting oil recovery as it connects oil and gas seepage channels and improves oil and gas percolate capacity. The injection pressure significantly affects the formation oil and gas displacement conditions including miscible or immiscible states. Soaking time is also influenced by injection pressure in the way that longer soaking time is needed when the injection pressure is low or under immiscible condition. However, the advantages of long soaking time will gradually lose at relatively high pressure. The oil recovery factor increases significantly when the operating conditions vary from immiscible to miscible condition. Upon the discussion in this paper, it is of great significant to determine the operating parameters to achieve a good CO2 HnP EOR performance.
(3) The NMR tests show that the oil production process is dominated by the pore size distribution. The oil in the macropores and mesopores was produced firstly, followed by small pores and micropores. The oil in small pores and micropores become the main oil-producing area in the long term development of shale oil reservoirs.
Conflicts of interest
There are no conflicts to declare.Acknowledgements
The work is supported by the Province Natural Science Foundation of Shandong (ZR2018BEE018), the National Natural Science Foundation of China (51904324, 51974348), China Postdoctoral Science Foundation (2018M630813, 2019T120616), the Fundamental Research Funds for the Central Universities (18CX02170A), the Postdoctoral Applied Research Project Foundation of Qingdao city (BY201802003), and the Funding for Scientific Research of China University of Petroleum East China (YJ20170013).References
- X. Tong, G. Zhang, Z. Wang, Z. Wen, Z. Tian, H. Wang, F. Ma and Y. Wu, Distribution and potential of global oil and gas resources, Petrol. Explor. Dev., 2018, 45(04), 219–229 CrossRef.
- M. M. Xue, G. Wu and Q. Wang, et al., Socioeconomic impacts of a shortage in imported oil supply: case of China, Natural Hazards, 2018, 1–16 Search PubMed.
- C. Peter, N. J. Felipe and T. Lanardonne, et al., Across the universe of shale resources—a comparative assessment of the emerging legal foundations for unconventional energy, The Journal of World Energy Law & Business, 2018, 11(4), 283–321 Search PubMed.
- American Association of Petroleum Geologists, Energy Minerals Division, Unconventional Energy Resources: 2017 Review, Nat. Resour. Res., 2019, 28(4), 1661–1751 CrossRef.
- B. Jia, J. S. Tsau and R. Barati, A review of the current progress of CO2 injection EOR and carbon storage in shale oil reservoirs, Fuel, 2019, 236, 404–427 CrossRef CAS.
- L. Li, J. J. Sheng and Y. Su, et al., Further investigation of effects of injection pressure and imbibition water on CO2 huff-n-puff performance in liquid-rich shale reservoirs, Energy Fuels, 2018, 32(5), 5789–5798 CrossRef CAS.
- L. Jin, S. Hawthorne and J. Sorensen, et al., Advancing CO2 enhanced oil recovery and storage in unconventional oil play–experimental studies on Bakken shales, Appl. Energy, 2017, 208, 171–183 CrossRef CAS.
- T. Wan and Z. Mu, The use of numerical simulation to investigate the enhanced Eagle Ford shale gas condensate well recovery using cyclic CO2 injection method with nano-pore effect, Fuel, 2018, 233, 123–132 CrossRef CAS.
- R. Simon and D. J. Graue, Generalized correlations for predicting solubility, swelling and viscosity behavior of CO2-crude oil systems, J. Pet. Technol., 1965, 17(1), 102–106 CrossRef CAS.
- J. J. Dooley, R. T. Dahowski and C. L. Davidson, The potential for increased atmospheric CO2 emissions and accelerated consumption of deep geologic CO2 storage resources resulting from the large-scale deployment of a ccs-enabled unconventional fossil fuels industry in the U.S, Int. J. Greenhouse Gas Control, 2009, 3(6), 720–730 CrossRef CAS.
- E. M. Winter and P. D. Bergman, Availability of depleted oil and gas reservoirs for disposal of carbon dioxide in the United States, Energy Convers. Manage., 1993, 34(9–11), 1177–1187 CrossRef CAS.
- J. W. Choi, J. P. Nicot and S. A. Hosseini, et al., CO2 recycling accounting and EOR operation scheduling to assist in storage capacity assessment at a U.S. gulf coast depleted reservoir, Int. J. Greenhouse Gas Control, 2013, 18, 474–484 CrossRef CAS.
- B. Iraji, S. R. Shadizadeh and M. Riazi, Experimental investigation of CO2 huff and puff in a matrix-fracture system, Fuel, 2015, 158, 105–112 CrossRef CAS.
- C. Song and D. Yang, Experimental and numerical evaluation of CO2 huff-n-puff processes in Bakken formation, Fuel, 2017, 190, 145–162 CrossRef CAS.
- S. Sharma, J. J. Sheng and Z. Shen, A comparative experimental study of huff-n-puff gas injection and surfactant treatment in shale gas-condensate cores, Energy Fuels, 2018, 32(9), 9121–9131 CrossRef CAS.
- J. Ma, X. Wang and R. Gao, et al., Enhanced light oil recovery from tight formations through CO2 huff ‘n’puff processes, Fuel, 2015, 154, 35–44 CrossRef CAS.
- R. Sun, W. Yu and F. Xu, et al., Compositional simulation of CO2 huff-n-puff process in middle bBakken tight oil reservoirs with hydraulic fractures, Fuel, 2019, 236, 1446–1457 CrossRef CAS.
- M. Tang, H. Zhao and H. Ma, et al., Study on CO2 huff-n-puff of horizontal wells in continental tight oil reservoirs, Fuel, 2017, 188, 140–154 CrossRef CAS.
- X. Zhou, Q. Yuan and X. Peng, et al., A critical review of the CO2 huff ‘n’puff process for enhanced heavy oil recovery, Fuel, 2018, 215, 813–824 CrossRef CAS.
- G. Lv, L. Qi, S. Wang and X. Li, Key techniques of reservoir engineering and injection-production process for CO2 flooding in China's sinopec shengli oilfield, J. CO2 Util., 2015, 11, 31–40 CrossRef CAS.
- H. Ziguo, Integrated techniques of underground CO2 storage and flooding put into commercial application in the jilin oilfield, China, Acta Geol. Sin., 2012,(1), 285 Search PubMed.
- C. Bardon, P. Corlay and D. Longeron, et al., CO2 huff-n-puff revives shallow light-oil-depleted reservoirs, SPE Reservoir Eng., 1994, 9(2), 92–100 CrossRef CAS.
- J. Thomas, T. V. Berzins and T. G. Monger, et al., Light oil recovery from cyclic CO2 injection: influence of gravity segregation and remaining oil, SPE Annu. Tech. Conf. Exhib., 1990 Search PubMed , SPE-20531-MS.
- B. J. Miller, C. P. Bardon and P. Corlay, CO2 huff 'n' puff field case: five-year program update, SPE Permian Basin Oil Gas Recovery Conf., 1994 Search PubMed , SPE-27677-MS.
- F. Torabi and K. Asghari, Effect of operating pressure, matrix permeability and connate water saturation on performance of CO2 huff-and-puff process in matrix-fracture experimental model, Fuel, 2010, 89, 2985–2090 CrossRef CAS.
- L. Li, Y. Zhang and J. J. Sheng, Effect of the Injection Pressure on Enhancing Oil Recovery in Shale Cores during the CO2 Huff-n-Puff Process When It Is above and below the Minimum Miscibility Pressure, Energy Fuels, 2017, 31(4), 3856–3867 CrossRef CAS.
- K. Zhang, Experimental and numerical investigation of oil recovery from Bakken formation by miscible CO2 injection, SPE Annu. Tech. Conf. Exhib., 2016 Search PubMed , SPE-184486-STU.
- Y. Zhang, W. Yu and Z. Li, et al., Simulation study of factors affecting CO2 huff-n-puff process in tight oil reservoirs, J. Pet. Sci. Eng., 2018, 163, 264–269 CrossRef CAS.
- C. Song & D. Yang, Performance evaluation of CO2 huff-n-puff processes in tight oil formations, SPE Unconventional Resources Conference Canada, Calgary, Alberta, 5–7 Nov 2013 Search PubMed.
- T. D. Gamadi, J. J. Sheng, M. Y. Soliman; et al., An experimental study of cyclic CO2 injection to improve shale oil recovery, SPE Improved Oil Recovery Symposium, Tulsa, Oklahoma, USA, 12–16 April 2014 Search PubMed.
- L. Li and J. ,J. Sheng, Numerical analysis of cyclic CH4 injection in liquid-rich shale reservoirs based on the experiments using different-diameter shale cores and crude oil, J. Nat. Gas Sci. Eng., 2017, 39, 1–14 CrossRef.
- Y. Yu, L. Li and J. J. Sheng, Further discuss the roles of soaking time and pressure depletion rate in gas huff-n-puff process in fractured liquid-rich shale reservoirs, SPE Annu. Tech. Conf. Exhib., 2016 Search PubMed.
- L. Li, Y. Su and Y. Hao, et al., A comparative study of CO2 and N2 huff-n-puff EOR performance in shale oil production, J. Pet. Sci. Eng., 2019, 181, 106174 CrossRef CAS.
- H. H. Hsu and R. J. Brugman, CO2 huff-puff simulation using a compositional reservoir simulator, SPE Annu. Tech. Conf. Exhib., 1986 Search PubMed.
- B. T. Hoffman, Comparison of various gases for enhanced recovery from shale oil reservoirs. SPE Improved Oil Recovery Symposium, Tulsa, Oklahoma, 14–18 April 2012 Search PubMed.
- W. Yu, H. R. Lashgari, K. Wu and K. Sepehrnoori, CO2 injection for enhanced oil recovery in Bakken tight oil reservoirs, Fuel, 2015, 159, 354–363 CrossRef CAS.
- Z. Meng, S. Yang and L. Wang, et al., Investigation on numerical simulation of CO2 huff and puff in tight oil reservoirs, J. of Petrochem. Univ., 2016, 29(6), 39–42 Search PubMed.
- J. Sun, A. Zou and E. Sotelo, et al., Numerical simulation of CO2 huff-n-puff in complex fracture networks of unconventional liquid reservoirs[J], J. Nat. Gas Sci. Eng., 2016, 31, 481–492 CrossRef CAS.
- P. Zuloagamolero, W. Yu and Y. Xu, et al., Simulation Study of CO2-EOR in tight oil reservoirs with complex fracture geometries, Sci. Rep., 2016, 6, 33445 CrossRef CAS.
- Z. Yuan, Y. Wei and Z. Li, et al. Simulation study of factors affecting CO2 huff-n-puff process in tight oil reservoirs, J. Pet. Sci. Eng., 2018, 163, 264–269 CrossRef.
- L. Sheng and L. Peng, Experimental and simulation determination of minimum miscibility pressure for a Bakken tight oil and different injection gases, Petroleum, 2017, 3(1), 79–86 CrossRef.
- J. J. Sheng, Critical review of field EOR projects in shale and tight reservoirs, J. Pet. Sci. Eng., 2017, 159, 654–665 CrossRef CAS.
- Zh. Li, Y. Sun and R. Hu, et al., Quantitative analysis for nanopore structure characteristics of shales using NMR and NMR cryoporometry, J. Eng. Geol., 2018, 26(3), 758–766 Search PubMed.
- Q. Ma, Sh. Yang and D. Lv, et al., Experimental investigation on the influence factors and oil production distribution in different pore sizes during CO2 huff-n-puff in an ultra-high-pressure tight oil reservoir, J. Pet. Sci. Eng., 2019, 178, 1155–1163 CrossRef CAS.
- K. S. Pedersen & P. L. Christensen, Phase behavior of petroleum reservoir fluids, CRC Press, 2007 Search PubMed.
| This journal is © The Royal Society of Chemistry 2019 |

