 Open Access Article
Relation between the particle size and release characteristics of aromatic melamine microcapsules in functional textile applications
Hongbin Zhao a,
Xuening Fei
 *ab,
Lingyun Caob,
Baolian Zhangc and
Xin Liud
aSchool of Chemical Engineering and Technology, Tianjin University, Tianjin 300350, China. E-mail: xueningfei@126.com
bSchool of Science, Tianjin Chengjian University, Tianjin 300384, China
cSchool of Materials Science and Engineering, Tianjin Chengjian University, Tianjin 300384, China
dTianjin AnYing Bioengineering Technology Co., Ltd., Tianjin 300384, China
First published on 13th August 2019
Abstract
The relation between the particle size and release characteristics of aromatic microcapsules with a melamine resin shell in functional textile applications have been investigated. Firstly, the microcapsules are characterized based on their Fourier transform infrared spectra, encapsulation efficiencies, particle size distributions, optical images, and scanning electron microscopy images. The impregnation performances of the microcapsules have been initially evaluated using image analysis. Subsequently, the impregnation efficiency and broken release characteristics are semi-quantitatively analyzed using solid-phase microextraction-gas chromatography-mass spectrometry. The analysis results show that the highest impregnation efficiency and broken release intensity could be observed when the microcapsule size was similar to the fiber diameter (25–30 μm). Eventually, the sustained release of the microcapsules over a period of 2400 h was evaluated using the weighing calculation method, and the trends were studied using the Peppas model. It was found that the microcapsule release rate slowly and continuously decreased with time, and the release rates significantly increased with the decrease in microcapsule particle size. Thus, it could be concluded that the large microcapsules exhibited better leak tightness than the small microcapsules, whereas the small microcapsules exhibited faster sustained release rates.
1 Introduction
Microencapsulation, as a protective technique designed to seal active ingredients within micro-scale particles, is widely considered to be an excellent delivery method for functional materials. Therefore, it is applied in several fields, including perfumes/fragrances,1,2 antimicrobial agents,3 medicine,4,5 pigments,6,7 phase-change materials,8,9 self-healing materials,10,11 flame retardants,12 damage sensing,13 and lubricants.14 The release and delivery properties are the most critical functions of the microcapsules in several applications, and these characteristics have attracted extensive attention, especially in the health care and cleaning product industries. Various methods, including thermal gravimetric analysis,15 electronic nose,2 fluorescence microscopy,16 gas chromatography with flame ionization detection (GC-FID),1 high-performance liquid chromatography,17 Fourier transform infrared (FTIR) spectroscopy,18 and mathematical fitting,19–21 have been applied to study the release and delivery properties of the microcapsules.The particle size significantly affects the properties of microcapsules. Therefore, the control of microcapsule size has been extensively investigated in previous studies.15,22 However, there are still some problems which need to be clarified in the relationship between particle size and release behaviors of microcapsule.
In this study, we prepared aromatic melamine microcapsules with different particle sizes based on our previously developed method22 and characterized the microcapsules based on their FTIR spectra, encapsulation efficiencies (E%), particle size distributions, optical images, and scanning electron microscopy (SEM) images. Further, cotton fabrics were finished with prepared microcapsules, and their impregnation performances were initially investigated using image analysis. The impregnation efficiency and broken release characteristics of the microcapsules under the external force were semi-quantitatively analyzed using solid-phase microextraction gas chromatography-mass spectrometry (SPME-GC-MS). Finally, the sustained release behavior of the microcapsules over a period of 2400 h were evaluated using the weighing calculation method. The sustained release data were fitted using a mathematical model, and the effects of particle size were discussed.
2 Material and methods
2.1 Materials
Methanol-modified melamine-formaldehyde (MMF) pre-polymer, the shell material, was purchased from Honisite Chemical Trade Co., Ltd. (Tianjin, China). The core material essence oil (Rose® 7289) was supplied by Double Horse Flavor and Fragrance Trade Co., Ltd. (Tianjin, China). The dispersant was styrene maleic anhydride (SMA) copolymer (Scripset® 520, Hercules, USA). Acetic acid (50 wt%) and sodium hydroxide (NaOH) were purchased as analytical reagents (Tianjin Kermel Chemical Reagent Development Center, China). The properties of the fabric substrate used in this study are presented in Table 1.| Style | Weave | Weight (g m−2) | Thickness (mm) | Width (mm) | Length (mm) |
|---|---|---|---|---|---|
| Cotton | Plain | 156 | 0.4 | 6 | 18 |
2.2 Preparation of MMF microcapsules
Microcapsules containing essence oil were prepared via in situ polymerization using MMF as the shell material. The essence oil (20 g), 10 wt% SMA aqueous solution (20 g) and deionized (DI) water (45 g) were mixed and mechanically emulsified. The prepared emulsion was poured into four-neck round-bottomed flask equipped with the reflux condenser and PTFE anchor stirrer, and the MMF pre-polymer (8.5 g) dissolved in DI water (6.5 g) was added. The emulsion pH was adjusted to 4 by 50 wt% acetic acid aqueous solution (AS), and the temperature was slowly increased to 75 °C. After 1.5 h polymerization, the solution pH was adjusted to 7 with 30 wt% NaOH AS, and obtained the microcapsule samples. Detailed particle size control methods reference to our previous study.222.3 Impregnation of the microcapsules on fabric substrates
The prepared aromatic microcapsule emulsion (2 g) and DI water (198 g) were mixed in a 500 mL glass beaker to produce a fabric finishing agent (1.0 wt%). The fabric substrate (Table 1) was subsequently impregnated in a solution for 10 min at 25 °C. After removing the fabric from the solution, the fabric was completely dried in an air-circulating oven at 50 °C.2.4 Characterization
 | (1) |
| Mcore = (M1 − M0)(α + β) − (M1 − M2) | (2) |
 | (3) |
 | (4) |
 | (5) |
GC-MS was performed using a 6890N Network GC system with a 5975 inert mass-selective detector (Agilent Technologies Inc.) equipped with an HP-5 column (60 m × 0.25 mm, 0.25 μm). The carrier gas was high-purity helium that was flowed at a constant rate of 1 mL min−1 and a split ratio of 10![[thin space (1/6-em)]](https://www.rsc.org/images/entities/char_2009.gif) :
:![[thin space (1/6-em)]](https://www.rsc.org/images/entities/char_2009.gif) 1. The oven temperature was maintained at 50 °C for 4.5 min, heated to 260 °C at a rate of 3 °C min−1, heated to 270 °C at a rate of 10 °C min−1, and maintained at 270 °C for 10 min. MS was operated in the electron impact ionization mode (70 eV), and the interface, source, and quadrupole temperatures were set as 280 °C, 230 °C, and 150 °C, respectively. The mass range was 33–320 m/z.
1. The oven temperature was maintained at 50 °C for 4.5 min, heated to 260 °C at a rate of 3 °C min−1, heated to 270 °C at a rate of 10 °C min−1, and maintained at 270 °C for 10 min. MS was operated in the electron impact ionization mode (70 eV), and the interface, source, and quadrupole temperatures were set as 280 °C, 230 °C, and 150 °C, respectively. The mass range was 33–320 m/z.
The resulting mass spectra were analyzed by manual spectral analysis based on the NIST11 library and a self-built library to identify the compounds. Further, the volatile compounds were quantified based on the comparison of the GC peak heights.
3 Results and discussion
3.1 Microcapsule characterization
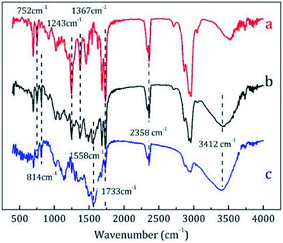
![[double bond, length as m-dash]](https://www.rsc.org/images/entities/char_e001.gif) O stretching vibration, C–H deformation vibration, C–O stretching vibration, and deformation vibration of ortho-substituted phenyl ring, respectively. In curve c, the peaks at 814 and 1558 cm−1 corresponded to the bending vibrations of triazine ring and they were the characteristic peaks of MF resins.23 The peak at 2358 cm−1 indicates unreacted –CN groups, whereas the strong and wide peak at approximately 3412 cm−1 indicated the superposition of O–H and N–H stretching vibrations. All these absorption peaks could be found in curve b, demonstrating that the core material was successfully encapsulated by MMF resin.
O stretching vibration, C–H deformation vibration, C–O stretching vibration, and deformation vibration of ortho-substituted phenyl ring, respectively. In curve c, the peaks at 814 and 1558 cm−1 corresponded to the bending vibrations of triazine ring and they were the characteristic peaks of MF resins.23 The peak at 2358 cm−1 indicates unreacted –CN groups, whereas the strong and wide peak at approximately 3412 cm−1 indicated the superposition of O–H and N–H stretching vibrations. All these absorption peaks could be found in curve b, demonstrating that the core material was successfully encapsulated by MMF resin.
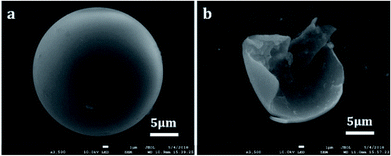 | ||
| Fig. 3 SEM images denoting the morphology of the prepared microcapsules: (a) as-prepared microcapsule and (b) broken microcapsule. | ||
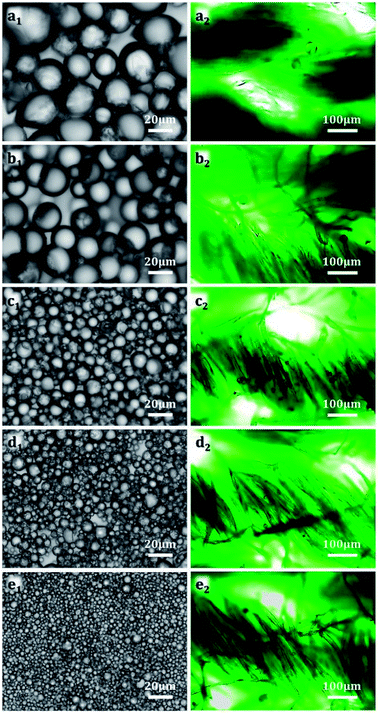
Table 2 presents the D50, P, and E% values of the microcapsule samples. Microcapsule samples 1–5 exhibited different average particle sizes, narrow size distributions, and high coating efficiencies. The corresponding optical morphologies are denoted in Fig. 4a1–e1. The samples were relatively uniform throughout the large optical field.
| Sample | D50 (μm) | P | E% |
|---|---|---|---|
| a | 37.69 | 1.19 | 89.25% |
| b | 32.91 | 1.13 | 90.35% |
| c | 23.65 | 1.26 | 86.06% |
| d | 12.01 | 1.31 | 85.40% |
| e | 6.67 | 1.16 | 86.52% |
3.2 Fabric application efficiency and broken release characteristics of microcapsules
The microcapsule size affected the positions of the microcapsules on the fabrics, which will affect the impregnation efficiency. The large microcapsules were inserted at the intersections of fiber bundles (threads), as depicted in Fig. 4a2 and b2. In case of the small microcapsules, the microcapsules tended to be adsorbed and stably fixed between individual fibers because of dimension matching. The availability of suitable spaces for microcapsule attachment increased with decreasing particle size, causing an increase in the impregnation efficiency (Fig. 4c2). When the particle size of microcapsules became smaller than the fiber diameter (Fig. 4d2 and e2), it was difficult for the microcapsules to remain between the threads or fibers, and microcapsules were more likely to adhere to the surfaces of single fibers, decreasing the impregnation efficiency.
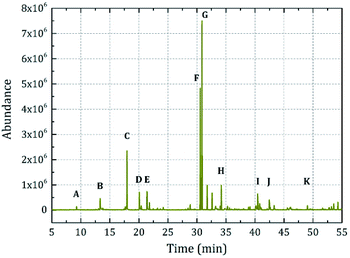
Fig. 5 denotes the chromatographic elution curve of the fabric treated using microcapsule sample 1. The following peaks are marked in the curve: A, ethyl-2-methylbutyrate; B, ethyl 2-methylvalerate; C, 1,8-cineole; D, dihydromyrcenol; E, tetrahydrolinalool; F, isobornyl acetate; G, 4-tert-butylcyclohexyl acetate; H, 3,5,5-trimethylhexyl acetate; I, tricyclodecenyl propionate; J, isoamyl salicylate; and K, α-hexylcinnamaldehyde. The elution curve was similar to that of the microcapsules prepared in a non-ionic system in our previous study.24 The results indicated that the core material could be finely encapsulated and highly restored the release characteristics.
To minimize the error and reduce the peak interference, 1,8-eucalyptol was selected as the characteristic substance in the core material based on the suggestion of perfumers. The mass spectrum of 1,8-eucalyptol was depicted in Fig. 6I.
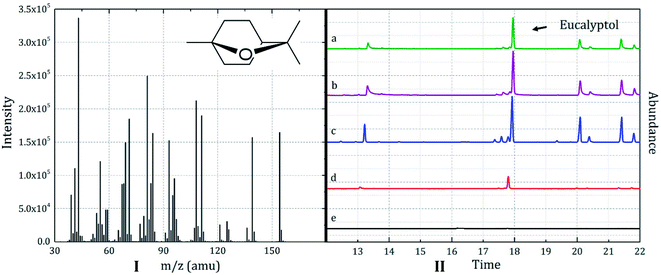 | ||
| Fig. 6 (I) Mass spectra of 1,8-eucalyptol in the core material and (II) SPME-GC-MS elution curves of the fabrics treated by (a) sample 1, (b) sample 2, (c) sample 3, (d) sample 4, and (e) sample 5. | ||
The SPME-GC-MS elution curves of the fabrics treated using the microcapsule samples 1–5 are depicted in Fig. 6II. The elution time of 1, 8-eucalyptol was approximately 17.9 min under the selected conditions. Because the selected characteristic peak often overlaps with the peak of D-limonene (the smaller one on its left side), it was difficult to express the intensity of 1,8-eucalyptin by peak area. Thus, the peak height was selected as the semi-quantitative factor.
The curves a, b, and c in Fig. 6II, which correspond to the fabrics finished by microcapsules with D50 = 37.69, 32.91, and 23.65 μm, respectively, showed strong peak intensity. The peak intensity of curve d (D50 = 12.01 μm) was low, whereas curve e (D50 = 6.67 μm) showed little scent characteristic. Because the E% values of different samples were similar, no significant difference could be observed between the core material loadings of the samples. Thus, the microcapsule impregnation efficiency was the major factor affecting the flavor release characteristics. No additives were used in this study to enhance the contact and adhesion between the microcapsules and the fabric substrate during impregnation; therefore, the microcapsules were mainly embedded and adsorbed onto the fabric. Based on Fig. 7, which denoted the peak height as a trend line of the particle size, and the discussion in Section 3.2.1, it could be conclude that the impregnation efficiency was dependent on the microcapsule particle size. As depicted in Fig. 7, the microcapsule particle size corresponding to the maximum peak height was approximately 25–30 μm. The diameter of a single fiber in the fabric substrate was also approximately 25–30 μm, implying the maximization of the impregnation efficiency when the dimensions of the fibers and microcapsules were similar. This result could complement the phenomenon obtained by human sniffing (the human sniffing can clearly identify a 6.67 μm microcapsule-finished fabric sample with a light flavor odor even though it is difficult to distinguish between the odor intensities of samples b and c).
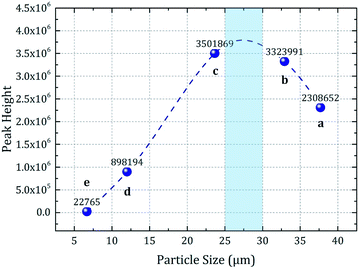 | ||
| Fig. 7 Relation between the peak height of the SPME-GC-MS characteristic peak and the average microcapsule particle size. | ||
All these results indicate that the selection of a suitable microcapsule size can improve the microcapsule performances in textile functional finishing. When the microcapsule and fiber sizes are similar, the microcapsules will easily and strongly adsorb onto the fabric, even in the absence of adhesives. Removing the need for binders in textile functional finishing will be helpful to improve the odor/function refreshing and feel of the textile.
3.3 Sustained release behaviours of microcapsules having different particle sizes
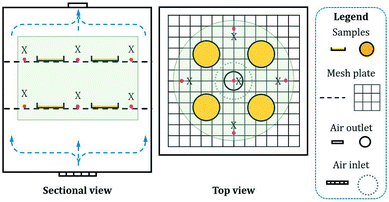
Sustained release is another important property of microcapsules. The sustained release of microcapsules in air is based on the permeation and migration of core material into shell along with its diffusion on shell surface. Therefore, the microcapsule particle size significantly influences the sustained release characteristics.The prepared microcapsules having different particle sizes were placed in an air-circulating oven to simulate the dynamic release conditions of actual application. After 2400 h, the release rate (rate of core material mass loss) was obtained (Fig. 8). The release occurred slowly, and the rate continuously decreased with time. Meanwhile, it significantly increased as the particle size decreased (curves a–e). To further analyze the variations in release rate, we fitted the sustained release data with different models: Higuchi equation, first dynamic equation and Peppas equation. However, in the actual fitting stage, the fitting results of Higuchi equation and first kinetic equation showed a certain deviation from the experimental results. And it was found that the Peppas model was more suitable for sustained release data fitting analysis. Additionally, in our experimental section, the internal air of air-circulating oven (Fig. 1 in 2.4.5) was connected to the atmosphere (an infinitely diluted system), and the equilibrium amount of core material released could be considered to almost 0, which made the traditional equation physically unreasonable. Thus, a deformed Peppas equation was used as shown in eqn (6), and the fitting results were denoted by the dashed lines in Fig. 8 and Table 3.
| y = 100 − atk | (6) |
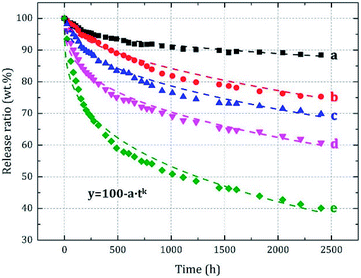 | ||
| Fig. 8 The sustained release data and fitting curves for microcapsules having different particle sizes. | ||
| Sample | a | k | Adj. R2 |
|---|---|---|---|
| a | 0.5367 | 0.3986 | 0.9704 |
| b | 0.4098 | 0.5286 | 0.9836 |
| c | 1.1079 | 0.4281 | 0.9803 |
| d | 2.7217 | 0.3453 | 0.9837 |
| e | 5.5378 | 0.3087 | 0.9760 |
According to the Adj. R2 values, the Peppas model provided a good fit with the original data trend and can be used to predict the sustained release characteristics of the microcapsules. Value k is the diffusional exponent related to the type of release behaviors and mechanisms as Fickian diffusion (k = 0.5), anomalous diffusion (0.5 < k < 1.0), or non-Fickian diffusion (k = 1.0).18,25–28 In this study, the k values of samples a and c–e were less than 0.5, which illustrated that their release mechanisms were Fickian. This was due to the melamine resin microcapsule shell belonged to an insoluble and infusible three-dimensional cross-linked polymer, and the release environment was also an infinitely diluted system. The k value of sample b was 0.5286, which belonged to the non-Fickian diffusion from the mathematical point of view, but we believed that this was caused by the test and fitting error or deviation,29–31 and it should actually be the Fickian diffusion mechanism too.
The predicted release characteristics over a period of one year are denoted in Fig. 9. The core material of the microcapsule sample having a small particle size (D50 = 6.67 μm) was predicted to be substantially depleted after one year of sustained release, whereas the sample with a large particle size (D50 = 37.69 μm) released only approximately 10% of the core material. Thus, the large microcapsules showed better leak tightness and the small microcapsules exhibited a faster sustained release rate, indicating the microcapsules with different particle sizes having different application potentials.
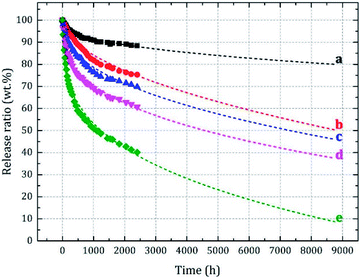 | ||
| Fig. 9 Predicted sustained release characteristics of microcapsules having different particle sizes. | ||
4 Conclusions
In this study, the prepared MMF shell aromatic microcapsules were applied in textile functional finishing. After basic characterization, the relation between the microcapsule size and impregnation efficiency was evaluated by microscopic image analysis. And the SPME-GC-MS analysis indicated that the fabrics finished using microcapsules having an average particle size of 25–30 μm exhibited the optimal broken release performance among the synthesized microcapsules. The results denoted that the selection of a suitable microcapsule size can improve microcapsule performances in textile functional finishing. When the microcapsule size and fabric fiber diameter were similar, the highest impregnation efficiency and broken release intensity could be obtained.The relation between the microcapsule size and sustained release behavior was also analyzed based on the sustained release curves. The sustained release data were observed to fit well with the Peppas model. Further, the release of core material from microcapsules was slow, and the release rate decreased with time. Particularly, the release rate increased as the microcapsule size decreased. Thus, the large microcapsules showed better leak tightness, whereas the small microcapsules exhibited a faster sustained release rate.
We believe that controlling the release characteristics of microcapsules by adjusting the particle size is a simpler, more adaptable and targeted strategy.
Conflicts of interest
There are no conflicts to declare.Acknowledgements
The present study was financially supported by the National Natural Science Foundation of China, grant numbers 51703155, 51578360, 51778398, 51703154.References
- M. A. Teixeira, O. Rodríguez, S. Rodrigues, I. Martins and A. E. Rodrigues, AIChE J., 2012, 58, 1939–1950 CrossRef CAS.
- A. Sansukcharearnpon, S. Wanichwecharungruang, N. Leepipatpaiboon, T. Kerdcharoen and S. Arayachukeat, Int. J. Pharm., 2010, 391, 267–273 CrossRef CAS PubMed.
- S. Ghayempour and M. Montazer, J. Microencapsulation, 2016, 33, 497–510 CrossRef CAS PubMed.
- K. Son, D. I. Yoo and Y. Shin, Chem. Eng. J., 2014, 239, 284–289 CrossRef CAS.
- C. Wang, W. Ye, Y. Zheng, X. Liu and Z. Tong, Int. J. Pharm., 2007, 338, 165–173 CrossRef CAS PubMed.
- C. Lin, Y. Li, M. Yu, P. Yang and J. Lin, Adv. Funct. Mater., 2007, 17, 1459–1465 CrossRef CAS.
- S. Fu, C. Xu, C. Du, A. Tian and M. Zhang, Colloids Surf., A, 2011, 384, 68–74 CrossRef CAS.
- P. Sánchez, M. V. Sánchez-Fernandez, A. Romero, J. F. Rodríguez and L. Sánchez-Silva, Thermochim. Acta, 2010, 498, 16–21 CrossRef.
- T. Khadiran, M. Z. Hussein, Z. Zainal and R. Rusli, Sol. Energy Mater. Sol. Cells, 2015, 143, 78–98 CrossRef CAS.
- S. R. White, N. R. Sottos, P. H. Geubelle, J. S. Moore, M. R. Kessler, S. R. Sriram, E. N. Brown and S. Viswanathan, Nature, 2001, 409, 794–797 CrossRef CAS PubMed.
- D. Sun, G. Sun, X. Zhu, A. Guarin, B. Li, Z. Dai and J. Ling, Adv. Colloid Interface Sci., 2018, 256, 65–93 CrossRef CAS PubMed.
- N. Wang, Y. Wu, L. Mi, J. Zhang, X. Li and Q. Fang, J. Therm. Anal. Calorim., 2014, 118, 349–357 CrossRef CAS.
- A. Lavrenova, J. Farkas, C. Weder and Y. C. Simon, ACS Appl. Mater. Interfaces, 2015, 7, 21828–21834 CrossRef CAS PubMed.
- Y. Ma, Z. Li, H. Wang and H. Li, J. Colloid Interface Sci., 2019, 534, 469–479 CrossRef CAS.
- X. Fei, H. Zhao, B. Zhang, L. Cao, M. Yu, J. Zhou and L. Yu, Colloids Surf., A, 2015, 469, 300–306 CrossRef CAS.
- R. Mercadé-Prieto, X. Pan, A. Fernández-González, Z. Zhang and S. Bakalis, Ind. Eng. Chem. Res., 2012, 51, 16741–16749 CrossRef.
- B. Peña, C. Panisello, G. Aresté, R. Garcia-Valls and T. Gumí, Chem. Eng. J., 2012, 179, 394–403 CrossRef.
- F. M. Bezerra, O. G. Carmona, C. G. Carmona, M. J. Lis and F. F. de Moraes, Cellulose, 2016, 23, 1459–1470 CrossRef CAS.
- K.-W. Yeh, C. P. Chang, T. Yamamoto and T. Dobashi, Colloids Surf., A, 2011, 380, 152–155 CrossRef CAS.
- K. W. Yeh, C. P. Chang, T. Yamamoto and T. Dobashi, Colloid Polym. Sci., 2012, 290, 1583–1591 CrossRef CAS.
- R. Mercade-Prieto, R. Allen, D. York, J. A. Preece, T. E. Goodwin and Z. Zhang, J. Microencapsulation, 2012, 29, 463–474 CrossRef CAS PubMed.
- H. Zhao, X. Fei, B. Zhang, S. Zhao, G. Li and L. Cao, Particuology, 2019, 43, 38–45 CrossRef CAS.
- F. Salaün and I. Vroman, Eur. Polym. J., 2008, 44, 849–860 CrossRef.
- H. Zhao, X. Fei, L. Cao, B. Zhang and X. Liu, Materials, 2019, 12(3), 393 CrossRef PubMed.
- A. Ebadi, A. A. Rafati, S. Bavafa and M. Mohammadi, Appl. Surf. Sci., 2017, 425, 282–290 CrossRef CAS.
- S. Dash, P. N. Murthy, L. Nath and P. Chowdhury, Acta Pol. Pharm., 2010, 67, 217–223 CAS.
- P. Costa, J. Manuel and S. Lobo, Eur. J. Pharm. Sci., 2001, 13, 123–133 CrossRef CAS.
- S. Cortés-Camargo, P. E. Acuña-Avila, M. E. Rodríguez-Huezo, A. Román-Guerrero, V. Varela-Guerrero and C. Pérez-Alonso, Food Res. Int., 2019, 116, 1010–1019 CrossRef PubMed.
- J. M. Sankalia, M. G. Sankalia and R. C. Mashru, J. Controlled Release, 2008, 129, 49–58 CrossRef CAS PubMed.
- S. Asnaashari, N. S. Khoei, M. H. Zarrintan, K. Adibkia and Y. Javadzadeh, Pharm. Dev. Technol., 2011, 16, 400–407 CrossRef CAS PubMed.
- T. R. J. Heathman, W. R. Webb, J. Han, Z. Dan, G. Q. Chen, N. R. Forsyth, A. J. El Haj, Z. R. Zhang and X. Sun, J. Pharm. Sci., 2014, 103, 2498–2508 CrossRef CAS.
| This journal is © The Royal Society of Chemistry 2019 |

