 Open Access Article
Creative Commons Attribution 3.0 Unported Licence
A noble bimetal oxysulfide CuVOS catalyst for highly efficient catalytic reduction of 4-nitrophenol and organic dyes
Huizhi
Sun
a,
Osman Ahmed
Zelekew
 *b,
Xiaoyun
Chen
 *a,
Yuanbo
Guo
a,
Dong-Hau
Kuo
 *c,
Qingxin
Lu
a and
Jinguo
Lin
*a
aCollege of Materials Engineering, Fujian Agriculture & Forestry University, Fuzhou 350002, China. E-mail: fjchenxy@126.com; fjlinjg@126.com
bDepartment of Materials Science and Engineering, Adama Science and Technology University, Adama, Ethiopia. E-mail: osman.ahmed@astu.edu.et
cDepartment of Materials Science and Engineering, National Taiwan University of Science and Technology, No. 43, Sec. 4, Keelung Road, Taipei 10607, Taiwan. E-mail: dhkuo@mail.ntust.edu.tw
First published on 7th October 2019
Abstract
A novel copper–vanadium bimetallic oxysulfide (CuVOS) nanoparticle catalyst was successfully synthesized by a facile method. The samples were characterized by X-ray photoelectron spectrometry (XPS), X-ray diffractometry (XRD), field-emission scanning electron microscopy (FE-SEM), UV-Vis diffuse spectroscopy (DRS), Fourier transform infrared spectroscopy (FTIR), and N2 adsorption–desorption isotherms. In order to check the catalytic efficiencies toward reduction reaction, 4-nitrophenol (4-NP) and other organic dyes such as rhodamine-B (RhB), methylene blue (MB), and methyl orange (MO) were used. The results showed that the CuVOS prepared in the presence of a suitable amount of N2H4 during the synthesis of the nanoparticles exhibited the fastest reduction capabilities by using NaBH4 as a reducing agent. It was demonstrated that a 100 mL 4-NP (20 ppm) solution was completely reduced by 5 mg CuVOS-3 within 2 min. Moreover, the complete reduction of 100 mL of MO, RhB, and MB solutions of 100 ppm was also achieved by 5 mg CuVOS-3 within 2 min, 6 min, and 5 min, respectively. Hence, the CuVOS is an efficient catalyst for reducing 4-NP and organic dyes and can have great potential for industrial application.
1. Introduction
Recently, the rapid growth of population and industry became the major concern regarding environmental and energy issues.1 In particular, the discharge of toxic nitroaromatic organic compounds used in the manufacturing of pharmaceuticals, pigments, explosives, plastics, pesticides and fungicidal agents is potentially dangerous to humans and the environment.2–4 Among the nitroaromatic compounds, 4-nitrophenol (4-NP) and its derivatives are the most toxic and can be the cause for the damage of the central nervous system, kidney, liver and human blood.5,6 In addition to nitroaromatic compounds, synthetic dyes discharged from different industries such as paper and pulp manufacturing, leather industries, cloth dyeing, and plastics coloring have been used extensively and are also a source of environmental pollution.6–8 Particularly, strong color and pigment dyes discharged into the aquatic system cause serious environmental problems and are also the major concern for water pollution.9–12 Hence the reduction and removal of toxic organic compounds from aquatic environments is a crucial mission.In the recent years, many researchers have tried to remove toxic organic compounds and also decolorize wastewater by using different techniques. Among the methods used, photocatalytic degradation, adsorption, membrane flocculation, filtration, and reduction technological applications are reported by different scholars.13–19 Sun et al. used a carbon microsphere-loaded copper-based catalyst for the degradation of organic dyes in aqueous solution.20 Liu et al. also studied the synthesis of various NiCo2O4 structures to degrade organic dyes under microwave catalysis.21 Zhao et al. studied the photocatalytic degradation of 4-nitrophenol in the presence of H2O2 in a UV-irradiated water dispersion system using TiO2 catalyst doped with different amounts of iron, and systematically explored 1% Fe–TiO2 catalyst.22 Moreover, the catalytic reduction of 4-nitrophenol was also conducted by Zelekew et al. with silica-supported metal oxide-based catalysts.23,24 Elfiad et al. also used hematite to explore the conversion of nitrophenol (4-NP) to 4-aminophenols (4-AP).25 Ajmal et al. also reported the simultaneous catalytic degradation/reduction of multiple toxic organic compounds by modifiable p(methacrylic acid-co-acrylonitrile)–M (M: Cu, Co) microgel catalyst composites.26 The reduction of rhodamine B by using magnetically recyclable Ag–Fe3O4 composite catalyst haven also reported by Ai et al.27 However, the synthesis of the catalyst at low temperature process with efficient and low-cost catalyst for wastewater treatment is still the biggest challenge. Therefore, the development of straight forward methods for preparing efficient catalysts at low temperature is mandatory. Moreover, the existence of bimetallic compound catalyst is expected to enhance the catalytic activities by the synergistic effect.
In our previous work, the synthesis of the Zn(O,S) oxysulfide has been used for hydrogen production.28 The copper-based oxysulfide bimetallic CuNiOS catalysts with the effect of the Cu+/Cu2+ ratio for chromium reduction was also reported by our group. However, there was no report on CuVOS bimetallic catalysts for the removal or reduction of organic compounds. This study aims to synthesize a copper-based bimetallic oxysulfide CuVOS catalyst for the catalytic reduction of toxic organic compounds. The catalytic performance of the catalyst is checked by the reduction of 4-NP and other organic dyes such as MB, MO, and RhB.
2. Experimental
2.1 Synthesis of CuVOS
In a particular procedure, 4.8 g of copper nitrate [Cu(NO3)2·2.5H2O] and 1.0 g of ammonium metavanadate (NH4VO3) were dissolved into 900 mL DI water under vigorously stirring. Then, 100 mL 0.3 mol L−1 thioacetamide (CH3CSNH2, TAA) was added into the solution drop by drop. After 30 minutes stirring at room temperature, the mixture was then heated to 90 °C and then 0.4 mL of hydrazine hydrate (N2H4) was slowly dropped into the mixture followed with 2 h reaction. To optimize the amount of the added hydrazine, 0, 0.2, 0.4, and 0.6 mL of hydrazine were added to form products labeled as CuVOS-1, CuVOS-2, CuVOS-3, and CuVOS-4, respectively. Subsequently, the obtained precipitate was washed, centrifuged, and dried with rotary evaporation to obtain CuVOS catalysts prepared with different N2H4 contents. For comparison purpose, CuOS was prepared with the same procedure without the addition of vanadium source.2.2 Characterizations
The XRD pattern of the CuOS and CuVOS catalysts was characterized by the Rigaku X-ray diffractometer with the Cu Kα radiation (λ = 1.5406 Å) sources. The XPS analysis was performed by the PHI5700 photoelectron spectrometer with Al Kα X-ray (hν = 1486.6 eV) radiation, and C 1s at 284.62 eV was used for calibration purpose. The FTIR analysis was performed by Agilent Digilab FTS-3500 Fourier transforms infrared spectrometer. The surface morphologies of the samples were checked by FE-SEM (HITACHI SU-8010 microscope) with an accelerating voltage of 10 kV and by TEM and HR-TEM (Tecnai F20 G2 microscope). The UV-Vis DRS analysis was characterized by TU-1901 UV-Vis spectrophotometer equipped with an integrating sphere, and BaSO4 was as a reference.2.3 Catalytic reduction experiments
In the case of organic dye reduction, MO, MB, and RhB dyes were selected to test the catalytic performance of the samples. In a particular procedure, 5 mg CuVOS catalyst was added into 100 mL (100 ppm) MO solution. Then, 3 mL 0.2 mol L−1 NaBH4 solution was added to the above solution. Subsequently, 2 mL of sample was removed from the reactor at a regular interval time. For MB and RhB dyes, the concentration of the dye and the amount of NaBH4 used were similar with the reduction of MO dye mentioned above. According to the absorbance maxima of MO, MB, and RhB at 465 nm, 663 nm, and 554 nm, respectively, the retained concentration was calculated with the Lambert–Beer law.
To evaluate the stability of the catalyst, the CuVOS-3 catalyst was taken and used repeatedly. In a particular procedure, 200 mg of CuVOS-3 catalyst was added into 4000 mL (20 mg L−1) 4-NP aqueous solution in to 5000 mL beaker. Then, freshly prepared, 120 mL (0.2 mol L−1) of NaBH4 aqueous solution was added in to the mixture and reduction progress of the resulting 4-NP was then monitored by TU-1901 UV-Vis spectrophotometer. After reaction, the solution was settled by gravity and the upper layer solution was poured out. The remaining solution was separated with centrifuged and the catalyst was used for the next reactions. After five time runs, the catalyst was collected and dried with oven at 60 °C for 2 h and used for XPS and XRD analysis.
3. Results and discussion
3.1 XRD analysis
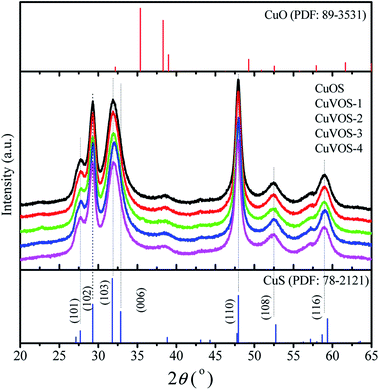
Fig. 1 shows the XRD diffraction patterns of CuVOS. The diffraction peaks positions of CuVOS were correspondent with the structure of hexagonal CuS covellite (PDF #89-2531). The major peaks of the samples were located at 2θ value of 27.66°, 28.36°, 29.62°, 31.81°, 32.72°, 48.23°, and 52.75°, which were attributed to (100), (101), (102), (103), (006), (110), and (108) crystal planes, respectively. As we have seen from the XRD peaks, there was a little shift to lower angle as we compared from CuS standard peaks. Moreover, the XRD diffraction patterns had no second phases of CuO, Cu2O, Cu2S, V2O5, and V2S5, which indicated that the CuVOS catalyst is a solid solution. The peak full width at half maxima indicated that a little effect of adding different amount of N2H4 was observed on the crystal structure and crystallinity. The average crystal sizes of CuVOS catalysts prepared with different amounts of N2H4 were also calculated by Scherrer formula and showed in Table 1. As it is observed from Table 1, the average the crystalline size for catalyst was 12.7–13.5 nm.| Catalyst | Molar percentage (%) | Cu molar percentage (%) | Cu+/Cu2+ molar ratio | O molar percentage (%) | S molar percentage (%) | S2−/S6+ molar ratio | Crystal sizes (nm) | ||||||
|---|---|---|---|---|---|---|---|---|---|---|---|---|---|
| Cu | V | O | S | Cu(I) | Cu(II) | O–H | Olattice | S2− | S6+ | ||||
| CuVOS-1 | 35.65 | 2.69 | 21.03 | 40.67 | 65.49 | 34.51 | 1.90 | 29.96 | 70.04 | 88.93 | 11.07 | 8.03 | 12.7 |
| CuVOS-2 | 35.37 | 2.71 | 21.27 | 40.65 | 69.33 | 30.67 | 2.26 | 30.84 | 69.16 | 87.22 | 12.78 | 6.82 | 13.2 |
| CuVOS-3 | 35.26 | 2.72 | 21.15 | 40.87 | 72.02 | 27.98 | 2.57 | 30.73 | 69.27 | 85.65 | 14.35 | 5.97 | 13.5 |
| CuVOS-4 | 35.62 | 2.68 | 20.98 | 40.72 | 75.31 | 24.69 | 3.05 | 30.50 | 69.50 | 84.16 | 15.84 | 5.31 | 13.1 |
| CuS commercial | 48.91 | 0 | 2.41 | 48.68 | 0 | 100 | — | — | — | — | — | — | — |
| CuVOS-3 after reaction | 35.40 | 2.65 | 21.07 | 40.88 | 72.05 | 27.95 | 2.58 | 30.55 | 69.45 | 85.47 | 14.53 | 5.88 | — |
3.2 XPS analysis
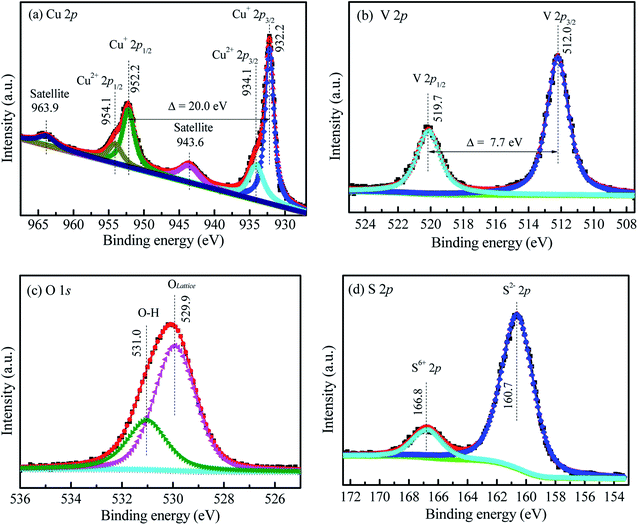
Fig. 2a also shows the Cu 2p XPS spectra of CuVOS-3. The peaks located at 932.22 eV and 952.22 eV represents for the Cu 2p3/2 and Cu 2p1/2, respectively, which indicates the presence of Cu(I) oxidation state in the sample.29 Moreover, the peaks for Cu 2p3/2 and Cu 2p1/2 located at 934.10 eV and 954.10 eV, respectively, indicates the presence of Cu(II) oxidation state.30,31 The satellite peaks are also located at 943.7 eV and 963.1 eV. The results indicated that the copper is existed in the forms of Cu(I) and Cu(II) oxidation states in the sample.30,31 Moreover, Fig. 2b also shows the V 2p XPS spectra in the CuVOS-3 catalysts. The peaks of V 2p3/2 and V 2p1/2 located at 512.0 eV and 519.7 eV, respectively, which indicates the existence of V(IV) oxidation state in the CuVOS-3 sample.32Fig. 2c shows the O 1s XPS spectra in the CuVOS-3 catalyst. The peaks at 531.0 eV and 529.9 eV attributed to the hydroxyl oxygen and the lattice oxygen, respectively.33 The S 2p XPS spectra in the CuVOS-3 catalyst also showed in the Fig. 2d. The S 2p peaks at 160.7 eV indicates the formation of S2− and the peak at 166.8 eV also showed the existence of S6+ in the CuVOS-3 catalyst.34 Moreover, the chemical compositions of the CuVOS with different amount of hydrazine, and the CuVOS-3 catalyst after reused are shown on Table 1 according to the peak-fitting area. As it is indicated from Table 1, the molar ratios of Cu+/Cu2+ were increased as the amount of hydrazine increases due to the reduction of Cu2+ to Cu+. The Olattice composition was almost constant with increasing hydrazine. However, the molar ratio of the S2−/S6+ decreases with increasing the amount of hydrazine.3.3 FE-SEM and TEM analyses
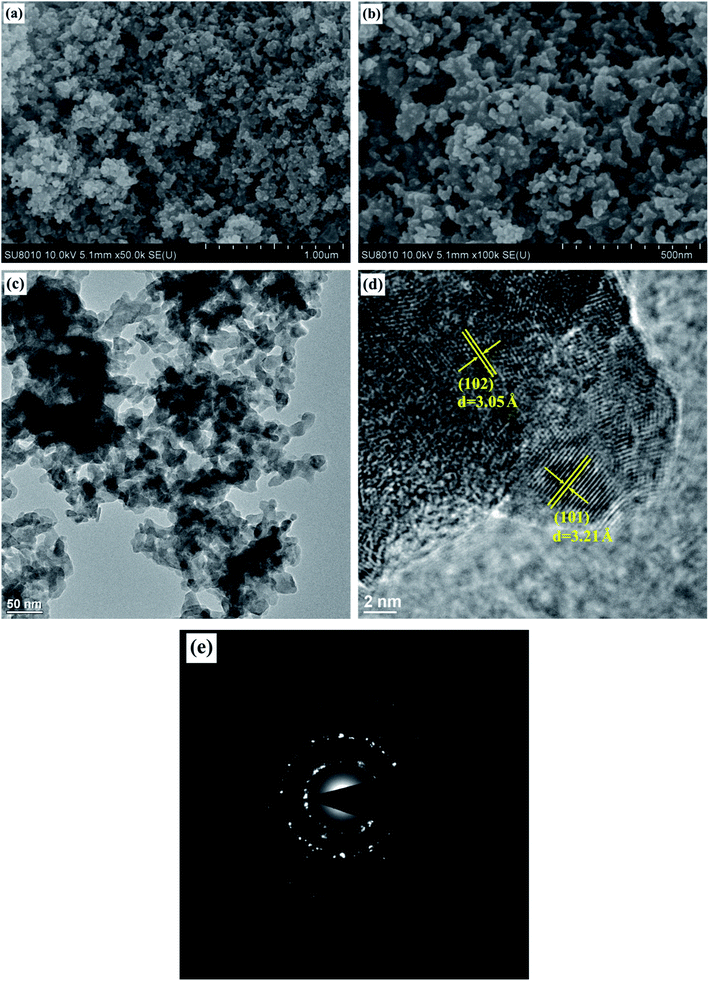
Fig. 3a and b show the FE-SEM images of CuVOS-3 catalyst. As we checked the SEM images, the CuVOS nanoparticle and agglomeration with 50–200 nm were observed. Fig. 3c also indicates the TEM image of CuVOS-3 and it also further confirms the nanoparticle agglomeration. Fig. 3d displays the HR-TEM image of CuVOS-3 and the d-space values of 3.21 Å and 3.05 Å in the image were attributed to hexagonal CuS (101) and (102) planes, respectively. Fig. 3e also shows the selected area electron diffraction (SAED) pattern of CuVOS-3. The ring patterns illustrate its polycrystalline nature. In general, the XRD, XPS, and TEM analysis further confirms the formation of the major phase of CuS in the CuVOS solid solution.3.4 BET and pore size analysis
Fig. 4a displays the N2 adsorption–desorption isotherm of CuVOS-3. As we can see from the Fig. 4a, it has a consistent trend with the type IV isotherm of the hysteresis loop for a mesoporous characteristics when the relative pressure (P/P0) is 0.75–1.0.35 Moreover, the pore size distribution curve of the samples is showed in Fig. 4b. The surface area (SBET), total pore volume, and average pore diameter of CuVOS-3 were 14.5 m2 g−1, 0.120 m3 g−1, and 33.1 nm, respectively.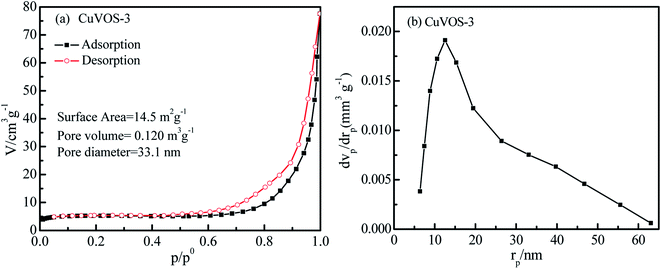 | ||
| Fig. 4 (a) Nitrogen adsorption–desorption isotherm and (b) the pore size distribution curve of CuVOS-3. | ||
3.5 FT-IR analysis
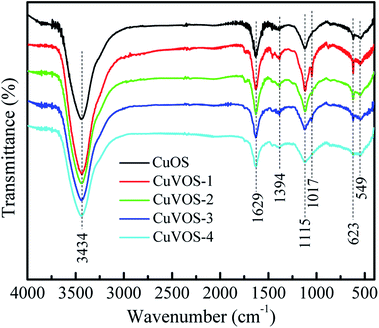
Fig. 5 shows the FTIR spectra of CuOS and CuVOS prepared in the presence of different amounts of N2H4. The peaks located at 3434 and 1629 cm−1 corresponds to the vibration mode of the stretched and bending vibration from surface adsorbed water or surface hydroxyl groups.36,37 The peak at 623 cm−1 corresponded to the Cu–O stretching vibration.38,39 The peak at 1115 cm−1 was attributed to the S–O stretching vibrations in CuVOS.40,41 The existence of the peak around 549 cm−1 also indicated the presence of Cu–S stretching vibration.423.6 UV-Vis absorption spectra
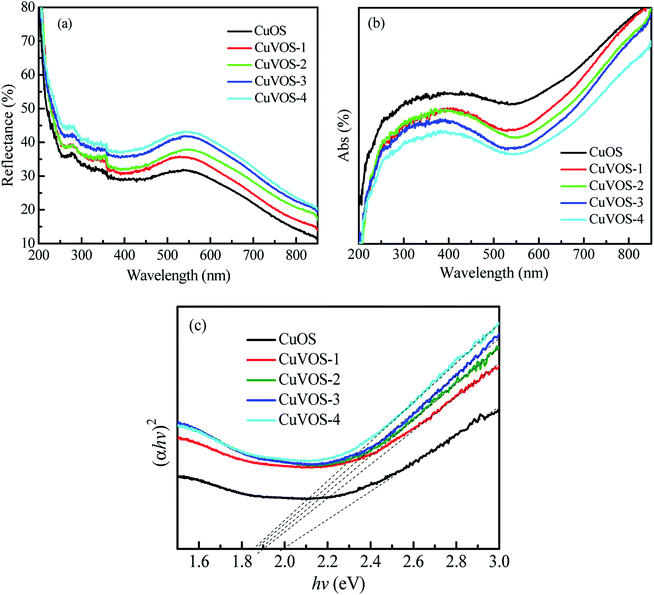
Fig. 6a and b show the UV-Vis reflection and absorption spectroscopy of the CuOS and CuVOS, respectively. From the UV-Vis absorption spectra, the direct band gap was calculated with the equation as follows: (αhν)2 = k(hν − Eg).43Fig. 6c indicates the (αhν)2–hν curves of CuVOS and CuOS catalysts. The Eg values were to be 1.6–1.8 eV for CuVOS-1, 2, 3, 4, and ∼2.0 eV for CuOS. As it is compared from CuOS, the band gap of CuVOS-1, 2, 3, 4 had smaller Eg values. The monocrystalline CuO of Eg = 1.2–1.4 eV, Cu2O of 2.0–2.2 eV, Cu2S of 1.2–1.25 eV, CuS of 2.15–2.36 eV are known. The band gaps of the samples further indicate that CuVOS is a bimetal oxysulfide solid solution.3.7 Catalytic reduction of 4-nitrophenol
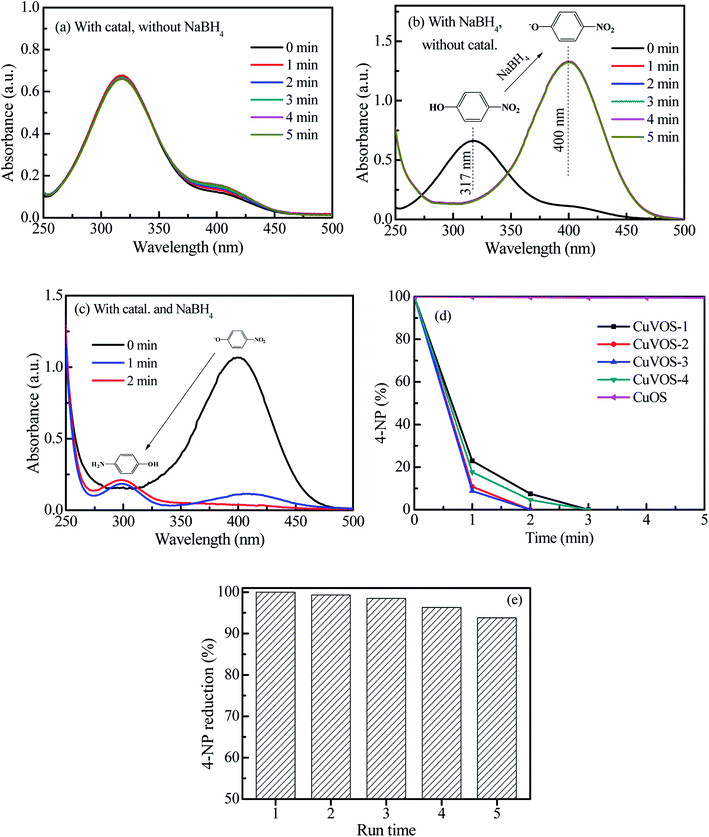
Fig. 7a and b show the control reduction of 4-NP by CuVOS catalysts. As is it observed from the Fig. 7a, the 4-NP solution was not changed in the presence of CuVOS catalyst. However, the addition of NaBH4 in the 4-NP solutions changed the absorption peak of the 4-NP from 317 nm to 400 nm (Fig. 7b). The shift of the absorption peak in the presence of NaBH4 reagent indicates the formation of 4-NP ion, which is also accompanied by a light yellow to deep yellow color change.24 Moreover, Fig. 7c shows the reduction reaction of 4-NP solution with the CuVOS-3 catalyst in the presence of NaBH4. It is indicated that the absorption peak at 400 nm rapidly decreased and subsequently a new peaks appeared at 300 nm which belonged to 4-AP.6,24Fig. 7d shows the percentage of the 4-NP reduction reaction over the CuOS and CuVOS prepared with different amounts of N2H4. As indicated from the Fig. 7d, the reduction of 4-NP with CuVOS in the presence of NaBH4 was faster. However, the reduction of 4-NP was insignificant in the presence of CuOS. The kinetic rates of reaction with CuVOS catalyst prepared with different amounts of N2H4 followed the order: CuVOS-3 > CuVOS-2 > CuVOS-4 > CuVOS-1 > CuOS. This indicated that the CuVOS prepared with suitable amount of N2H4 will have an appropriate n[Cu(I)/Cu(II)] molar ratio and is expected to generate the anion vacancy due to the high Cu+ in Cu2+S2− covellite structure. Moreover, the addition of N2H4 also leads to the change the surface defect state of CuVOS in order to facilitate its interaction with 4-NP. The CuVOS with the suitable n[Cu(I)/Cu(II)] molar ratio can also transfer the electron between the Cu(I) and Cu(II) species.8,44Moreover, the catalytic performances of our catalysts were also compared with other literature reports. As it is indicated in Table 2, complete reduction of 4-NP was achieved by 5 mg CuVOS-3 catalyst in the presence of NaBH4 within 2 min reaction time. Therefore, our catalysts prepared with facile method had comparable catalytic performance towards reduction of 4-NP with reported literatures. Table 2 shows the comparison of the catalytic activity of various catalysts reported in literature with CuVOS.
| No. | Catalysts/amount | Time (s) | Kinetic rate constant, kapp (s−1) | Ratio constant, K (s−1 g−1) | Ref. |
|---|---|---|---|---|---|
| 1 | Co3O4/100 mg | 120 | 0.013 | 0.13 | 45 |
| 2 | NiPt-0.6%/15.5 mg | 140 | 0.01882 | 1.2 | 46 |
| 3 | CuO/100 mg | 40 | 0.019 | 0.19 | 45 |
| 4 | Cu2O–Cu–CuO/1 mg | 180 | 0.0156 | 15.6 | 47 |
| 5 | SiO2@CuxO@TiO2/10 mg | 210 | 0.025 | 2.5 | 24 |
| 6 | CuOS/5 mg | 300 | — | — | This work |
| 7 | CuVOS-1/5 mg | 180 | 0.022 | 4.4 | This work |
| 8 | CuVOS-2/5 mg | 120 | 0.037 | 7.4 | This work |
| 9 | CuVOS-3/5 mg | 120 | 0.041 | 8.1 | This work |
| 10 | CuVOS-4/5 mg | 180 | 0.027 | 5.4 | This work |
Furthermore, the catalytic stability was also studied by using the CuVOS-3 catalyst and its performance is shown in the Fig. 7e. After the 5th run, the CuVOS-3 had a very good reduction capability of 4-NP. In order to check the catalyst stability, the XPS analysis was performed after reduction of 4-NP. Fig. 8a shows the high resolution Cu 2p XPS spectrum of CuVOS-3 after reduction reaction. The peaks located at 932.1 eV and 952.1 eV for Cu 2p3/2 and Cu 2p1/2, respectively, indicate the existence of Cu(I).29 The Cu(II) oxidation state peaks of Cu 2p3/2 and Cu 2p1/2 were located at 934.1 eV and 954.1 eV, respectively.30,31 According to the quantitative analysis by integrating the peak area, the Cu(I)/Cu(II) molar ratios of catalysts were calculated to be close to the CuVOS-3 catalyst before reaction. Fig. 8b shows the high resolution V 2p XPS spectrum of CuVOS-3 after reaction. The peaks of located at 512.0 eV and 519.7 eV were attributed to V 2p3/2 and V 2p1/2, respectively, which indicated the V(IV) oxidation state.32,33Fig. 8c shows the high resolution O 1s XPS spectrum of CuVOS-3 after reaction. The peak located at 532.2 eV was contributed from hydroxyl oxygen, and at 530.1 eV from lattice oxygen. Fig. 8d shows the high resolution S 2p XPS spectrum of CuVOS-3 after reaction. The S 2p peaks at 165.6 eV and 171.9 eV belonged to the S2− and S6+, respectively.34,48 According to the quantitative analysis by integrating the peak area, the S6+/S2− molar ratios of catalysts were calculated to be close to the CuVOS-3 catalyst before reaction as it is shown in Table 1. Furthermore, Fig. 8e shows the XRD diffraction patterns of CuVOS-3 before and after reaction. It can be seen that the peaks position of CuVOS-3 before and after reaction are similar, but intensity of the peaks after reaction is little decreased. This result indicates that the catalyst is highly stable and can be used for multiple times.
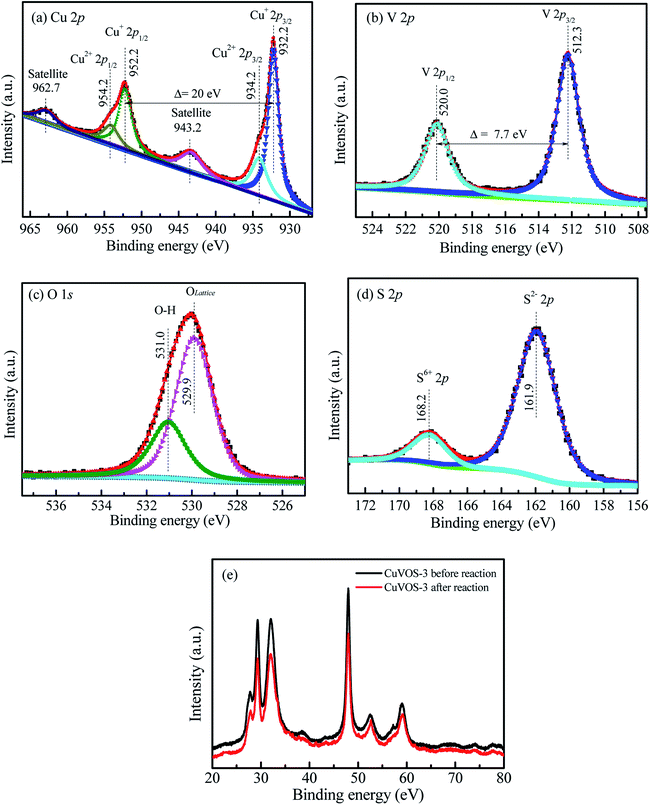 | ||
| Fig. 8 High resolution (a) Cu 2p, (b) V 2p, (c) O 1s, and (d) S 2p XPS spectra of CuVOS-3 after reaction. (e) XRD diffraction patterns of CuVOS-3 for before and after reaction. | ||
3.8 Reduction activity on organic dyes
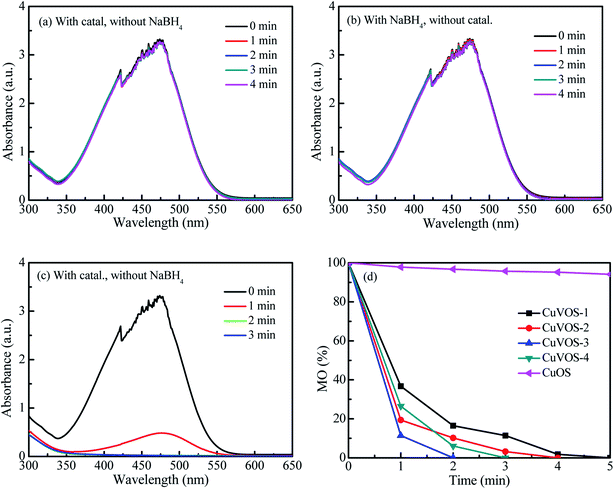
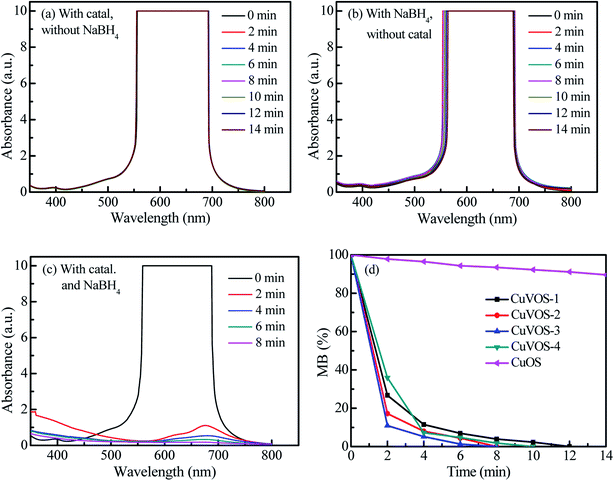
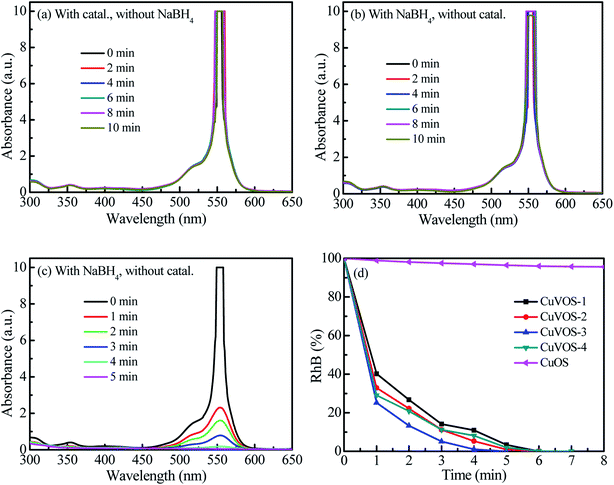
Fig. 9 shows the reduction of MO with CuVOS catalyst. The control experiments were shown in Fig. 9a and b. As observed in Fig. 9a and b, there were no reduction reactions by using only catalyst or only NaBH4. However, the complete reduction of MO within 2 min was taken place in the presence of both CuVOS-3 catalyst and NaBH4 (Fig. 9c). Moreover, Fig. 9d shows the pseudo first-order apparent reaction rate constant (kapp) of MO reduction over CuVOS catalysts having the order of reaction as follows: CuVOS-3 (kapp = 1.94 min−1) > CuVOS-4 (kapp = 1.40 min−1) > CuVOS-2 (kapp = 1.07 min−1) > CuVOS-1 (kapp = 0.70 min−1) > CuOS (kapp = 0.01 min−1). It is noted that the completed reduction of MO was achieved within as 2 minutes by CuVOS-3 catalyst, while CuOS only achieved for 8% in 10 minutes.In order to evaluate the reduction performance of the CuVOS catalyst, the catalysts were also used to reduce MB and RhB, and the results were shown in Fig. 10 and 11. The control experiments of CuVOS catalysts for MB and RhB reduction are shown in Fig. 10a, b and 11a, b, respectively. Moreover, Fig. 10c and 11c indicate the reduction of MB and RhB dyes, respectively, by CuVOS-3 catalysts. The strongest peaks of MB at 560–700 nm was completely degraded in the presence of CuVOS-3 catalyst in 8 min, while CuOS degraded only less than 10% (Fig. 10d). The pseudo first-order apparent reaction rate constant (kapp) of MB reduction over CuVOS is as follows: CuVOS-3 (kapp = 0.72 min−1) > CuVOS-4 (kapp = 0.59 min−1) > CuVOS-2 (kapp = 0.48 min−1) > CuVOS-1 (kapp = 0.29 min−1) > CuOS (kapp = 0.01 min−1). Similar to MB, the pseudo first-order apparent reaction rate constant (kapp) of RhB reduction over CuVOS is also calculated as follows: CuVOS-3 (kapp = 0.93 min−1) > CuVOS-2 (kapp = 0.78 min−1) > CuVOS-4 (kapp = 0.74 min−1) > CuVOS-1 (kapp = 0.51 min−1) > CuOS (kapp = 0.004 min−1). Based on the above analyses, the reduction capability of CuVOS on pollutants is as follow: MO > RhB > MB. It is further demonstrated that the bimetallic oxysulfide CuVOS catalyst has great prospects in industrial applications for wastewater treatment.
3.9 The proposed reduction reaction mechanism
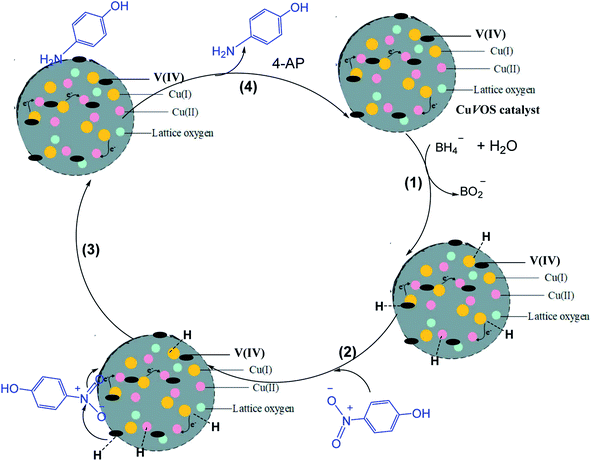
Fig. 12 shows a possible reaction mechanism for the catalytic reduction of 4-NP by CuVOS catalyst in the presence of NaBH4 as a reducing agent. When NaBH4 is dissociated, the BH4− ion is released and attached on the surface of the catalyst (step 1). Then, the hydride ion is bonded covalently with the CuVOS (step 2). Simultaneously, the adsorption of nitro groups of 4-NP, will took place on the surface of the catalyst as it is shown in step 3. The strong interactions between adsorbed 4-NP and covalently bonded hydrogen atoms will occur. Then, the adsorbed nitro groups will react with the hydride ion and reduction took place through the transfer of electron from donor BH4− to the acceptor 4-NP and lead to desorption of 4-AP product.49 In addition, Cu(I) and Cu(II) in the CuVOS catalyst can transfer the electron and to accelerate the reduction reaction.50,51 Moreover, the V(IV) atom will also accept the electrons and transfer for the reduction purpose. Fig. 12 shows the mechanism of 4-NP reduction catalyzed by CuVOS.4. Conclusions
A copper–vanadium bimetallic oxysulfide CuVOS catalyst was successfully synthesized by facile method and had excellent reducing activities for 4-NP, MO, MB, and RhB. It showed that, a 100 mL of 4-NP (20 ppm) solution was completely reduced in the presence of 5 mg of CuVOS-3. Moreover, the complete reduction of 100 mL of MO, RhB, and MB solutions (100 ppm) were also achieved within 2 min, 6 min, and 5 min, respectively, with 5 mg CuVOS-3. The stability of CuVOS-3 was relatively good after using repeatedly for the reduction of 4-NP. Hence, the CuVOS prepared in the presence of optimum amount of N2H4 is an efficient catalyst for reducing 4-NP and other organic dyes and may have a great potential for industrial application.Conflicts of interest
There are no conflicts to declare.Acknowledgements
This work was supported by the National Natural Science Foundation of China under the grant No. 31000269, the Strait Postdoctoral Program under the grant No. 1323H0005, and the China Postdoctoral Program under the grant No. 2018M632562.References
- A. K. Abay, X. Chen and D.-H. Kuo, New J. Chem., 2017, 41, 5628–5638 RSC.
- X. Yang, H. Zhong, Y. Zhu, H. Jiang, J. Shen, J. Huang and C. Li, J. Mater. Chem. A, 2014, 2, 9040 RSC.
- K. He, G. Chen, G. Zeng, A. Chen, Z. Huang, J. Shi, T. Huang, M. Peng and L. Hu, Appl. Catal., B, 2018, 228, 19–28 CrossRef CAS.
- B. K. Ghosh and N. N. Ghosh, J. Nanosci. Nanotechnol., 2018, 18, 3735–3758 CrossRef CAS.
- T. Aditya, A. Pal and T. Pal, Chem. Commun., 2015, 51, 9410–9431 RSC.
- O. A. Zelekew and D.-H. Kuo, RSC Adv., 2017, 7, 4353–4362 RSC.
- M. J. Ahmed and M. Ahmaruzzaman, J. Environ. Manage., 2015, 163, 163–173 CrossRef CAS.
- X. Chen, D.-H. Kuo, J. Zhang, Q. Lu and J. Lin, J. Mol. Liq., 2019, 275, 204–214 CrossRef CAS.
- F. Liu, Y. H. Leung, A. B. Djurišić, A. M. C. Ng and W. K. Chan, J. Phys. Chem. C, 2013, 117, 12218–12228 CrossRef CAS.
- W. Jiang, X. Wang, Z. Wu, X. Yue, S. Yuan, H. Lu and B. Liang, Ind. Eng. Chem. Res., 2015, 54, 832–841 CrossRef CAS.
- S. Du, Z. Liao, Z. Qin, F. Zuo and X. Li, Catal. Commun., 2015, 72, 86–90 CrossRef CAS.
- R. Patel and S. Suresh, J. Hazard. Mater., 2006, 137, 1729–1741 CrossRef CAS.
- Y. Xie, B. Yan, H. Xu, J. Chen, Q. Liu, Y. Deng and H. Zeng, ACS Appl. Mater. Interfaces, 2014, 6, 8845–8852 CrossRef CAS.
- M. T. Yagub, T. K. Sen, S. Afroze and H. M. Ang, Adv. Colloid Interface Sci., 2014, 209, 172–184 CrossRef CAS.
- J. Liu, L. Han, H. Ma, H. Tian, J. Yang, Q. Zhang, B. J. Seligmann, S. Wang and J. Liu, Sci. Bull., 2016, 61, 1543–1550 CrossRef CAS.
- H. Lachheb, E. Puzenat, A. Houas, M. Ksibi, E. Elaloui, C. Guillard and J.-M. Herrmann, Appl. Catal., B, 2002, 39, 75–90 CrossRef CAS.
- C. Y. Teh, P. M. Budiman, K. P. Y. Shak and T. Y. Wu, Ind. Eng. Chem. Res., 2016, 55, 4363–4389 CrossRef CAS.
- B. R. Ganapuram, M. Alle, R. Dadigala, A. Dasari, V. Maragoni and V. Guttena, Int. Nano Lett., 2015, 5, 215–222 CrossRef CAS.
- X. Chen, H. Sun, J. Zhang, O. Ahmed Zelekew, D. Lu, D.-H. Kuo and J. Lin, Appl. Catal., B, 2019, 252, 152–163 CrossRef CAS.
- B. Sun, H. Li, X. Li, X. Liu, C. Zhang, H. Xu and X. S. Zhao, Ind. Eng. Chem. Res., 2018, 57, 14011–14021 CrossRef CAS.
- X. Liu, D. Xu, D. Zhang, G. Zhang and L. Zhang, Appl. Catal., B, 2016, 186, 193–203 CrossRef CAS.
- B. Zhao, G. Mele, I. Pio, J. Li, L. Palmisano and G. Vasapollo, J. Hazard. Mater., 2010, 176, 569–574 CrossRef CAS.
- O. Ahmed Zelekew and D.-H. Kuo, Phys. Chem. Chem. Phys., 2016, 18, 4405–4414 RSC.
- O. A. Zelekew and D.-H. Kuo, Appl. Surf. Sci., 2017, 393, 110–118 CrossRef CAS.
- A. Elfiad, F. Galli, A. Djadoun, M. Sennour, S. Chegrouche, L. Meddour-Boukhobza and D. C. Boffito, Mater. Sci. Eng., B, 2018, 229, 126–134 CrossRef CAS.
- M. Ajmal, S. Demirci, M. Siddiq, N. Aktas and N. Sahiner, New J. Chem., 2016, 40, 1485–1496 RSC.
- L. Ai, C. Zeng and Q. Wang, Catal. Commun., 2011, 14, 68–73 CrossRef CAS.
- H. Abdullah, D.-H. Kuo and X. Chen, Int. J. Hydrogen Energy, 2017, 42, 5638–5648 CrossRef CAS.
- N. Pauly, S. Tougaard and F. Yubero, Surf. Sci., 2014, 620, 17–22 CrossRef CAS.
- S. Poulston, P. M. Parlett, P. Stone and M. Bowker, Surf. Interface Anal., 1996, 24, 811–820 CrossRef CAS.
- H. Qiu, S. Zhang, B. Pan, W. Zhang and L. Lv, J. Colloid Interface Sci., 2012, 366, 37–43 CrossRef CAS.
- J. Mendialdua, R. Casanova and Y. Barbaux, J. Electron Spectrosc. Relat. Phenom., 1995, 71, 249–261 CrossRef CAS.
- J. P. Holgado, G. Munuera, J. P. Espinós and A. R. González-Elipe, Appl. Surf. Sci., 2000, 158, 164–171 CrossRef CAS.
- S. Liu and X. Chen, J. Hazard. Mater., 2008, 152, 48–55 CrossRef CAS.
- H. Yuan, X. Ma and Z. Xu, Sci. China: Chem., 2011, 54, 257–262 CrossRef CAS.
- X. Chen, H. Sun, J. Zhang, Y. Guo and D.-H. Kuo, J. Mol. Liq., 2019, 273, 50–57 CrossRef CAS.
- W. Zhang, Y. Shen, J. Zhang, H. Bi, S. Zhao, P. Zhou, C. Han, D. Wei and N. Cheng, Appl. Surf. Sci., 2019, 470, 581–590 CrossRef CAS.
- D. Gupta, S. R. Meher, N. Illyaskutty and Z. C. Alex, J. Alloys Compd., 2018, 743, 737–745 CrossRef CAS.
- S. Kumar, A. K. Ojha, D. Bhorolua, J. Das, A. Kumar and A. Hazarika, Phys. B, 2019, 558, 74–81 CrossRef CAS.
- D. Ma, Y. Xin, M. Gao and J. Wu, Appl. Catal., B, 2014, 147, 49–57 CrossRef CAS.
- L. G. Devi and R. Kavitha, Mater. Chem. Phys., 2014, 143, 1300–1308 CrossRef CAS.
- L. Z. Pei, J. F. Wang, X. X. Tao, S. B. Wang, Y. P. Dong, C. G. Fan and Q.-F. Zhang, Mater. Charact., 2011, 62, 354–359 CrossRef CAS.
- C. Xu, S. Peng, C. Tan, H. Ang, H. Tan, H. Zhang and Q. Yan, J. Mater. Chem. A, 2014, 2, 5597–5601 RSC.
- X. Chen and D.-H. Kuo, ACS Sustainable Chem. Eng., 2017, 5, 4133–4143 CrossRef CAS.
- T. R. Mandlimath and B. Gopal, J. Mol. Catal. A: Chem., 2011, 350, 9–15 CrossRef CAS.
- H. Shang, K. Pan, L. Zhang, B. Zhang and X. Xiang, Nanomaterials, 2016, 6, 103 CrossRef.
- A. K. Sasmal, S. Dutta and T. Pal, Dalton Trans., 2016, 45, 3139–3150 RSC.
- A. Galtayries and J.-P. Bonnelle, Surf. Interface Anal., 1995, 23, 171–179 CrossRef CAS.
- M. Tian, X. Cui, C. Dong and Z. Dong, Appl. Surf. Sci., 2016, 390, 100–106 CrossRef CAS.
- W. Lin and H. Frei, J. Am. Chem. Soc., 2005, 127, 1610–1611 CrossRef CAS.
- X. Chen, D.-H. Kuo, A. D. Saragih, Z.-Y. Wu, H. Abdullah and J. Lin, Chem. Eng. Sci., 2019, 194, 105–115 CrossRef CAS.
| This journal is © The Royal Society of Chemistry 2019 |

