 Open Access Article
Creative Commons Attribution 3.0 Unported Licence
An analysis on the electrophoretic mobility of cellulose nanocrystals as thin cylinders: relaxation and end effect†
Kuan-Hsuan Lin*a,
Donghao Hua,
Takuya Sugimotob,
Feng-Cheng Chang c,
Motoyoshi Kobayashia and
Toshiharu Enomae
 a
a
aGraduate School of Life and Environmental Sciences, University of Tsukuba, 1-1-1 Tennodai, Tsukuba, Ibaraki 305-8572, Japan. E-mail: enomae.toshiharu.fw@u.tsukuba.ac.jp
bGraduate School of Agricultural and Life Sciences, The University of Tokyo, 1-1-1 Yayoi, Bunkyo-ku, Tokyo 113-8657, Japan
cSchool of Forestry and Resource Conservation, Advanced Research Center for Green Materials Science and Technology, National Taiwan University, No. 1, Sec. 4, Roosevelt Rd., Taipei 10617, Taiwan
First published on 22nd October 2019
Abstract
Cellulose nanocrystals (CNCs) are extracted from cellulosic fibers via sulfuric acid hydrolysis and found to exhibit unique properties due to their nanoscale, ordered structure, and surface morphology. The dispersion stability of a CNC suspension is a significant factor when CNCs are applied for reinforcement of a composite or ink jet printing. Since sulfuric acid hydrolysis introduces sulfate groups on CNC surfaces, we considered that charging conditions needed to be characterized, typically based on electrophoretic mobility. After the electrophoretic mobility was measured, several theoretical equations were applied to fit those values to assume the proper CNC particle shape. While Smoluchowski's equation is often used for this purpose, its applicability to CNCs should be reconsidered due to the thin, rod-like shape of CNCs with a finite length and high charge density. In this sense, we measured the surface charge and electrophoretic mobility of well-characterized CNCs. The obtained experimental data have been analyzed by using various electrokinetic equations. Our analytical results suggested that Smoluchowski's equation and the Ohshima–Henry equation overestimated the magnitude of the mobility of CNCs because it ignores the double layer relaxation and end effect. They also suggested that neither the Ohshima–Overbeek averaged equation nor the Ohshima–Overbeek perpendicular equation described the mobility of CNCs appropriately because those equations consider the double layer relaxation and end effect of a cylinder in a limited manner. Instead, the modified Ohshima–Overbeek equation was presented to be preferred for such a charged cylinder with a small aspect ratio.
Introduction
Cellulose is a sustainable bioresource and abundant in nature, and its chains are arranged in a highly ordered structure. Cellulose forms two regions: crystalline—called microfibrils—and amorphous regions, depending on the bonding mode of hydroxyl groups. With the nanometric size effect, cellulose nanocrystals (CNCs) extracted from crystalline regions have recently been studied in novel applications, such as cellulose biosensors,1 in mechanical property reinforcement,2 and in tissue engineering.3 Due to the steric effect, a hydroxyl group at the C6 position of a cellulose chain exhibits the highest reactivity. CNCs prepared via sulphuric acid hydrolysis are suggested to graft sulfate groups at the C6 position, making rod-like CNC particles well dispersed in an aqueous system due to repulsive forces.4 Thus, the understanding of the surface potential (Ψ) due to the charging of sulfate groups on the surface and an electrical double layer surrounding a CNC particle has become important to evaluate the stability of CNC suspensions.Electric potential decreases with an increasing distance from the particle surface in an electric double layer. Zeta potential (ζ), defined as the potential at the slipping plane in an interfacial double layer, can be used to evaluate the level of dispersion in a colloidal suspension; this is usually calculated considering the present electrolytes, solvent and other suspended particles, and temperature, among other factors. Several equations have been formulated to obtain ζ from electrophoretic mobility (μ) because a value of μ can be easily obtained as the ratio of the velocity of particles to the applied electric field. For this purpose, Smoluchowski's equation (eqn (1)), which is suitable for large, spherical particles with a low ζ, was widely used in previous studies.5,6
 | (1) |
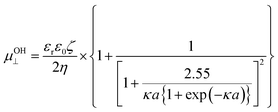
For the case of cylindrical particles, Ohshima10 derived Henry's type approximate equation, eqn (2), for the electrophoretic mobility of a cylinder oriented perpendicular to an applied electric field μOH⊥ and further suggested the use of an orientation-averaged equation μav by applying Smoluchowski's equation to an infinitely long cylinder oriented parallel to the applied electric field μ‖ = μSmol as eqn (3).
 | (2) |
 | (3) |
In eqn (2), κ, the Debye–Hückel parameter is introduced. The Debye length—thickness of double layer—was defined as an inverse of the Debye–Hückel parameter (κ−1). The theoretical relationship between κ−1 and the concentration of the added 1–1 electrolyte is defined as eqn (4)11
 | (4) |
Since ζ is an important parameter when evaluating the stability of CNC suspensions in aqueous media, it was applied to estimate the influence of counterion adsorption,13,14 raw material of CNCs,15 ultrasonic treatment on CNC suspensions,16 and the duration of acid hydrolysis in the CNC preparation process.17 However, the equation to derive ζ from μ is not detailed in either case,13,15 and Smoluchowski's equation is simply selected.14,16 The cylindrical shape of CNCs should be considered, and the Ohshima–Henry equation is used sometimes.13,17 Nevertheless, the effect of surface potential contributed by sulfate groups and the shape of a short cylinder also plays a role in the result of μ.
Therefore, when the number of sulfate groups present on the surface of a CNC introduced by sulphuric acid hydrolysis is significant, the high surface potential and the resulting relaxation effect need to be accounted for in the calculation. Ohshima (2015) derived equations with a consideration of the relaxation effect based on equations provided by van der Drift et al. (1979), which account for cases of high surface potential.18 With consideration of the valence of counterions (Z) and dimensionless ionic drag coefficient (m±), eqn (5) is the μ for a cylinder in the perpendicular orientation with the relaxation of the double layer (named “Ohshima–Overbeek perpendicular equation”). The averaged μ, “Ohshima–Overbeek averaged equation”, is represented by  according to Ohshima (2015). These equations are applicable to low to moderately high ζ (<100 mV).
 | (5) |
Eqn (1)–(5) consider different aspects of the properties of the particles such as cylindrical shape, surface potential, and the relaxation effect and thus are suitable for estimating the charging properties of CNC colloidal particles. Nevertheless, to the best of the authors' knowledge, the application of eqn (1)–(5) to CNC has never been examined. The objective of this study was to examine the applicability of the theoretical equations to the electrophoretic mobility of well-characterized CNC in terms of the shape and surface charge.
Experimental
Sample preparation
Commercially available CNCs purchased from University of Maine, USA, were used. Suspension samples were prepared as follows: the purchased freeze-dried CNC powder was dispersed in distilled water to a concentration of 0.1% (w/w); 1 mM HCl or NaOH was added to it to adjust the suspension pH to 3, 5, 7, 9, and 11. After preparing CNC suspensions with the specified pH values, different amounts of NaCl were added to each of them to evaluate an electrolyte addition effect, and the concentration was adjusted to 1, 3, 5, 10, 15, 20, 25, 30, 35, 40, 45, and 50 mM. Some samples were also prepared without any acid or base for pH adjustment except fresh distilled water.Dimensional measurements
Two methods were applied for determining dimensional properties. Transmission electron microscopy (TEM) (JEM-1200 EXII, JEOL, Japan and H7650, Hitachi, Japan) was used to measure the dimension of CNCs after drying on a TEM grid. A hydrodynamic size distribution was measured based on the dynamic light scattering technique. For TEM measurements, CNC suspensions at 0.1% (w/w) were dropped on 20 mesh carbon-coated TEM copper grids for TEM observations at 60 kV in accelerating voltage. The particle dimensions were analysed using ImageJ (https://imagej.nih.gov/ij/index.html) for at least 30 different particles. Only individual particles with clear edges were measured. The length and width were determined as the distance between the two ends of each particle along the length axis and distance between the edges across the axial centre, respectively.The Stokes–Einstein equation introduces a relationship between the diffusion coefficient by Brownian motion. Then, the particle size and hydrodynamic size distribution of CNC particles were determined from the diffusion coefficient of particles indicated by the rate of fluctuation of the signal intensity analysed by autocorrelation built in the instrument (Zetasizer Nano-ZS, Malvern Instruments, England).
Potentiometric titration
The surface charge of CNCs was measured by potentiometric acid–base titration with a pH meter integrated with a burette (Easy pH, Mettler Toledo, USA). A blank solution was prepared by mixing 25 mL of 0.01 M NaCl with 10 mL of 0.01 M HCl. Then, a titration curve of the blank was constructed by using 0.01 M NaOH under a CO2-free system with continuous stirring and bubbling argon gas. A CNC suspension at approximately 0.3% (w/w) with 0.01 M HCl was then added into the blank sample and titrated again. Titration curves of the blank and CNCs were plotted with pH values calibrated by Gran's plot. The surface charge density (σ) was calculated from the volumes of the titrant added to blank and the suspension of CNCs at the same pH, CNC density at 1.6 g cm−3,19 and the specific surface area.Elemental analysis
Contents of N, C, S, and H were determined by elemental analysis (Elemental analyser: elementar vario EL cube, Germany). CNCs were packed into a tin-capsule and incinerated at a higher temperature than 1000 °C in the presence of oxygen to obtain oxides of N, C, and S. Subsequently, the mass of the oxides was detected and converted to the composition.Zeta potential calculation
If the surface charge density is constant irrespective of pH or electrolyte concentration as expected from sulphate groups on CNCs, one can evaluate the surface potential as a function of the electrolyte concentration by using the solution following the Poisson–Boltzmann (PB) equation (Fig. S1 in the ESI†). ζtheoretical of CNCs in the 1–1 electrolyte solution was estimated by solving the PB equation as an electric potential at the slipping plane in an electrical double layer with the idea reported by Ohshima (1998).20 The relationship between the surface charge density, σ, and the surface potential, ψs, is approximated as eqn (6)–(8):
 | (6) |
 | (7) |
 | (8) |
Then, when the distance from the surface of a cylinder to an assumed slipping plane is decided as Xs, ψ(Xs) could be written as
 | (9) |
 | (10) |
 | (11) |
Thus, ζtheoretical could be approximated as the surface potential located at Xs from the particle surface.
Zeta potential and electrophoretic mobility measurements
Charged particles can electrophoretically migrate in solution in an applied electric field. The migration velocity of particles under these conditions is measured by laser Doppler velocimetry. The measured mobility (μmeasured) was then calculated from a ratio of the migration velocity to the electric field intensity, reflecting the surface potential of colloidal particles. ζ of CNCs under different conditions were calculated based on the μmeasured using theoretical equations such as Smoluchowski's theory (eqn (1)). Solid polarization was reported to significantly affect electrophoretic mobility only when an applied electric field was strong and a dielectric permittivity ratio of particle to solution was large.21 In this study, however, the applied electric field was weak and the dielectric permittivity ratio was small. Thus, the solid polarization effect is negligible. Data of μmeasured were collected at 20 °C using a Zetasizer from 20 data points after 3 runs, and the conversion for ζSmol was based on Smoluchowski's theory.Results and discussion
Dimensional information of dried CNCs
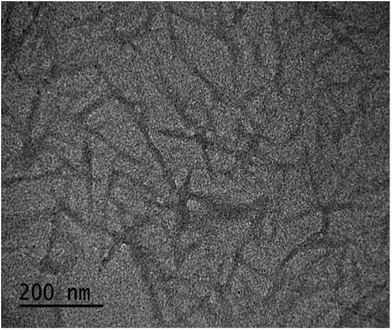
Fig. 1 shows a TEM micrograph of CNCs with information about dimensions. Spindle-shaped CNC particles captured in this TEM image were analysed, and their average length (L) and width (D) were determined to be 168 ± 3 nm and 13.5 ± 0.5 nm, respectively. Based on this information, the aspect ratio of CNCs (L/D) was calculated to be approximately 12.4.Influence of pH and electrolyte concentration on electrophoretic mobility
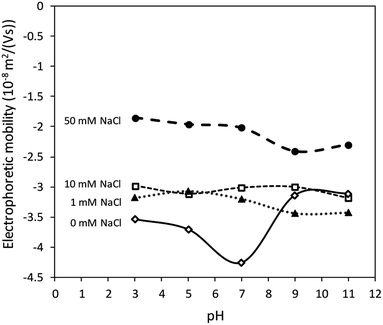
Fig. 2 shows that the electrolyte concentrations played a more important role in influencing the value of electrophoretic mobility than pH values. Sulphate groups (–OSO3−) were supposed to provide a pH-independent μmeasured, as well as a ζ value on the surface of CNCs as mentioned in previous studies.22–25 The result demonstrates the constant surface charge density of the CNCs. The CNCs showed low electrophoretic mobility values obtained from the Zetasizer (μmeasured) with additional electrolyte due to the compressed electric double layer. Although the surface charge was constant, the value of μmeasured of CNCs decreased with increasing salt concentration due to the compressed electric double layer.Charging behaviour and surface environment of CNCs
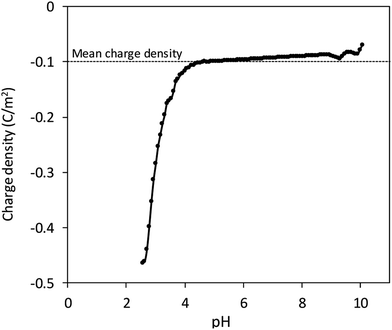
We propose that sulphate groups dominate the colloidal behaviour of CNCs with a pH-independent ζ value as the previous result. Accordingly, potentiometric acid–base titration was applied to determine the charging behaviour, which might be influenced also by sulphate groups. Surface charge of CNCs resulted in a difference between titration curves of the CNC suspension and blank solution. The surface charge density was defined with the specific surface area of 304.2 m2 g−1 obtained by dimensional information from TEM and an assumed cylindrical shape (Fig. 1), with the assumption of a non-aggregated state. Fig. 3 shows that the surface charge density of CNCs was determined to be approximately −0.1 C m−2 after avoiding possible error from the strongly curved titration curve at low pH, which is close to that of sulphate group-grafted CNCs prepared via sulfuric acid hydrolysis.7 As shown in Table 1, the detection of S by elemental analysis also suggested the presence of sulphate groups on the surface of CNCs. By counting backward with the relationship between the surface charge density and sulfur content, entire dissociation of sulphate groups of CNCs were derived from approximately the same level of %S between the two methods.26,27| Element | N | C | S | H |
| Ratio (wt%) | 0.26 | 39.63 | 0.97 | 6.27 |
Effect of electrolyte addition on the double layer of CNCs
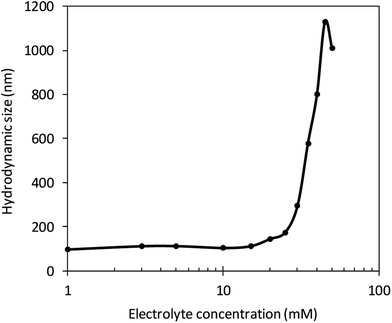
With more electrolyte addition, κa increased, meaning that the double layer became thinner and thinner. Fig. 4 shows that the hydrodynamic size was observed to increase quickly over an electrolyte concentration of 25 mM from experiment results. At this concentration, the hydrodynamic size was 173 nm and the κa value was 3.5. Thus, a CNC suspension with an electrolyte solution concentration higher than 25 mM showed sudden aggregation. With increased concentration from this level, the double layer became thinner and CNC colloidal particles became more aggregated.Analysis of electrophoretic mobility of CNC
In the calculation of electrophoretic mobility from theories (μtheoretical), it was assumed that the surface charge density was constantly −0.1 C m−2 as shown in Fig. 3 and previous studies7,28,29. Subsequently, the theories regarding orientation and the relaxation effect as well as the shape and surface potential of CNCs (eqn (1)–(5)) provided theoretical curves of μtheoretical. Fig. 5 exhibits those theoretical curves for fitting to the μmeasured on the condition of the slipping plane located 0.60–0.75 nm away from the particle surface.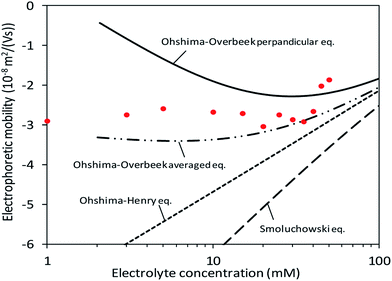 | ||
| Fig. 5 Fitting of theoretical equations when the surface charge density and distance between the particle surface and slipping plane are assumed to be −0.107 C m−2 and 0.65 nm, respectively. | ||
At low electrolyte concentrations, the Ohshima–Overbeek averaged equation and Ohshima–Overbeek perpendicular equation curves fairly fitted the data points better than the others. This confirmed the assumption that CNCs have highly charged surfaces, indicating that the relaxation of the double layer reduces μ. To be more exact, however, neither the Ohshima–Overbeek averaged equation nor the Ohshima–Overbeek perpendicular equation fitted the data points, but the experimental data remained between both equations.
The Ohshima–Overbeek perpendicular equation did not fit the data points exactly due to the cylindrical shape of CNCs, suggesting a possible orientation effect. μOOav considers the orientation effect of CNCs, however, does not consider the end effect sufficiently. As mentioned before, μOOav uses μOO⊥ as the perpendicular orientation with a relaxation of the double layer, but adopts μSmol, in which the parallel part ignored the relaxation effect. This means that the Ohshima–Overbeek averaged equation is not completely suitable for cases with the significant end effect. The data points of μmeasured fell close to μOOav at higher electrolyte concentrations or at higher κa values. With a relatively small double layer and a κa value greater than 3.5, a trend similar to the theoretical prediction was shown in experimental data, which meant that the end effect became less pronounced. On the other hand, cellulose nanofibres are shaped as a long cylinder with relatively low ζ, if mechanically prepared, than CNCs and are reported to exhibit behaviour predicted by “Ohshima–Overbeek perpendicular equation”,30 whereas the relatively short length and high surface zeta potential characteristic of CNCs was responsible for the difference between μmeasured and μOOav. In addition, a misinterpretation of the partial end effect consideration in the case of a relatively thick double layer when the same equations were applied was reported, and it was suggested that the end effect played a significant role in this situation.11 Thus, another estimation was suggested in this reference to deal with such a short cylinder with a thick double layer and a non-negligible end effect, all characteristic of CNCs.
A concept to keep μOO⊥ as μOOav(κa) and replace μSmol with  where L is the length of the CNC particle, for a cylinder model oriented parallel to the field in calculating the averaged μ from Ohshima's equation (eqn (5)) proposed by Bakker et al.11 was applied. Then, a motivation of
  was calculated and named as “Ohshima–Overbeek (length) equation”. Fig. 6 shows that this theory presented a much better fitting than Smoluchowski's theory for the parallel part. Nevertheless, the experimental data points were close to the Ohshima–Overbeek (length) equation, where the Ohshima equation was applied to both perpendicular and parallel parts for the cylinder mobility to account for the end effect. In addition, considering CNCs with various lengths, we confirm that “Ohshima–Overbeek (length) equation” becomes close to “Ohshima–Overbeek averaged equation” with increasing CNCs length (Fig. S2 in the ESI†).
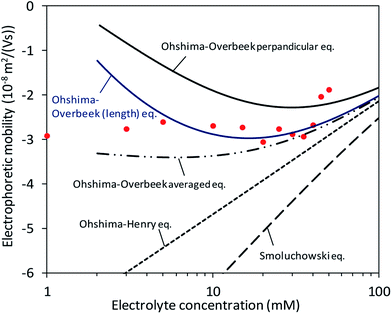 | ||
| Fig. 6 Fitting of theoretical equations including the Ohshima–Overbeek (length) equation as the best fitted approximation. | ||
Finally, our result suggests that the use of Smoluchowski's equation leads to the underestimation of ζ in magnitude. The relaxation effect and the end effect are crucial for parallel and perpendicular mobilities of CNCs due to high charge and a relatively small aspect ratio.
Conclusions
A strongly negative surface potential was found in CNC suspensions when the relationship among pH, ζ, and electrolyte concentration was considered. Through the results of potentiometric titration and elemental analysis, sulphate groups introduced via sulfuric acid hydrolysis were proposed to possess such a strongly negative surface potential. The hydrodynamic size of CNC particles significantly increased at electrolyte concentrations higher than 25 mM, meaning that suspended CNC particles aggregated under this condition. Moreover, at a high electrolyte concentration, CNCs had a thin double layer with a high κa value, and thus the end effect was not very significant. At lower electrolyte concentrations (<25 mM), the double layer remained relatively thick (κa < 3.5) and the suspensions did not aggregate. In this situation, theoretical results such as the Ohshima–Overbeek averaged equation and the Ohshima–Overbeek perpendicular equation explained the experimental data more accurately than Smoluchowski's equation and Ohshima–Henry equation, owing to the cylindrical shape of CNC colloidal particles and the relaxation effect caused by the highly charged surface from sulphate groups. The reason that neither the Ohshima–Overbeek averaged equation nor the Ohshima–Overbeek perpendicular equation fitted the experimental data accurately might be the end effect, which became remarkable in the case of a short cylinder with a remarkable surface charge. Dealing with this problem, we successfully determined μ more exactly from ζ by a new method based on the Ohshima–Overbeek (length) equation that has never been applied to CNCs before.Conflicts of interest
There are no conflicts to declare.Acknowledgements
We would like to thank Industry Technology Research Institute, Taiwan, for supplying the materials used in the study. This research was partially supported by research funds (108L9006 and MOST 108-3017-F-002-002) from Advanced Research Centre of Green Materials Science and Technology, Taiwan, and JSPS KAKENHI Grant number 17KT0069, 19H03070, and 18J00823, Japan.References
- J. V. Edwards, N. Prevost, K. Sethumadhavan, A. Ullah and B. Condon, Cellulose, 2013, 20, 1223–1235 CrossRef CAS.
- M. Grunert and W. T. Winter, J. Polym. Environ., 2002, 10, 27–30 CrossRef CAS.
- X. He, Q. Xiao, C. Lu, Y. Wang, X. Zhang, J. Zhao, W. Zhang, X. Zhang and Y. Deng, Biomacromolecules, 2014, 15, 618–627 CrossRef CAS.
- D. Bondeson, A. Mathew and K. Oksman, Cellulose, 2006, 13, 171–180 CrossRef CAS.
- M. Hasani, E. D. Cranston, G. Westman and D. G. Gray, Soft Matter, 2008, 4, 2238–2244 RSC.
- R. Prathapan, R. Thapa, G. Carnier and R. F. Tabor, Colloids Surf., A, 2016, 509, 11–18 CrossRef CAS.
- J. O. Zoppe, X. Xu, C. Känel, P. Orsolini, G. Siqueira, P. Tingaut, T. Zimmermann and H.-A. Klok, Biomacromolecules, 2016, 17, 1404–1413 CrossRef CAS.
- D. C. Henry and A. Lapworth, Proc. R. Soc. London, Ser. A, 1931, 133, 821 Search PubMed.
- H. Ohshima, T. W. Healy and L. R. White, J. Colloid Interface Sci., 1981, 90(1), 17–26 CrossRef.
- H. Ohshima, Langmuir, 2015, 31, 13633–13638 CrossRef CAS.
- H. E. Bakker, T. H. Besseling, J. E. G. J. Wijnhoven, P. H. Helfferich, A. van Blaaderen and A. Imhof, Langmuir, 2017, 33, 881–890 CrossRef CAS.
- A. de Keizer, W. P. J. T. van der Drift and J. Th. G. Overbeek, Biophys. Chem., 1975, 3, 107–108 CrossRef CAS.
- L. Zhong, S. Fu, X. Peng, H. Zhan and R. Sun, Carbohydr. Polym., 2012, 90, 644–649 CrossRef CAS.
- R. Prathapan, R. Thapa, G. Garnier and R. F. Tabor, Colloids Surf., A, 2016, 509, 11–18 CrossRef CAS.
- S. Shafiei-Sabet, W. Y. Hamad and S. G. Hatzikiriakos, Langmuir, 2012, 28, 17124–17133 CrossRef CAS.
- H. Kargarzadeh, I. Ahmad, I. Abdullah, A. Dufresne, S. Y. Zainudin and R. M. Sheltami, Cellulose, 2012, 19, 855–866 CrossRef CAS.
- Y. Boluk, R. Lahiji, L. Zhao and M. T. McDermott, Colloids Surf., A, 2011, 377, 297–303 CrossRef CAS.
- W. P. J. T. van der Drift, A. de Keizer and J. Th. G. Overbeek, J. Colloid Interface Sci., 1979, 71(1), 67–78 CrossRef CAS.
- R. Moon, S. Beck, and A. Rudie, Production and Applications of Cellulose Nanocrystals, TAPPI PRESS, United States of America, 2013, pp. 9–12 Search PubMed.
- H. Ohshima, J. Colloid Interface Sci., 1998, 200, 291–297 CrossRef CAS.
- S. Bhattacharyya and S. De, Phys. Rev. E: Stat., Nonlinear, Soft Matter Phys., 2015, 92, 032309 CrossRef.
- X. M. Dong and D. G. Gray, Langmuir, 1997, 13, 2404–2409 CrossRef CAS.
- A. Dufresne, Nanocellulose: from nature to high performance tailored materials, Walter de Gruyter, GmbH, Berlin, 2013 Search PubMed.
- J. P. F. Lagerwall, C. Schütz, M. Salajkova, J. H. Noh, J. H. Park, G. Scalia and L. Bergström, NPG Asia Mater., 2014, 6(1), 1–12 Search PubMed.
- S. Beck, M. Méthot and J. Bouchard, Cellulose, 2015, 22, 101–116 CrossRef CAS.
- X. M. Dong, J.-F. Revol and D. G. Gray, Cellulose, 1998, 5, 19–32 CrossRef CAS.
- T. Abitbol, E. Kloser and D. G. Gray, Cellulose, 2013, 20, 785–794 CrossRef CAS.
- M. Kobayashi, Colloid Polym. Sci., 2008, 286, 935–940 CrossRef CAS.
- T. Abitbol, E. Kloser and D. G. Gray, Cellulose, 2013, 20, 785–794 CrossRef CAS.
- Y. Sato, Y. Kusaka and M. Kobayashi, Langmuir, 2017, 33(44), 12660–12669 CrossRef CAS.
Footnote |
| † Electronic supplementary information (ESI) available. See DOI: 10.1039/c9ra05156b |
| This journal is © The Royal Society of Chemistry 2019 |

