 Open Access Article
Creative Commons Attribution 3.0 Unported Licence
Enhanced photocatalytic water splitting of a SILAR deposited α-Fe2O3 film on TiO2 nanoparticles
Zahra-Sadat
Pourbakhsh
a,
Kyana
Mohammadi
a,
Ahmad
Moshaii
 *a,
Maryam
Azimzadehirani
b and
Amir
Hosseinmardi
a
aDepartment of Physics, Tarbiat Modares University, P.O Box 14115-175, Tehran, Iran. E-mail: moshaii@modares.ac.ir
bDepartment of Chemistry, Tarbiat Modares University, P.O Box 14115-175, Tehran, Iran
First published on 7th October 2019
Abstract
We have investigated the effect of deposition of a α-Fe2O3 thin layer on a substrate of TiO2 nanoparticles for photoelectrochemical (PEC) water splitting. The TiO2 layer was coated on an FTO substrate using the paste of TiO2 nanoparticles. The α-Fe2O3 layer was deposited on the TiO2 thin film, using the method of Successive Ionic Layer Adsorption and Reaction (SILAR) with different cycles. Various characterizations including XRD, EDX and FE-SEM confirm the formation of α-Fe2O3 and TiO2 nanoparticles on the electrode. The UV-visible absorption spectrum confirms a remarkable enhancement of the absorption of the α-Fe2O3/TiO2/FTO composite relative to the bare TiO2/FTO. In addition, the photocurrents of the composite samples are remarkably higher than the bare TiO2/FTO. This is mainly due to the low band gap of α-Fe2O3, which extends the absorption spectrum of the α-Fe2O3/TiO2 composite toward the visible region. In addition, the impedance spectroscopy analysis shows that the recombination rate of the charge carriers in the α-Fe2O3/TiO2 is lower than that for the bare TiO2. The best PEC performance of the α-Fe2O3/TiO2 sample was achieved by the sample of 70 cycles of α-Fe2O3 deposition with about 7.5 times higher photocurrent relative to the bare TiO2.
Introduction
Fossil fuels are currently the main non-renewable energy resource in the world, and have negative effects on the environment like greenhouse gas production and global temperature rise. These unclean fuels cannot meet the continuously increasing future demands for energy resources.1–4 Hydrogen as a non-polluting fuel can be considered as a good candidate of sustainable energy resources.5 Of various methods to produce hydrogen, efficient photoelectrochemical (PEC) water splitting provides a promising pathway for solar-to-hydrogen conversion using cost-effective semiconductor materials.6–9In PEC water splitting, hydrogen is generated by the absorption of light in a semiconductor, which must have a suitable bandgap and suitable energies of conduction and valance bands relative to the oxidation and reduction potentials of water. Also, it should be chemically stable in the electrolyte of the PEC process.10–12
In recent years, TiO2 nanoparticles have been extensively studied for PEC water splitting due to their low cost, simple preparation, non-toxicity and chemical stability. However, the high bandgap of TiO2 (3.2 eV for the anatase and 3.0 eV for the rutile phase) only allows absorption of the ultraviolet region of sun light, which covers only 5% of the solar spectrum. This significantly decreases the efficiency of PEC using the TiO2 nanostructures. To improve the PEC properties of TiO2, many methods such as sensitization to the sunlight with doping of nitrogen or heavy metals13–17 and incorporating plasmonic nanoparticles such as Ag, Au, Pt18–20 have been investigated in the literatures. Most of these approaches have the drawback of increasing crystal deformations or introducing defects that act as additional electron–hole recombination centers.21–26 In addition, combining TiO2 with another semiconductor with suitable band alignments has been reported to achieve larger electron/hole separation due to the movement of charge carriers between the different semiconductors. With this regard, Fe2O3 with a bandgap of about 1.9–2.2 eV, which can absorb photons of visible light spectrum,27,28 is a suitable semiconductor to be mixed with TiO2 to extend the adsorption spectrum of the composite efficiency.29 However, two main disadvantages of Fe2O3 are the low conductivity and a short diffusion length of excitons (2–20 nm), which significantly diminish its photocatalytic efficiency.30,31 However, these deficiencies of Fe2O3 can be resolved by combining TiO2 with Fe2O3, due to a strong electric field at the interface of Fe2O3/TiO2.30–32 Accordingly, the combination of these two semiconductors has attracted many attentions recently.33–43
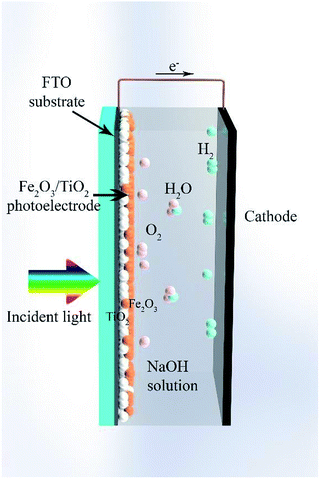
In this work, a composite electrode of α-Fe2O3/TiO2 was introduced as a photoanode for PEC cells. The SILAR method was used for the deposition of α-Fe2O3 on the TiO2 substrate. Fig. 1 shows a schematic of the composite electrode in the water-splitting process. Under visible light irradiation, the composite electrode produces electron–hole pairs and the holes oxidize water at the electrode surface to generate oxygen. The produced electrons migrate to the counter electrode and take part in the reduction of water to produce hydrogen. We studied the optimum thickness of α-Fe2O3 on the TiO2 substrate to obtain the best water-splitting activity. We found that under 70-cycle deposition of α-Fe2O3, the best PEC water-splitting activity occurs, which corresponds to about 7.5 times photocurrent improvement relative to the bare TiO2 electrode. This result is mainly due to extension of the absorption spectrum of the sample into the visible light, due to incorporating α-Fe2O3. In addition, the recombination of charge carriers greatly decreases by using the α-Fe2O3/TiO2 composite.
Experimental section
The TiO2 layer was deposited on an area of 1 cm × 1 cm of the FTO substrate (with the sizes of 1 cm × 2 cm) by the doctor blade method,44 using the paste of TiO2 (Degussa, P-25) purchased from Sharifsolar. Then, a thin film of α-Fe2O3 nanoparticles was deposited on the TiO2 layer by the SILAR method, which provides a strong control over the film thickness. In this method, 0.05 M FeCl3 and 0.1 M NaOH, were used as iron and hydroxide precursors.42 The synthesis process is shown in Fig. 2, in which each immersion stage lasted 10 seconds. After depositing 30 cycles, the solutions of FeCl3 and NaOH were renewed by the fresh ones. The deposition of Fe2O3 on the samples by the SILAR method was done with various cycles of 50, 60, 70 and 80th. After finishing the SILAR deposition, we completely remove the tiny layer of α-Fe2O3 on the back of FTO by ethanol. Then the composite samples were placed inside a furnace for annealing at 550 °C for 4 hours. Fig. 3 shows a photo of the samples fabricated by the SILAR method with different cycles.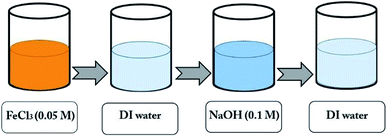 | ||
| Fig. 2 A schematic of the SILAR process for deposition of α-Fe2O3 nanoparticles on a sample for one cycle. | ||
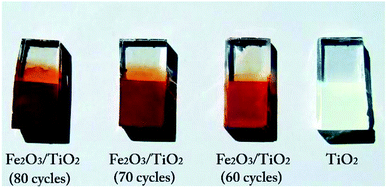 | ||
| Fig. 3 A photograph of the samples of α-Fe2O3/TiO2/FTO with different SILAR deposition cycles of α-Fe2O3. | ||
For the electrochemical measurements, the entire substrate was illuminated by a 100 W Xe lamp, so the illumination area of the α-Fe2O3/TiO2 layer was 1 cm × 1 cm. In addition, the illumination was frontside.
Results and discussion
Characterization
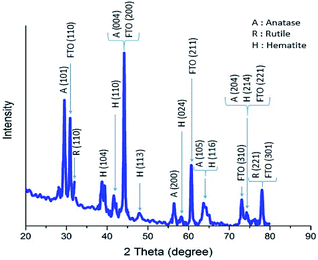
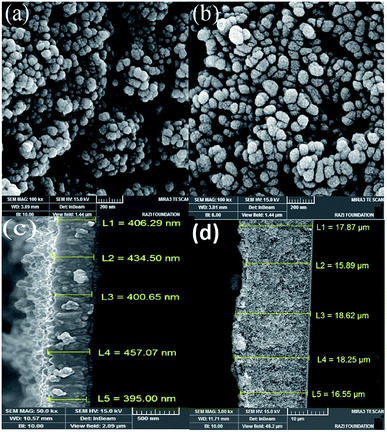
The X-ray diffraction pattern of a sample of α-Fe2O3/TiO2/FTO prepared with 70 SILAR cycles is shown in Fig. 4, using an X-ray diffractometer (Xpert, Philips) with Cu Kα radiation (λ = 1.54 Å). According to the reference cards of (JCPD-01-083-2243) and (JCPD-01-073-2224), the peaks of the crystalline phases of anatase and rutile of TiO2 are clearly seen at the 2θ angles of 29.5°, 44.2°, 56.4°, 63.5°, 74.4°, 31.9°, 77.8° relating to the planes of (101), (004), (200), (105), (204), (110), and (221), respectively. The substrate peaks of SnO2 are identified, in the pattern, according to the card of (JCPD-01-077-0450). On the other hand, the diffraction peaks of α-Fe2O3 nanoparticles are characterized at the angles of 38.8°, 41.7°, 47.9°, 58.2° and 74.1°, relating to the planes of (104), (110), (113), (024), (116) and (214), according to the card of (JCPD-01-086-0550).In order to investigate the morphology of the samples, the Field Emission Scanning Electron Microscopy (FESEM) of the samples was taken using the MIRA3 TESCAN microscope. The top and the cross-section images of the TiO2 samples are shown in Fig. 5. We see that the thickness of the TiO2 layer on the surface is around 400 nm. While a very thick layer of Fe2O3 (about 18 μm) is produced on the sample by the 70-cycle SILAR deposition.
The EDX analysis was used for elemental determination of the samples. The weight percentages of the elements Ti, O, Fe and Au (which is used for preparation of the layers for EDX/FESEM) for the samples with different SILAR cycles are shown in Fig. 6. It is seen that the iron percentage of the best α-Fe2O3/TiO2 sample for the PEC application (which is the 70-cycle sample) was about 23.15% (wt).
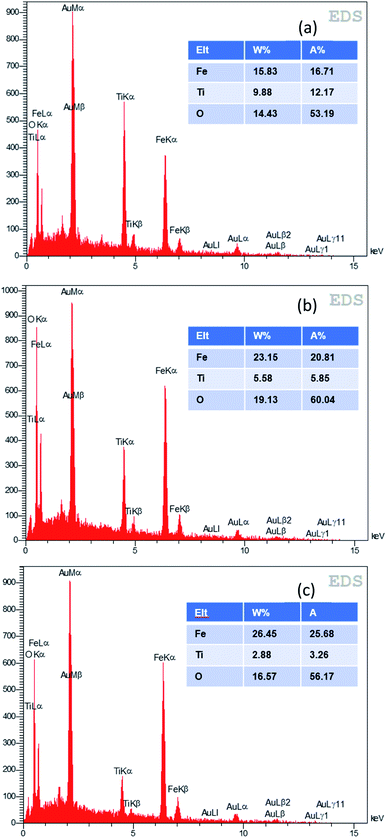 | ||
| Fig. 6 EDX analysis of various samples of α-Fe2O3/TiO2/FTO with (a) 60, (b) 70, (c) 80 SILAR cycles. | ||
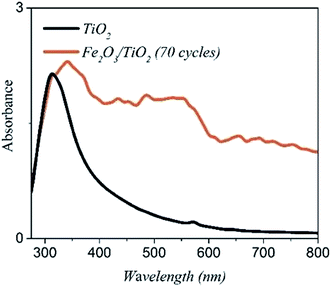
Fig. 7 shows the UV-vis absorption spectrums of the bare TiO2 and the α-Fe2O3/TiO2 sample with the 70-cycle. The bare TiO2 has an absorption edge around 390 nm (∼3.13 eV), which is related to its wide bandgap. The absorption edge of α-Fe2O3/TiO2 has been transferred to the visible range with a much higher absorption intensity than the bare TiO2 in the range of 400–800 nm.
The bandgaps of the fabricate TiO2 and Fe2O3/TiO2 film are calculated using the Tauc plot. As it showed in Fig. 8, the tangent lines indicates that the Fe2O3 has an indirect band gap of about 2.04 eV and direct band gap of TiO2 is about 3.35 eV for our sample; which is agreed with other observations.42,45
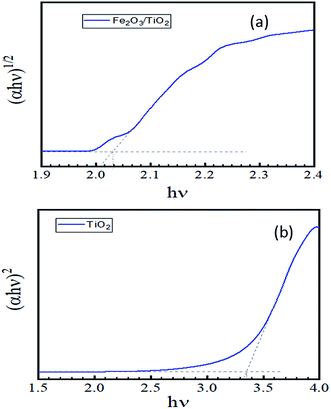 | ||
| Fig. 8 Tauc plot calculated to find the band gap of the layer from the UV-vis spectrum (a) α-Fe2O3/TiO2 (b) pure TiO2. | ||
Photoelectrochemical characterization
Fig. 9 shows the results of PEC measurements for the α-Fe2O3/TiO2 samples. The photoelectrochemical properties were carried out using a three-electrode cell with the sample as the working electrode, a Pt wire as the counter electrode and the Ag/AgCl electrode saturated with 3 M KCl as the reference electrode. The electrolyte was 1 M NaOH solution.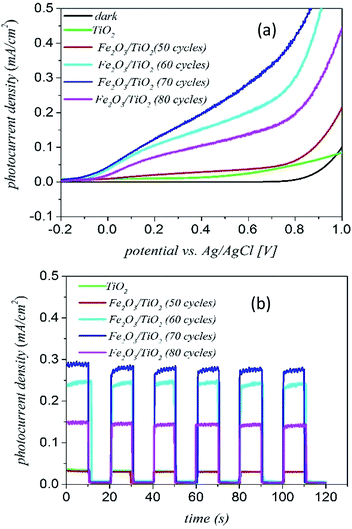 | ||
| Fig. 9 (a) The J–V measurement curves and (b) chronoamperometry measurements of the α-Fe2O3 loaded TiO2/FTO samples with different deposition cycles. | ||
Fig. 9(a) shows the photocurrent–voltage (J–V) curves of various samples for both dark and light illuminations. The dark current curves of all samples are close to zero with no photoelectrochemical activity under the dark condition. The bare sample of TiO2 has a small photocurrent density of around 0.04 mA cm−2. The J–V curves of the samples confirm that the current density of the 70 cycles deposition of α-Fe2O3 gives the highest photocurrent (around 0.3 mA cm−2). With increasing the number of deposition cycles to 80 cycles, the current density of the sample decreases. In fact, the 70-cycle deposition of α-Fe2O3 is the optimum thickness for getting the best water-splitting properties from the composite sample.
Fig. 9(b) shows the transient photocurrent curves of various samples for the ON–OFF period of 20 s. We see that the photocurrent rapidly increases when the light is turned on and it immediately decreased to zero when the light is turned off. According to the results of Fig. 9(b), after about 80 seconds, the photocurrent becomes stable and repeatable. In addition, there is a small slope for the current curve under the light ON condition indicating that the electron–hole recombination is small in the complex of α-Fe2O3/TiO2/FTO.
The main reason for increment of the photocurrent density of the α-Fe2O3/TiO2/FTO electrode relative to the bare TiO2 goes back to the higher absorption of the composite material. As shown in Fig. 7, TiO2 mainly absorb short wavelength photons below 400 nm. However, adding α-Fe2O3 to the electrode can extend the optical absorption to the visible spectrum.46 As a result, the low energy photons can be absorbed by the α-Fe2O3 part of the photoelectrode and more photoelectrons can be produced by the composite electrode.47
The next reason is the location of the α-Fe2O3 edge conduction band compare to TiO2 (as shown in Fig. 10). Under UV-vis illumination, electrons can be excited from the valence band (VB) to the conduction band (CB) of the anatase, creating a charge vacancy in the VB. In the absence of the α-Fe2O3, most of electron–holes are combined quickly.39,47
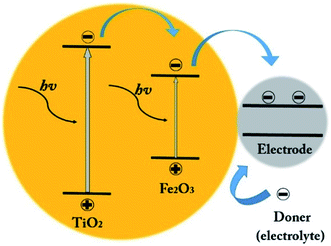 | ||
| Fig. 10 Schematic of the electron–hole generation and the transferring of the photogenerated charges into the photoanode under the visible light illumination. | ||
Increasing the coating cycles of hematite (from 50 to 70 cycles), had a significant improvement in current density. According to the results of Fig. 9, the sample of 70-cycle represents the best photocurrent. However, with increasing the number of cycles to 80 cycles, the photocurrent density decreases. Therefore, it is indicated that there was an optimal amount of deposition layer. By increasing the amount of α-Fe2O3 nanoparticles on the surface of the TiO2 nanoparticles, the surface was blocked and light access was greatly reduced, and the production of the electron–hole decreased, so the photocurrent was reduced. So when the amount of α-Fe2O3 was increased from an optimal amount, because photoelectrons accumulated on α-Fe2O3, the recombination probability of the electron–holes increased.48 So α-Fe2O3 being as an electron–hole recombination center, and resulted a reduction in optical activity.49
In order to investigate the charge transport properties of the bare TiO2 and α-Fe2O3/TiO2 samples, the electrical impedance spectroscopy measurements (EIS) were performed for various samples. The applied frequency range was from 100 mHz to 100 kHz (in a 0.1 M Na2SO4 electrolyte at the potential of V = 0.7 V versus the Ag/AgCl reference). The Nyquist plots obtained by the EIS measurements in addition to the equivalent RC circuit for fitting the EIS data are shown in Fig. 11. In the equivalent circuit, Rs indicates a serial resistance between the FTO substrate and the TiO2 layer. Rhf demonstrates the high frequency resistance due to accumulation and trapping of fast charges throughout the α-Fe2O3/TiO2 composite. Rss represents the resistance of charge transfer between the photoanode and the electrolyte. The capacitances Chf and Css are relating to the space charge capacitance of the sample and the capacitance associated with the surface states of the photoanode, respectively.
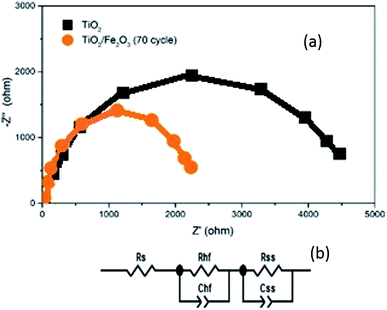 | ||
| Fig. 11 (a) Nyquist plots of TiO2/FTO and the sample of α-Fe2O3/TiO2/FTO with 70 cycles. (b) The equivalent circuit used for the fitting of EIS results. | ||
As shown in Fig. 11, the curve of α-Fe2O3/TiO2 photoanode has a smaller semicircle radius than the bare TiO2, which indicates that both Rhf and Rss are lower for the α-Fe2O3/TiO2 relative to the bare TiO2. This result completely confirms the improvement of charge transfer kinetics of the bare TiO2 sample after the Fe2O3 modification. The faster charge transfer of the 70-cycle sample leads to less surface recombination and improving the photocatalytic activity of this sample relative to all other ones.
It should be mentioned that TiO2 has better charge transport properties relative to Fe2O3, considering the mobility of electrons and the holes in both semiconductors. Therefore, deposition of a thin layer of TiO2 under Fe2O3 in the samples causes that the electrons are better transmitted to the external circuit relative to the case of blank Fe2O3 on FTO. In fact, the recombination between electron and holes at the interface of TiO2/FTO is less than that of Fe2O3/FTO. Consequently, a higher photocurrent is expected from the stack of Fe2O3/TiO2/FTO relative to that of Fe2O3/FTO. This issue has clearly been confirmed by other researchers.42
Conclusions
In this work, we reported on the effect of deposition of a thin layer of α-Fe2O3 on TiO2 nanoparticles by the SILAR method for photoelectrochemical water splitting. The formation of α-Fe2O3 was confirmed by various characterizations including XRD, EDX and FE-SEM spectroscopy. The UV-visible absorption spectrum showed a remarkable enhancement in the absorption of α-Fe2O3/TiO2 relative to the bare TiO2. The photoelectrochemical characterizations indicate that all samples of α-Fe2O3/TiO2 have an improved photocurrent compared to the bare TiO2. This result is mainly due to the proper bandgap of α-Fe2O3, which extended the absorption spectrum of the sample into the visible light. Also, the recombination of charge carriers greatly decreased by using α-Fe2O3 on TiO2. We found that there is an optimum number of cycles for the SILAR deposition of α-Fe2O3, on TiO2, which is the 70-cycle exhibiting much better photoelectrochemical activity from α-Fe2O3/TiO2 relative to the bare TiO2, with about 7.5 times photocurrent improvement.Conflicts of interest
There are no conflicts to declare.Acknowledgements
This work has been supported by Tarbiat Modares University (TMU).References
- K. Feron, W. J. Belcher, C. J. Fell and P. C. Dastoor, Int. J. Mol. Sci., 2012, 13, 17019–17047 CrossRef CAS PubMed.
- M. K. Nazeeruddin, E. Baranoff and M. Grätzel, Sol. Energy, 2011, 85, 1172–1178 CrossRef CAS.
- F. E. Osterloh and B. A. Parkinson, MRS Bull., 2011, 36, 17–22 CrossRef CAS.
- N. S. Lewis and D. G. Nocera, Proc. Natl. Acad. Sci. U. S. A., 2006, 103, 15729–15735 CrossRef CAS.
- N. S. Lewis, Science, 2013, 798, 798–802 Search PubMed.
- T. Hisatomi, J. Kubota and K. Domen, Chem. Soc. Rev., 2014, 43, 7520–7535 RSC.
- A. Kudo and Y. Miseki, Chem. Soc. Rev., 2009, 38, 253–278 RSC.
- J. Schneider, H. Jia, J. T. Muckerman and E. Fujita, Chem. Soc. Rev., 2012, 41, 2036 RSC.
- X. Huang, S. Han, W. Huang and X. Liu, Chem. Soc. Rev., 2013, 42, 173–201 RSC.
- M. R. Hoffmann, S. Martin, W. Choi and D. W. Bahnemann, Chem. Rev., 1995, 95, 69–96 CrossRef CAS.
- A. L. Linsebigler, A. L. Linsebigler, J. T. Yates Jr, G. Lu, G. Lu and J. T. Yates, Chem. Rev., 1995, 95, 735–758 CrossRef CAS.
- J. Li and N. Wu, Catal. Sci. Technol., 2015, 5, 1360–1384 RSC.
- N. Lu, X. Quan, J. Li, S. Chen, H. Yu and G. Chen, J. Phys. Chem. C, 2007, 111, 11836–11842 CrossRef CAS.
- J. H. Park, S. Kim and A. J. Bard, Nano Lett., 2006, 6, 24–28 CrossRef CAS.
- Y. Huo, Y. Jin, J. Zhu and H. Li, Appl. Catal., B, 2009, 89, 543–550 CrossRef CAS.
- L. Sun, J. Li, C. L. Wang, S. F. Li, H. B. Chen and C. J. Lin, Sol. Energy Mater. Sol. Cells, 2009, 93, 1875–1880 CrossRef CAS.
- H. Liu, G. Liu and Q. Zhou, J. Solid State Chem., 2009, 182, 3238–3242 CrossRef CAS.
- H.-J. Lin, T.-S. Yang, C.-S. Hsi, M.-C. Wang and K.-C. Lee, Ceram. Int., 2014, 40, 10633–10640 CrossRef CAS.
- Y.-H. Lin, T.-K. Tseng and H. Chu, Appl. Catal., A, 2014, 469, 221–228 CrossRef CAS.
- S. Lin, D. Li, J. Wu, X. Li and S. A. Akbar, Sens. Actuators, B, 2011, 156, 505–509 CrossRef CAS.
- J. S. Im, S. K. Lee and Y. S. Lee, Appl. Surf. Sci., 2011, 257, 2164–2169 CrossRef CAS.
- M. H. H. Mahmoud, A. A. Ismail and M. M. S. Sanad, Chem. Eng. J., 2012, 187, 96–103 CrossRef CAS.
- S. Zhan, J. Yang, Y. Liu, N. Wang, J. Dai, H. Yu, X. Gao and Y. Li, J. Colloid Interface Sci., 2011, 355, 328–333 CrossRef CAS.
- B. Liu, H. M. Chen, C. Liu, S. C. Andrews, C. Hahn and P. Yang, J. Am. Chem. Soc., 2013, 135, 9995–9998 CrossRef CAS.
- T. K. Ghorai, M. Chakraborty and P. Pramanik, J. Alloys Compd., 2011, 509, 8158–8164 CrossRef CAS.
- Y. C. Pu, G. Wang, K. Der Chang, Y. Ling, Y. K. Lin, B. C. Fitzmorris, C. M. Liu, X. Lu, Y. Tong, J. Z. Zhang, Y. J. Hsu and Y. Li, Nano Lett., 2013, 13, 3817–3823 CrossRef CAS.
- M. Mishra and D.-M. Chun, Appl. Catal., A, 2015, 498, 126–141 CrossRef CAS.
- K. M. H. Young, B. M. Klahr, O. Zandi and T. W. Hamann, Catal. Sci. Technol., 2013, 3, 1660 RSC.
- A. B. Murphy, P. R. F. Barnes, L. K. Randeniya, I. C. Plumb, I. E. Grey, M. D. Horne and J. A. Glasscock, Int. J. Hydrogen Energy, 2006, 31, 1999–2017 CrossRef CAS.
- T. Hisatomi, H. Dotan, M. Stefik, K. Sivula, A. Rothschild, M. Grätzel and N. Mathews, Adv. Mater., 2012, 24, 2699–2702 CrossRef CAS.
- P. Liao and E. A. Carter, J. Appl. Phys., 2012, 112, 1775–1781 Search PubMed.
- V. N. Nguyen, N. K. T. Nguyen and P. H. Nguyen, Adv. Nat. Sci.: Nanosci. Nanotechnol., 2011, 2, 035014 Search PubMed.
- W.-H. Hung, T.-M. Chien and C.-M. Tseng, J. Phys. Chem. C, 2014, 118, 12676–12681 CrossRef CAS.
- N. A. M. Barakat, A. Taha, M. Motlak, M. M. Nassar, M. S. Mahmoud, S. S. Al-Deyab, M. El-Newehy and H. Y. Kim, Appl. Catal., A, 2014, 481, 19–26 CrossRef CAS.
- T. Wang, G. Yang, J. Liu, B. Yang, S. Ding, Z. Yan and T. Xiao, Appl. Surf. Sci., 2014, 311, 314–323 CrossRef CAS.
- M. A. Mahadik, S. S. Shinde, V. S. Mohite, S. S. Kumbhar, A. V. Moholkar, K. Y. Rajpure, V. Ganesan, J. Nayak, S. R. Barman and C. H. Bhosale, J. Photochem. Photobiol., B, 2014, 133, 90–98 CrossRef CAS.
- B. Kiliç, N. Gedik, S. P. Mucur, A. S. Hergul and E. Gür, Mater. Sci. Semicond. Process., 2015, 31, 363–371 CrossRef.
- S. Zhu, F. Yao, C. Yin, Y. Li, W. Peng, J. Ma and D. Zhang, Microporous Mesoporous Mater., 2014, 190, 10–16 CrossRef CAS.
- X. Zhang, Y. Xie, H. Chen, J. Guo, A. Meng and C. Li, Appl. Surf. Sci., 2014, 317, 43–48 CrossRef CAS.
- N. Sobti, A. Bensouici, F. Coloma, C. Untiedt and S. Achour, J. Nanopart. Res., 2014, 16, 2577 CrossRef.
- P. Luan, M. Xie, D. Liu, X. Fu and L. Jing, Sci. Rep., 2015, 4, 6180 CrossRef.
- A. J. Abel, I. Garcia-Torregrosa, A. M. Patel, B. Opasanont and J. B. Baxter, J. Phys. Chem. C, 2015, 119, 4454–4465 CrossRef CAS.
- W. Jo and N. C. S. Selvam, Dalton Trans., 2015, 44, 16024–16035 RSC.
- S. Ito, T. N. Murakami, P. Comte, P. Liska, C. Grätzel, M. K. Nazeeruddin and M. Grätzel, Thin Solid Films, 2008, 516, 4613–4619 CrossRef CAS.
- B. Eftekharinia, A. Moshaii, A. Dabirian and N. S. Vayghan, J. Mater. Chem. A, 2017, 5, 3412–3424 RSC.
- Y. Xia and L. Yin, Phys. Chem. Chem. Phys., 2013, 15, 18627–18634 RSC.
- H. Zhao, W. Fu, H. Yang, Y. Xu, W. Zhao, Y. Zhang, H. Chen, Q. Jing, X. Qi, J. Cao, X. Zhou and Y. Li, Appl. Surf. Sci., 2011, 257, 8778–8783 CrossRef CAS.
- B. Kim, H. Oh, K. Yun, S. Jung, W. Kang and S. Kim, Prog. Org. Coat., 2013, 76, 1869–1873 CrossRef CAS.
- L. Peng, T. Xie, Y. Lu, H. Fan and D. Wang, Phys. Chem. Chem. Phys., 2010, 12, 8033–8041 RSC.
| This journal is © The Royal Society of Chemistry 2019 |

