 Open Access Article
Environmentally friendly nanocrystalline magnesium hydride decorated with metallic glassy-zirconium palladium nanopowders for fuel cell applications†
M. Sherif El-Eskandarany *,
Mohammad Banyan‡
 and
Fahad Al-Ajmi‡
Nanotechnology and Advanced Materials Program, Energy and Building Research Center, Kuwait Institute for Scientific Research, Safat 13109, Kuwait. E-mail: msherif@kisr.edu.kw
First published on 6th September 2019
Abstract
A new solid-state hydrogen storage system of magnesium hydride (MgH2) doped with 5 wt% of metallic glassy (MG) zirconium palladium (Zr2Pd) nanopowder was fabricated using a high-energy ball milling technique. The end-product obtained after 50 h of milling was consolidated into bulk buttons, using a hot-pressing technique at 350 °C. The results have shown that this consolidation step, followed by the repetitive pressing at ambient temperature did not affect the nanocrystalline characteristics of pressed powders. Recycling pressing demonstrated beneficial effects of plastic deformation and lattice imperfections on Mg, leading to its enhanced hydrogenation/dehydrogenation kinetics and cycle-life-time performance compared with untreated samples. The results elucidated that spherical, hard, nanopowder of MG-Zr2Pd were forced to penetrate the Mg/MgH2 matrix to create micro/nanopore structures upon pressing for 50 cycles. These ultrafine spherical metallic glassy particles (∼400 nm in diameter) acted as a micro-milling media for reducing the particle size of MgH2 powders into submicron particles. In addition, they played a vital role as grain growth inhibitors to prevent the undesired growth of Mg grains upon the application of a moderate temperature in the range of 50 °C to 350 °C. The apparent activation energy for the decomposition of this new consolidated nanocomposite material was measured to be 92.2 kJ mol−1, which is far below than the measured value of pure nanocrystalline MgH2 powders (151.2 kJ mol−1) prepared in the present study. This new binary system possessed superior hydrogenation kinetics, indicated by the rather low temperature (200 °C) required to uptake 6.08 wt% H2 within 7.5 min. More importantly, the system revealed excellent dehydrogenation kinetics at 225 °C as implied by the limited time needed to release 6.1 wt% H2 in 10 min. The MgH2/5 wt% MG-Zr2Pd system showed a high performance for cyclability, implied by the achievement of continuous cycles (338 cycles) at 225 °C without degradation over 227 h.
Introduction
In contrast to the great challenges tackled in the research activities of alternative green energy, traditional fossil fuels remain the major energy source.1 The rapid population growth engaged with economic evolution led to a dramatic growth in fossil fuel consumption in both developed and advanced countries.2–4 Accordingly, huge amounts of carbon dioxide and other harmful air pollutants, such as SO2 and NOx, are emitted upon the burning of fossil fuels for power generation.5 Recently, it has been pointed out by different authors that two dimensional materials, such as AlB6,6 Cu2Si,7 transition metal-phthalocyanine (TM-Pc) monolayers,8 single atom catalyst TM–TCNQ monolayers,9 transition metal porphyrin sheets,10 and Mn–graphene single-atom,11 have the potential capacity to catalytically remove gas molecules, such as CO2, SO2 and NOx, or transform them to other species. Among different sources of new/renewable energy options, hydrogen energy carriers have been receiving great attention due to their attractive and unique properties. Owing to its convenient, safe and unusual characteristics, hydrogen has been proposed as an alternative to fossil fuel.6 This is attributed to its convenient production from renewable energy systems (e.g. photovoltaics cells) and the unchallenging procedure used for its conversion into the desired form of energy through fuel cells (FCs).1,7–9Hydrogen in its gaseous state has a very high gravimetric energy density (120 MJ kg−1) compared with petroleum (44 MJ kg−1); however, the storage of hydrogen in sufficient quantities is challenging. Unfortunately, the classic methods proposed for the storage of hydrogen in its gaseous and liquid states show serious drawbacks due to their high cost and safety issues. In contrast, the solid-state hydrogen storage approach, using for example magnesium (Mg) metal as a storage material shows promising practical solutions10,11 due to its reliability, safety and cost effectiveness. Accordingly, Mg, its alloys and compounds have been attracting many researchers in both developed and advanced countries.4 Such a rather new approach has been proposed as the most suitable technique for fuel cell vehicle applications.7,9–12 It is realized that some poor behaviors found in Mg (e.g. large negative enthalpy change of formation, slow hydrogenation/dehydrogenation kinetics below 350 °C, high thermal stability and large apparent value of activation energy) must be solved first before proposing the system for hydrogen storage applications.
Among different methods proposed to improve the hydrogen storage behaviors of Mg (e.g. long term of milling, severe plastic deformation techniques), doping the metal with metallic catalytic agent(s) via high-energy ball milling has shown significant improvements in its behaviors.13 Of these catalysts, pure metals, such as Ni-nanofibers,14 Zr,15 and Nb-nanoparticles,16 had superior effects on reducing the apparent activation energy and minimizing the time required for full absorption/desorption processes. Intermetallic compounds and alloys, such as Ti0.4Cr0.15Mn0.15V0.3,17 ZrCrNi,18 TiAl,19 LaNi5,20 ZrNi5 materials.21 More recently, metastable amorphous and metallic glassy alloys22–25 and quasicrystal phases26 have shown superior effects on improving the kinetic characteristics of MgH2 materials. Table S1† summarizes the hydrogen storage properties of MgH2 upon doping with selected metallic catalytic systems.30–35
The present study has been conducted to investigate the possibility of improving the hydrogen storage behavior of nanocrystalline MgH2 powders upon doping and reactive ball milling (RBM) with different molecular fractions (2.5, 5, and 10 wt%) of metallic glassy (MG) Zr2Ni nanopowders (used here for the first time). More importantly, we have attempted to employ this new nanocomposite system for running an electric golf-cart, using a 1000 W proton-exchange membrane fuel cell (PEM-FC).
Methods
Materials preparation
![[thin space (1/6-em)]](https://www.rsc.org/images/entities/char_2009.gif) :
:![[thin space (1/6-em)]](https://www.rsc.org/images/entities/char_2009.gif) 1 was used. The vial was pressurized with 70 bar of H2, and then mounted on a high-energy ball mill (PM 400, Retsch-Germany). The RBM process was performed at ambient temperature with a speed of 300 rpm. The end-product of the powders obtained after milling for 25 h was completely discharged in the glove box, where a new Mg powder batch was charged into the vial. This procedure, including RBM was repeated for 40 times to obtain about 250 g of MgH2 powders.
1 was used. The vial was pressurized with 70 bar of H2, and then mounted on a high-energy ball mill (PM 400, Retsch-Germany). The RBM process was performed at ambient temperature with a speed of 300 rpm. The end-product of the powders obtained after milling for 25 h was completely discharged in the glove box, where a new Mg powder batch was charged into the vial. This procedure, including RBM was repeated for 40 times to obtain about 250 g of MgH2 powders.![[thin space (1/6-em)]](https://www.rsc.org/images/entities/char_2009.gif) :
:![[thin space (1/6-em)]](https://www.rsc.org/images/entities/char_2009.gif) 1 was used. The mechanical alloying process (MA) was started by mounting the vial on a high-energy ball mill (PM 100, Retsch-Germany) and running it for 25 h at 250 rpm. This process was repeated for 10 times to obtain about 50 g of the powders.
1 was used. The mechanical alloying process (MA) was started by mounting the vial on a high-energy ball mill (PM 100, Retsch-Germany) and running it for 25 h at 250 rpm. This process was repeated for 10 times to obtain about 50 g of the powders.Sample characterization
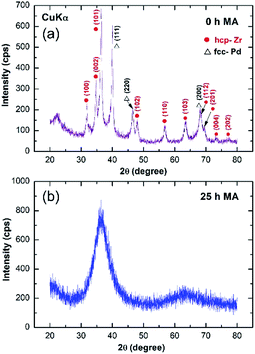
The XRD pattern of the starting mixture powder of Zr67Pd33 is presented in Fig. 2. The powders at this initial stage (0 h) of MA revealed high-intensity Bragg peaks, corresponding to hcp-Zr and fcc-Pd metals (Fig. 2a). After 25 h of MA time, these elemental Bragg lines were replaced by a halo-diffuse pattern (Fig. 2b), implying the formation of amorphous Zr2Pd.
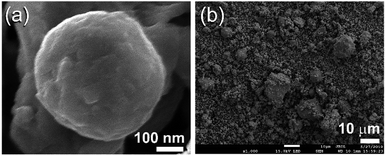
The FE-SEM micrographs of MG-Zr2Pd and MgH2 powders obtained after MA and RBM times of 25 h are shown in Fig. 3a and b, respectively. Metallic glassy powders had a spherical-like morphology with an average particle diameter of 400 nm (Fig. 3a). In contrast, MgH2 powders were bulky and had irregular shapes with a wide particle size distribution (3 μm to 18 μm in diameter), as displayed in Fig. 3b.
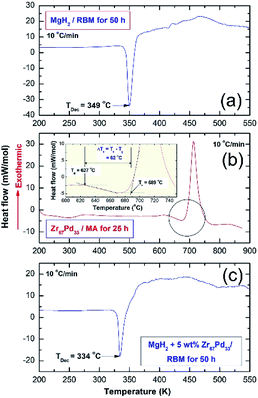
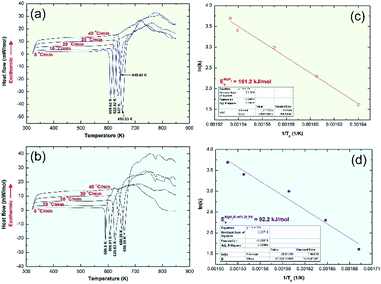
Thermal analysis conducted via DSC was employed to understand the thermal stability of starting feedstock materials as well as the nanocomposite samples obtained after 50 h of RBM. The DSC thermograms of MgH2 and MG-Zr2Pd powders obtained after 50 h of RBM and 25 h of MA are displayed in Fig. 4a and b, respectively. Pure MgH2 powders decomposed through an endothermic peak into Mg and hydrogen at a high temperature of 349 °C, as presented in Fig. 4a. The DSC trace for MG-Zr2Pd revealed two opposite endothermic and exothermic peaks, as displayed in Fig. 4b, where, the endothermic peak corresponds to the glass transformation process taken place at 627 °C (Tg); the sharp exothermic peak appears at an onset temperature (Tx) of 689 °C due to the crystallization of the metallic glassy phase (Fig. 4b). The value of the supercooled liquid region (ΔTx = Tx − Tg) for this binary glassy phase, which was calculated to be 62 °C, indicates the high stability of this phase.
The DSC trace of nanocomposite MgH2/5 wt% MG-Zr2Pd powders obtained after RBM for 50 h is displayed in Fig. 5c. The sample revealed a single decomposition endothermic event centered at a peak temperature of 334 °C (Fig. 4c). This value, which was lower than the one shown for pure MgH2 indexed in Fig. 4a (349 °C), indicates a significant effect of MG-Zr2Pd for decreasing the decomposition temperature of MgH2.
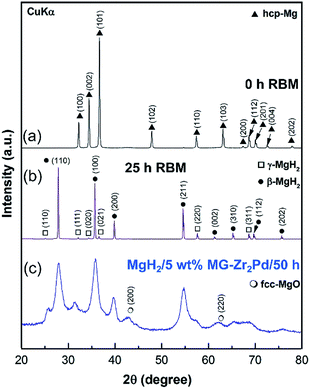 | ||
| Fig. 5 XRD patterns of (a) starting Mg elemental powders, at 0 h and (b) after 25 h of RBM, and the XRD pattern of MgH2/5 wt% MG-Zr2Pd powders obtained after 50 h of RBM is displayed in (c). XRD pattern of as-RBM MgH2 powders obtained after 50 h of milling time is presented in Fig. S1.† | ||
Results and discussion
Structural analysis and morphology
XRD patterns of the elemental Mg polycrystalline metal powder used as the feedstock material to synthesize MgH2 is shown in Fig. 5a. The powder was consisted of large grains, characterized by sharp Bragg peaks of hcp-Mg (PDF file # 00-004-0770). After 25 h of RBM under 50 bar of hydrogen, Bragg lines of Mg completely disappeared and were replaced by a new set of diffracted lines, corresponding to stable β-(PDF file # 00-012-0697) and metastable γ-MgH2 (PDF file # 00-035-1184) phases, as shown in Fig. 5b. Longer RBM time (50 h) led to more grain refining, as suggested by the further broadening of Bragg peaks shown in Fig. S1.† The absence of elemental Mg Bragg lines implied the completion of the RBM process.In order to investigate the doping effect of amorphous Zr2Pd on the hydrogen storage properties of MgH2 powders, the metal hydride was decorated with different weight percentages (2.5, 5 and 10 wt%) of Zr2Pd and high-energy ball milled for selected RBM times under 50 bar of hydrogen gas pressure. The XRD pattern of the as-ball milled MgH2 decorated with 5 wt% Zr2Pd for 50 h is presented in Fig. 5c.
As presented, the metal hydride phases revealed very broad Bragg peaks, implying the formation of nanocrystalline powder particles (Fig. 5c). The powder refinement was attained as a result of high energy milling and the presence of hard amorphous powders that played the role of micro-milling media. The shift shown in the background of Fig. 5c between 2θ = 30° to 42° was attributed to the existence of the Zr2Pd amorphous phase in the composite powders.
The bright field (BF) HRTEM image of the aggregated MgH2/5 wt% Zr2Pd powders obtained after 50 h of RBM is shown in Fig. 6a.
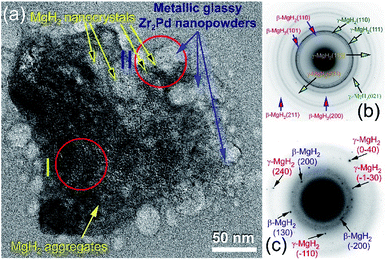 | ||
| Fig. 6 (a) BFI of nanocomposite MgH2/5 wt% Zr2Pd obtained after 50 h of RBM. The SADPs related to zones I and II indexed in (a) are presented in (b) and (c), respectively. | ||
At this final stage of RBM, MgH2 powders had ultrafine grains (∼10 to 20 nm in diameter), as displayed in Fig. 6a. The Miller-indexed selected area diffraction pattern (SADP) taken from zone I indexed in Fig. 6a shows continuous Debye–Scherrer rings related to a tetragonal phase (β-MgH2) overlapped with a metastable orthorhombic γ-MgH2 phase (Fig. 6b). The absence of spots from the SADP indicates the formation of nanocrystalline MgH2 ultrafine powder particles. Spherical fine particles adhered to the MgH2 aggregate (Fig. 6a) were amorphous Zr2Pd nanopowders, as confirmed by nano-beam diffraction (NBD) taken from zone II in Fig. 6a and displayed in Fig. 6c. The NBDP revealed a typical halo-diffuse fashion of an amorphous phase coexisting with a spot-pattern related to fine MgH2 crystals precipitated in metallic glassy powders, as presented in Fig. 6c.
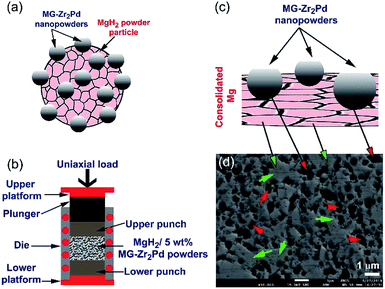
Fig. 7a displays the FE-SEM micrograph of MgH2 powders milled with 5 wt% MG-Zr2Pd nanopowders for 12.5 h. The spherical dispersoids of nanopowders indexed in Fig. 7a are metallic glassy particles adhered to the outermost shell of MgH2 powders. After 50 h of RBM time (Fig. 7b), these decorated nanoparticles penetrated the surface of MgH2 powders by the attrition action of milling the tools to create circular-like micropores in the powder matrix after 50 h of RBM, as presented in Fig. 7b.
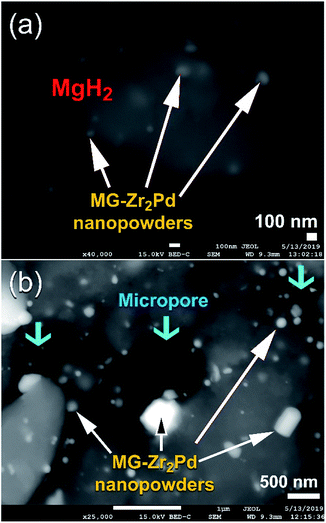 | ||
| Fig. 7 FE-SEM micrographs of nanocomposite MgH2 powders doped with MG-Zr2Pd particles obtained after RBM for (a) 12.5 h and (b) 50 h. | ||
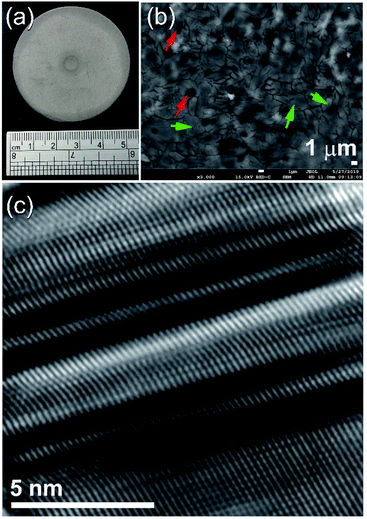
During the hot-pressing procedure (Fig. 1b) that took place under vacuum at 350 °C to obtain bulk nanocomposite buttons (Fig. 8a), MgH2 powder matrix was completely decomposed to form sharp-edged metallic Mg grains, as presented in Fig. 8b. Moreover, MG-Zr2Pd nanoparticles deeply “sunk” into those micropores, as shown in Fig. 8b, by the action of uniaxial load pressing applied to nanocomposite powders. In order to ensure that all the decorated MG-nanoparticles were embedded into the Mg matrix, and to introduce severe plastic deformation to the Mg matrix, the powders were repressed for 50 continuous cycles at 150 °C to obtain a nearly dense (∼85%) button, as shown in Fig. 8a.
The cross-sectional view of the polished sample obtained after 50-hot pressing cycles is presented in Fig. 8b. The sample revealed obvious grain boundary dislocations, yielded as a result of the repetition of applied repressing loading. As this repressing procedure was achieved at a low temperature (150 °C), Mg grains, which are shown by the green labels in Fig. 8b, maintained their ultrafine characteristics with the absence of grain growth, as presented in Fig. 8b. More importantly, the hot-pressing step did not lead to changes in the porous structure of the sample, as indicated by the existing micropores indexed by the red labels in Fig. 8b. Fig. 8c displays the FE-HRTEM image of the as-consolidated Mg/5 wt% MG-Zr2Pd nanocomposite obtained after hot pressing for 50 cycles. The 001 plane of hcp-Mg showed a severe planar defect, indexed by clear twin bands and stacking faults, as presented in Fig. 8c. These plastic deformations and lattice imperfections were introduced to the Mg matrix upon the repressing procedure at a moderate temperature (150 °C).
Thermal stability
In order to realize the effect of doping MgH2 with the metallic glassy phase on the decomposition process at 1 bar of He, DSC experimental sets were individually conducted for pure MgH2 and nanocomposite samples at different heating rates, k (5, 10, 20, 30 and 40 °C). The peak temperatures corresponding to each heating run of both samples were recorded from Fig. 9a and b to design the Arrhenius plots for pure MgH2 (Fig. 9c) and nanocomposite MgH2/5 wt% MG-Zr2Pd (Fig. 9d).The apparent activation energies of decomposition (Ea), calculated from the slopes of the straight lines shown in Fig. S3f† (pure MgH2 sample) and Fig. S3g† (nanocomposite sample) were 151.2 and 92.2 kJ mol−1, respectively. It can be concluded that doping MgH2 with MG-Zr2Pd nanopowders led to an improved decomposition kinetics behavior of MgH2 and lowered its decomposition temperature. The Ea of the present system is lower than those reported for MgH2/10 wt% SrFe12O19 (114.22 kJ mol−1),27 10 wt% MgFe2O4-doped MgH2 composite (99.9 kJ mol),28 Mg–V nanocomposite (147.7 kJ mol−1),29 and Mg–Fe (118.1 kJ mol−1).29 However, it is higher than those of MgH2/10 wt% Ni nanofiber (72 kJ mol−1),14 MgH2/10 wt% Nb nanoparticles (86.4 kJ mol−1),16 MgH2/20 wt% Ti0.4Cr0.15Mn0.15V0.3 (71.2 kJ mol−1),17 and MgH2/7 wt% amorphous-LaNi3 (73.3 kJ mol−1).25
Hydrogenation/dehydrogenation kinetics
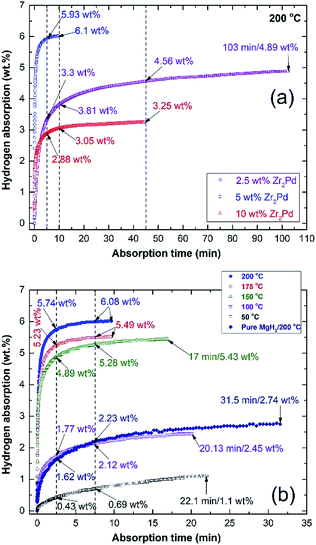
Hydrogenation kinetics measured at 10 bar of H2 at 200 °C for nanocomposite MgH2/x MG-Zr2Pd powders (x; 2.5, 5, and 10 wt%) obtained after 50 h of RBM are displayed in Fig. 10a. In general, all samples that contained different concentrations of MG-Zr2Pd had an excellent ability to absorb hydrogen in a short time at such a rather low temperature. The sample that contained 2.5 wt% Zr2Pd absorbed 3.3 and 3.81 wt% H2 within 5 and 10 min, respectively, as shown in Fig. 10a. It reached higher values after 45 min (4.56 wt% H2) and got saturated at 4.89 wt% H2 after a long time (103 min), as elucidated in Fig. 10a. Increasing the Zr2Pd content to 5 wt% led to an improvement in the hydrogenation kinetics of MgH2, as indexed by the high hydrogen concentration obtained (5.93 wt%) in a short time (5 min), as displayed in Fig. 10a. This sample tends to attain its maximum storage capacity of 6.08 wt% H2 after only 10 min (Fig. 10a). When MgH2 powders were doped with a high Zr2Pd concentration (10 wt%), no further improvement in kinetics could be seen, as indicated by the low storage capacities of 2.88 and 3.05 wt% H2 obtained after 5 and 10 min, respectively, as displayed in Fig. 10a. After 10 min of hydrogenation time, the sample reached its saturation value of 3.25 wt% H2 (Fig. 10a).However, the sample that contained 5 wt% MG-Zr2Pd had a higher mass% of the catalytic agent compared with one that contained only 2.5 wt% MG-Zr2Pd, showed a higher hydrogen storage capacity of 6.1 wt%. Based on morphological examinations, we found that 5 wt% MG-Zr2Pd contained numerous micropores, which acted as hydrogen diffusion gateways to facilitate a better and fast hydrogen diffusion. In contrast to this and based on SEM investigations, we found that a large volume fraction of MG-Zr2Pd nanopowders was agglomerated together due to electrostatic attractions and van der Waals phenomenon. These aggregated glassy nanoparticles failed to penetrate the MgH2 matrix and were abundantly distributed far from the metal hydride powders. Thus, MgH2/5 wt% MG-Zr2Pd presented the best composition in this study.
After studying the effect of MG-Zr2Pd on the kinetics of MgH2 powders, we investigated the effects of consolidation and temperature on the hydrogenation kinetics of the nanocomposite MgH2/5 wt% MG-Zr2Pd button (Fig. 10b). The hydrogenation kinetics of the consolidated sample, which was measured at 200 °C, showed superior kinetics, indicated by the very short time required to absorb 5.74 and 6.08 wt% H2 within 2.5 and 7.5 min, respectively, as indicated in Fig. 10b. By comparing these values with those for the powder sample, we can conclude that the hot pressing led to improved gas uptake kinetics. This significant improvement of the hydrogenation kinetics can be attributed to two reasons: (i) the introduction of high intensity lattice imperfections and plastic deformation to the sample upon repressing for 50 cycles (Fig. 8b and c), and (ii) the formation of a micropore network in the sample, which was developed due to the penetration of the Mg matrix by hard, spherical, Zr2Pd nanoparticles (Fig. 1). It can be claimed that the present fabricated system has superior absorption kinetics compared with pure MgH2 button measured at the same temperature (200 °C) that required a very long time (31.5 min) to absorb only 2.74 wt% H2 (Fig. 10b).
The gas uptake kinetics of the consolidated sample slightly decreased with the decrease in the absorption temperature to 175 °C and 150 °C, respectively (Fig. 10b). This can be realized from the rather long time that was needed to absorb 5.49 wt% H2 (7.5 min/175 °C) and 5.43 wt% H2 (150 °C), as displayed in Fig. 10b. Further decreasing the absorption temperature to 100 °C and 50 °C led to a dramatic decrease in the storage capacity of Mg, which tended to uptake 2.45 wt% H2 and 1.1 wt% H2, respectively (Fig. 10b).
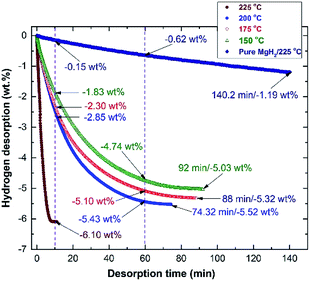
The corresponding dehydrogenation kinetics of the nanocomposite MgH2/5 wt% MG-Zr2Pd button was measured at different temperatures under 0.4 bar of H2, and the results are plotted in Fig. 11. The as-consolidated pure MgH2 button (0 wt% Zr2Pd) revealed very slow dehydrogenation kinetics at 225 °C, as indicated by the very long time (140.2 min) required to release only −1.19 wt%, as displayed in Fig. 11. In contrast, when MgH2 was milled with 5 wt% Zr2Pd before consolidation at 350 °C, a significant improvement in gas releasing kinetics was attained at 225 °C (Fig. 11). This is characterized by the very short time consumed (10 min) to discharge the full capacity of the sample (−6.10 wt% H2), as presented in Fig. 11.
Decreasing the desorption temperature to 200 °C, 175 °C and 150 °C led to a serious decrease in the hydrogen release from the samples to −2.85, −2.3 and −1.83 wt%, respectively (Fig. 11). An obvious improvement in dehydrogenation kinetics was obtained when the time was increased to 60 min. This is implied by the dramatic increase of the gas discharge to be −5.43, −5.1 and −4.74 wt% H2, measured at 200 °C, 175 °C and 150 °C, respectively (Fig. 11). These samples were able to fully discharge their hydrogen capacities of −5.52, −5.53 and −5.03 wt% within 74.32, 88, and 92 min, respectively, as elucidated in Fig. 11.
Cycle-life-time
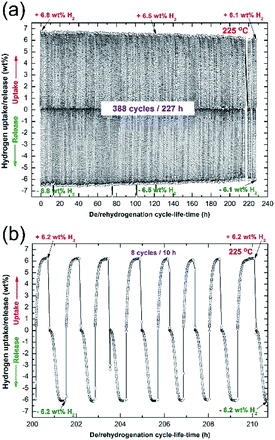
Hydrogenation/dehydrogenation cyclability is a very important characterization technique used here to examine the capability of the nanocomposite MgH2/5 wt% MG-Zr2Pd button to achieve continuous hydrogen charging/discharging for a long time without failure or serious degradation. The cycle-life-time curve of the consolidated sample obtained at 225 °C under the uptake/release pressures of 10/0.5 bar of H2 is presented in Fig. 12a. The bulk sample was first treated under high temperature/pressure (350 °C/35 bar H2) for 24 h to ensure the removal of the MgO layer coated on the button. This activation step was necessary to improve the kinetics and to increase the hydrogen storage capacity to approach a high value of 6.8 wt% (Fig. 12a).In general, the sample showed a good performance by achieving 388 cycles within 227 h without kinetic degradation, as presented in Fig. 12a. However, the sample suffered from a monotonical decrease on its storage capacity, as suggested by the hydrogen capacity decrease attained after 120 h (Fig. 12a). Hydrogen capacity was continuously decreased with the increasing cycle-life-time, which approached 6.1 wt%, as displayed in Fig. 12a. The last 8 cycles, presented in Fig. 12b, indicate that hydrogenation/dehydrogenation kinetics maintained their capability of achieving fast gas uptake/release processes.
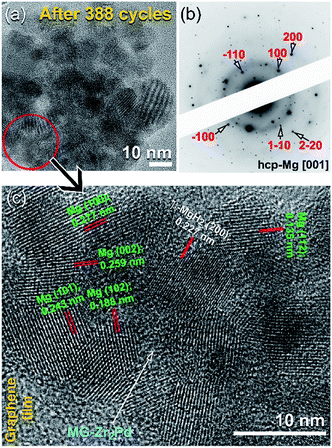
Fig. 13a presents the FE-HRTEM image of the nanocomposite MgH2/5 wt% MG-Zr2Pd sample after achieving 388 cycles (Fig. 12a). The sample was composed of Mg powder particles (∼12 nm in diameter) surrounded by spherical MG-Zr2Pd nanoparticles, as shown Fig. 13a. The SADP (Fig. 13a) taken from the circular zone indexed in Fig. 12a revealed a spot-like diffraction related to hcp-Mg [001] overlapped with the halo-diffuse pattern of the MG-Zr2Pd phase, as elucidated in Fig. 13b. An atomic resolution TEM image of the red-zone indexed in Fig. 13a is displayed in Fig. 13c. The sample possessed the nanocrystalline structure of Mg metal, characterized by a number of lattice fringes as presented in Fig. 13c. However, a small volume fraction of undecomposed MgH2 particles existed, as indicated by the presence of β-MgH2 (200). It is noteworthy to mention that hard MG-Zr2Pd nanoparticles surrounded Mg particles played an important role in preventing the metal from severe grain growth. Thus, they can be considered as grain growth inhibitors, facilitating good performance of the Mg metal while enhancing its hydrogen storage behavior.
Conclusions
A solid-state hydrogen storage binary system of MgH2/5 wt% MG-Zr2Pd nanocomposite powder was fabricated by a high-energy ball milling technique. A 20-ton hot-press operated at 350 °C was employed to consolidate the nanocomposite powders obtained after 50 h of milling. The as-consolidated buttons were severely plastically deformed upon cycling loading for 50 cycles at 150 °C. The cycled-buttons maintained their original nanograin characteristics without undergoing an undesired grain growth. The loading/unloading strategy used in the present study had significant beneficial effects on improving the hydrogen storage behavior of the nanocomposite system. This is indicated by the fast gas uptake and release of 6.08 wt% H2 within 7.5 min and 10 min at 200 °C and 225 °C, respectively. The Ea of the decomposition, which was calculated to be 92.2 kJ mol−1, is far below than the one calculated for pure nanocrystalline MgH2 powders (151.2 kJ mol−1).The morphological examinations conducted for this system indicated that the hard MG-Zr2Pd spherical nanopowders were forced to penetrate into the Mg/MgH2 matrix to create micro/nanopore structures upon pressing for 50 cycles. These ultrafine glassy powders occupied their catalytic sites in those pores (hydrogen diffusion pathways) to facilitate fast hydrogen absorption and desorption processes and to prevent the undesired growth of Mg/MgH2 grains. The newly fabricated nanocomposite system had excellent cyclability, indicated by the achievement of continuous cycles (338 cycles) at 225 °C without degradation over 227 h.
Conflicts of interest
There are no conflicts to declare.Acknowledgements
This work has been partially funded by Kuwait Foundation for the Advancement of Sciences (KFAS) related to the Project EA078C under a contract number: PR1814SP12. The financial support received by the Kuwait Government through the Kuwait Institute for Scientific Research for purchasing the equipment used in the present work, using the budget dedicated for the project led by the first author (P-KISR-06-04) of Establishing Nanotechnology Center in KISR is highly appreciated.Notes and references
- R. Bardhan, A. M. Ruminski, A. Brand and J. J. Urban, Energy Environ. Sci., 2011, 4, 4882–4895 RSC.
- A. Schneemann, J. L. White, S. Y. Kang, S. Jeong, L. F. Wan and E. S. Cho, et al., Chem. Rev., 2018, 118, 10775–10839 CrossRef CAS.
- T. Latake, P. Pawar and C. Ranveer, International Journal of Innovative Research and Creative Technology, 2015, 1, 333–337 Search PubMed.
- M. S. El-Eskandarany, RSC Adv., 2019, 9, 9907–9930 RSC.
- B. Jackson, L. Quéré, M. Andrew, G. Canadell, P. Peters and J. Roy, et al., Environ. Res. Lett., 2017, 12, 110202 CrossRef.
- B. Song, Y. Zhou, H.-M. Yang, J.-H. Liao, L.-M. Yang, X.-B. Yang and E. Ganz, J. Am. Chem. Soc., 2019, 141, 3630–3640 CrossRef CAS.
- L.-M. Yang, V. Bačić, I. A. Popov, A. I. Boldyrev, T. Heine, T. Frauenheim and E. Ganz, J. Am. Chem. Soc., 2015, 137, 2757–2762 CrossRef CAS.
- J.-H. Liu, L.-M. Yang and E. Ganz, ACS Sustainable Chem. Eng., 2018, 6, 15494–15502 CrossRef CAS.
- J.-H. Liu, L.-M. Yang and E. Ganz, J. Mater. Chem. A, 2019, 7, 3805–3814 RSC.
- J.-H. Liu, L.-M. Yang and E. Ganz, J. Mater. Chem. A, 2019, 7, 11944–11952 RSC.
- L. Xu, L.-M. Yang and E. Ganz, Theor. Chem. Acc., 2018, 137, 98, DOI:10.1007/s00214-018-2270-8.
- K. Fu, J. Chen, R. Xiao, J. Zheng, W. Tian and X. Li, Energy Environ. Sci., 2018, 11, 1563–1570 RSC.
- P. Jain, Int. J. Hydrogen Energy, 2009, 34, 7368–7378 CrossRef.
- A. Yarts, V. Lototskyy, E. Akiba, A. Albret, E. Antonov and R. Ares, et al., Int. J. Hydrogen Energy, 2019, 44, 7809–7859 CrossRef.
- M. S. El-Eskandarany, Mechanical Alloying: Nanotechnology, Materials Science and Powder Metallurgy, Elsevier Inc., Oxford, 2nd edn, ch. 9, 2015 Search PubMed.
- A. Sartbaeva, V. L. Kuznetsov, S. A. Wells and P. P. Edwards, Energy Environ. Sci., 2008, 1, 79–85 RSC.
- C. Weidenthaler and M. Felderhoff, Energy Environ. Sci., 2011, 4, 2495–2502 RSC.
- P. Jain, C. Lal and A. Jain, Int. J. Hydrogen Energy, 2010, 35, 5133–5144 CrossRef.
- C. Zhou, Z. Fang and C. Bowman, J. Phys. Chem. C, 2015, 119, 22261–22271 CrossRef CAS.
- J. Chen, G. Xia, Z. Guo, Z. Huang, H. Liu and X. Yu, J. Mater. Chem. A, 2015, 3, 15843–15848 RSC.
- X. Ding, Y. Li, F. Fang, D. Sun and Q. Zhang, J. Mater. Chem. A, 2017, 5, 5067–5076 RSC.
- T. Liu, X. Ma, C. Chen, L. Xu and X. Li, J. Mater. Chem. C, 2015, 119, 14029–14037 CAS.
- B. Yu, X. Yang, K. Liu, M. Grant and S. Walker, Int. J. Hydrogen Energy, 2010, 35, 6338–6344 CrossRef.
- S. Agarwal, A. Aurora, A. Jain, I. P. Jain and A. Montone, Int. J. Hydrogen Energy, 2009, 34, 9157–9162 CrossRef CAS.
- C. Zhou, Z. Fang, C. Ren, J. Li and J. Lu, J. Mater. Chem. C, 2013, 117, 12973–12980 CAS.
- Y. Fu, M. Groll, R. Mertz and R. Kulenovic, J. Alloys Compd., 2008, 460, 607–613 CrossRef CAS.
- M. S. El-Eskandarany, E. Shaban, H. Al-Matrouk, M. Behbehani, A. Alkandary and F. Aldakheel, et al., Materials Today Energy, 2017, 3, 60–71 CrossRef.
- M. S. El-Eskandarany, Sci. Rep., 2016, 6, 26936 CrossRef CAS.
- M. S. El-Eskandarany, H. Al-Matrouk, M. Behbehani, E. Shaban, A. Alkandary and F. Aldakheel, et al., Mater. Chem. Phys., 2018, 203, 17–26 CrossRef CAS.
- M. S. El-Eskandarany, RSC Adv., 2019, 9, 1036 RSC.
- M. S. El-Eskandarany, M. Saeed, E. Al-Nasrallah, M. Banyan and F. Al-Ajmi, Energies, 2019, 12, 1005 CrossRef CAS.
- K. Pandey, A. Bhatnagar, S. Mishra, P. Yadav, A. Shaz and N. Srivastava, J. Phys. Chem. C, 2017, 121, 24936–24944 CrossRef.
- N. S. Mustafa, N. N. Sulaiman and M. Ismail, RSC Adv., 2016, 6, 110004–110010 RSC.
- N. A. Ali, N. H. Idris, M. F. Md Din, N. S. Mustafa, N. A. Sazelee and F. A. Halim Yap, et al., RSC Adv., 2018, 8, 15667–15674 RSC.
- Y. Liu, J. Zou, X. Zeng and W. Ding, RSC Adv., 2015, 5, 7687–7696 RSC.
Footnotes |
| † Electronic supplementary information (ESI) available. See DOI: 10.1039/c9ra05121j |
| ‡ Mohammad Banyan and Fahad Al-Ajmi are equally contributed to this work. |
| This journal is © The Royal Society of Chemistry 2019 |

