 Open Access Article
Surface hardness and flammability of Na2SiO3 and nano-TiO2 reinforced wood composites†
Edita Garskaite*a,
Olov Karlssona,
Zivile Stankeviciuteb,
Aivaras Kareivab,
Dennis Jonesa and
Dick Sandberga
aWood Science and Engineering, Department of Engineering Sciences and Mathematics, Luleå University of Technology, Forskargatan 1, SE-931 87 Skellefteå, Sweden. E-mail: edita.garskaite@ltu.se; Tel: +46-72-2332094
bInstitute of Chemistry, Faculty of Chemistry and Geosciences, Vilnius University, Naugarduko 24, Vilnius LT-03225, Lithuania
First published on 10th September 2019
Abstract
The objective of this study was to explore an effect of the combined inorganic materials on the wood hardness and flame-retardancy properties in a concept of sustainable material management. Herein, the reinforcement of Scots pine (Pinus sylvestris L.) sapwood with sodium silicate and TiO2 nanoparticles via vacuum-pressure technique is reported. Pyrolysis of modified wood was studied by TG-FTIR analysis; the results showed that maximum weight loss for the modified wood was obtained at 40–50 °C lower temperatures compared to the reference untreated wood. The Gram–Schmidt profiles and spectra extracted at maxima absorption from Gram–Schmidt plots indicated chemical changes in wood–inorganic composites. SEM/EDS analysis revealed the presence of Na–O–Si solid gel within the wood-cell lumen and showed that TiO2 was homogeneously distributed within the amorphous Na–O–Si glass-forming phase to form a thin surface coating. EDS mapping further revealed the higher diffusivity of sodium into the cell wall compared to the silicon compound. The presence of amorphous sodium silicate and nano-TiO2 was additionally confirmed by XRD analysis. FTIR spectra confirmed the chemical changes in Scots pine sapwood induced by alkalization. Brinell hardness test showed that the hardness of the modified wood increased with the highest value (44% increase in hardness) obtained for 10% Na2SiO3–nTiO2 modified wood. The results showed good correlation between TG and flammability test; limiting oxygen index (LOI) values for the wood–inorganic composites increased by 9–14% compared to the untreated wood.
1. Introduction
Wood is a sustainable natural resource used in a wide range of environments and commodities. Thus, the development of non-toxic, durable, safe and fire-resistant wood products for outdoor and indoor applications is of great importance.1,2 To enhance the fire protection of wood, various organic and inorganic compounds have been explored in recent decades.3–6 The conventional flame-retardant processing techniques involve impregnation with flame retardants or applying fire-proof coatings to the wood surface. However, most of the treatments are not durable as treated wood often becomes moisture sensitive, i.e. leakage of fire retardant when the wood is exposed to elevated moisture, discoloured or corrosive. The mechanical strength of wood might also be reduced.Mixed-metal silicates due to their chemical inertness, high melting point, optical transparency and insulating properties have been used in many industrial applications. These materials conventionally are produced by the sol–gel process, i.e. when several combined components react with or without heating to produce series of gels and crystalline compounds that form a new hardened material. Due to the synergetic effect of these components at high temperatures, the physico-chemical properties can be further tailored depending on the various processing conditions applied. Thus, the versatility of silicates and their properties make these systems especially interesting for wood protection. Studies showed that wood modification with silicate compounds can improve the elasto-mechanical properties, dimensional stability, and reduce the moisture sorption of the wood material. Furthermore, it leads to protection against UV-radiation as well as degrading and staining fungi and insects.7–9 It is also known that for the best performance of modified wood, an incorporation of the modifying agent into the wood cell wall, i.e. diffusion and reaction or physical/mechanical interaction of chemical compound with hydroxyl groups of the cell wall constituents, is crucial. Other chemical compounds such as copper amine, acetic acid, formic acid, 1,3-dimethylol-4,5-dihydroxyethyleneurea (DMDHEU) and their combinations to improve long-term performance of wood products have also been used.10–12
Attempts have also been made to impregnate the wood matrix with ceramic materials from various suspensions. Fu et al. prepared the organic/inorganic wood–hybrid composites when a hydrocolloidal suspension of montmorillonite clay was used as a filler.13 In a study by Akaki et al., a suspension of hydroxyapatite (HAP) was used to treat Japanese cedar (Cryptomeria japonica) and Japanese cypress (Chamaecyparis obtusa) sapwood.14 Similarly, Taghiyari et al. used a suspension of aluminium oxide nanoparticles to impregnate poplar wood.15 Impregnation of wood with metal particulates is also well described in literature. For instance, Evans et al. used X-ray micro-computed tomography to show the micro-distribution of copper in pine wood treated with particulate wood preservatives.16
With regard to the surface treatment, equally to the bulk impregnation, extensive studies were carried out to investigate different mineral loaded coatings. Li et al. showed that TiO2 can significantly affect the formation of char and reduce flame spread of the combustible wood substrate.17 Further, transparent TiO2/Ce xerogel coatings deposited on spruce (Picea abies) wood were shown to be an effective UV absorber and might act as protective system against photo-initiated degradation.18 It is well known that of the main constituents of the wood, i.e. cellulose (40 to 50% of the wood composition), hemicelluloses (25 to 30%) and lignin (15 to 30%), lignin absorbs most strongly in the UV/visible region of the solar radiation. Further, the study performed by Blanchard and Blanchet indicated that efficiency of coatings loaded with CeO2 and ZnO depends on the particle size.19 The deposition of hetero-structured TiO2/Cu2O films exhibiting super-amphiphobicity and antibacterial activity was also reported.20
Depending on the physical phenomena involved in the process, wood impregnation can be classified as diffusive, capillary, or hydrostatic (pressure treatment). In industry, the impregnation of wood is mainly carried out by using an autoclave-based process, where chemicals in an aqueous solution are impregnated into the wood using vacuum and pressure in a predefined cycle. In a laboratory, different approaches are used, such as pressure, ultrasonic impregnation, solvothermal/hydrothermal, microwave-assisted impregnation, dip-coating or a combination of several techniques.18,21–24 The reader is also referred to a comprehensive review on the sol–gel wood preservation.25 Considering the numerous studies undertaken to produce universal formulation for wood protection, one can relate that there is still need for alternatives with fewer health and environmental concerns, whilst wood properties such as mechanical strength, fire-retardancy, corrosion and photo-degradation need to be preserved after modification.
Herein, we report the reinforcement of sapwood of Scots pine (Pinus sylvestris L.) using aqueous formulations of sodium metasilicate and nano-TiO2 via a vacuum-pressure technique. A multiple approach based on commercially available wood-treatment technologies, select nontoxic materials, and an environmentally friendly solvent – water, was pursued. Nano-TiO2 was chosen as an UV-absorbing inorganic filler, which by absorbing photon energy from solar radiation could block a wide variety of chemical changes on wood surfaces and thus reduce photodegradation and colour changes of the wood. An aqueous solution of highly-diffusible sodium metasilicate was selected in an attempt to enhance the diffusion of TiO2 nanoparticles into the wood matrix. Structural analysis of prepared wood composites and distribution of nano-TiO2 were examined by TG-FTIR spectroscopy, FE-SEM/EDX and XRD techniques. The flammability of reinforced wood was evaluated by performing the limiting oxygen index (LOI) test. The Brinell hardness test of the reinforced wood was also performed and the effect of the fractional content of inorganic substance on the compression strength is reported and discussed. Results demonstrate that wood modification using sodium silicate in combination with ceramics may allow for the exploration of a broader range of wood material properties in a concept of sustainable material management.
2. Experimental
2.1. Preparation of formulations
A sodium silicate solution (Na2O·(SiO2)x·xH2O (26.1% silica, 8.1% sodium oxide), Technical, VWR Chemicals), denoted as Na2SiO3 or water glass (WG), and titanium dioxide nanopowder (nTiO2, Degussa P25 (70% anatase, 30% rutile; with a surface area of 50 m2 g−1), Evonic) were used as precursor materials. Four different formulations were used in this study: two aqueous Na2SiO3 solutions (10% and 20% by volume respectively), and two suspensions that were prepared by suspending 0.5 g of TiO2 nanopowders into 300 mL of the aforementioned sodium silicate solutions. The latter mixtures were sonicated for 30 minutes to obtain homogeneous suspensions.2.2. Wood treatment
Specimens of Scots pine (Pinus sylvestris L.) sapwood having sizes of 10 × 10 × 150 mm or 18 × 70 × 150 mm (tangential (T) × radial (R) × longitudinal (L)) were cut from boards obtained from northern Sweden. Specimens were dried in oven at 103 °C for 48 h and then conditioned in a climate chamber (20 °C, 65% relative humidity (RH)) for 5 days (for the larger specimens the oven drying step was omitted to reduce the risk of cracking). The specimens were weighed before and after the conditioning, and the moisture content (MC) of these samples was estimated to be approximately 11.3% based on dry weight. Part of the conditioned wood specimens were submerged into the sonicated formulations and subsequently treated by vacuum-pressure technique using a MAVEB impregnation tube (autoclave). The specimens were kept in vacuum (−50 kPa) for 30 minutes and then for 1 h at a pressure of 1500 kPa (the specimens were not end-sealed at impregnation). After the vacuum-pressure treatment, the specimens were submerged for 2 h in the formulations to allow maximum diffusion of the solution into the wood. Afterwards, the treated specimens were dried at room temperature for 24 h and then additionally conditioned in a climate chamber at a temperature of 20 °C and 65% RH for 5 days. Some of the vacuum-pressure treated and conditioned samples were dry grinded using FRITSCH cutting mill (FRITSCH GmbH; Germany) and further used for analysis.2.3. Characterization
Thermal behaviour of unmodified and pressure-treated wood was evaluated by performing thermogravimetry (TG) coupled with the Fourier transform infrared (FT-IR) spectroscopy, using a PerkinElmer TGA 4000 instrument. The weight of specimens was about 6 mg. The specimens were heated from 30 °C to 810 °C with a constant rate of 10° min−1 and held at 810 °C for 10 min, whilst nitrogen was used as the purge gas (flow supply 2 bar). FT-IR spectrometer (Frontier FT-IR, PerkinElmer, DTGS detector) equipped with a gas-flow cell (the temperature for gas-flow cell and transfer line was 275 °C, nitrogen gas-flow rate was 20 mL min−1) was used in conjunction with TG analysis to record infrared (IR) absorption spectra of volatile components evolved from the sample. IR spectra over the range of 4000–450 cm−1 were collected every 6 s at 8 cm−1 resolution. Spectrum TimeBase software was used for analysis of the time-resolved IR data. FTIR spectra of the homogeneously mixed wood powders of the untreated and modified wood were recorded using the same FT-IR spectrometer (ZnSe/Diamond ATR crystal, DTGS detector, 4000–600 cm−1, 4 scans). The morphological features and elemental composition of TiO2 nanopowders and wood–inorganic composites were evaluated by using field emission scanning electron microscope (FE-SEM, SU70, Hitachi) equipped with the energy dispersive X-ray spectrometer (EDS), and the spectrometer was controlled by the INCA software (Oxford Instruments). The uncoated specimens wood blocks (1.0–1.5 mm in thickness; cut in the radial direction leaving 1 cm from the wood block side) and powders were examined using secondary electron (SE) and the electron beam acceleration voltage was 10 kV and 15 kV for SEM and EDS analysis, respectively. An X-ray acquisition time of 60 s was used to obtain the EDS spectra. The structure and phase purity of wood–inorganic composite powders were studied by X-ray diffraction (XRD, Rigaku, MiniFlex II, Cu-Kα radiation, λ = 0.1542 nm, 40 kV, 100 mA, 2θ = 20–70°) analysis. Five specimens were analyzed for each batch of material and 3–5 measurements were performed on each specimen.2.4. Proof of bonding and determining the moisture relationship of modified wood
Weight percentage gain (WPG) of the specimens after modification was calculated as:26| WPG = (m1 − m0)/m0 | (1) |
The sorption–desorption properties of modified wood were evaluated by calculating an equilibrium moisture content (EMC) using following equation:
| EMC = (m2 − m1)/m1 | (2) |
2.5. Brinell hardness
Brinell hardness was measured using Zwick Roell ZwickLine 2.5 TS universal testing machine equipped with a 2.5 kN load cell, and a steel ball with a diameter (D) of 10 mm was used for the indentation. The force was increased at a rate of 4 kN min−1 to a nominal force (F) of 1 kN, which was held for 25 s before being released. According to the EN-1534 standard, the Brinell hardness is calculated from the diameter of the indentation in the specimen. Here, the Brinell hardness (HB) was calculated from the depth of the indentation due to the absence of clear border of the indentation in wood and difficulty to estimate a clear diameter of it. HB is calculated using following formula:27
 | (3) |
The unmodified and the vacuum-pressure treated specimens with the dimension of 18 × 70 × 150 mm (n = 3) dried at room temperature for 48 h or for 3 months were tested. 14–15 and 11–12 Brinell hardness measurements were performed on the specimens dried for 48 h and 3 months, respectively.
2.6. Flammability test
The flammability of the untreated and treated wood was evaluated from limiting oxygen index (LOI) values that were measured using oxygen index instrument (Fire Testing Technology, USA). Five specimens were tested for each treatment group (unmodified wood, 10% Na2SiO3, 10% Na2SiO3/-nTiO2, 20% Na2SiO3 and 20% Na2SiO3/-nTiO2). O2 and N2 gas flow was 2.5 bar and 2.0 bar, respectively. The O2% was adjusted from 24–41%. The dimensions of specimens (10 × 10 × 150 mm) were according to the User's guide for the LOI (11309-850-3, Issued by Fire Testing Technology Limited, West Sussex, UK) to BS 2782: Part 1: Method 141 and ISO 4589 (form of the specimens II (form of materials that are self-supporting)). The video of flammability was recorded using iPhone 7 camera (ESI Video_1†).3. Results and discussion
3.1. Thermal behaviour
The thermal behaviour of unmodified wood and that treated with Na2SiO3 and nano-TiO2 was evaluated simultaneously performing TG and FTIR gas analyses. TG and derivative thermogravimetric (DTG) curves of unmodified wood material are presented in Fig. 1.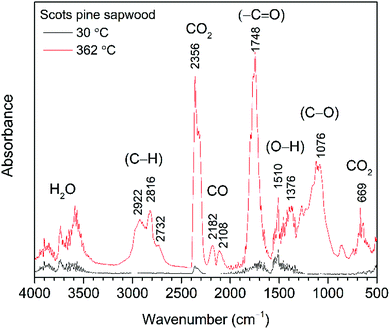 | ||
| Fig. 1 FTIR absorption spectra obtained at 30 °C and 362 °C (maxima weight loss during the pyrolysis) from TG-FTIR gas analysis of untreated Scots pine sapwood. | ||
Three main steps of weight loss were clearly seen in the DTG curve. The first weight loss of 5% was observed by heating the sample up to 105 °C (maxima at 72 °C, DTG curve) and was assigned to the removal of absorbed water. The second, most significant, step of weight loss (67%) was observed in the range of 270–400 °C (maxima at 362 °C, DTG curve). At such temperature region wood components started to undergo rapid pyrolysis: the hemicelluloses, celluloses and lignin components were pyrolyzed in the range of 200–300 °C, 280–350 °C and 280–650 °C, respectively.28 Therefore, this weight loss step was ascribed to a series of reactions involving dehydration, decarboxylation, decarbonylation and fragmentation. As a result, components such as CO2, CO, acetic acid (CH3COOH), methanol (CH3OH) and high-boiling point tar were released.28 The third gradual 33% weight loss was observed in the temperature range of 400–810 °C and was related to the further degradation of lignin that decomposed by being oxidized to CO2, CO and H2O. The remaining solid carbon-rich inorganic residue was 4% of initial mass. Similar trends in wood pyrolysis have been demonstrated by other authors.29–33
The FTIR absorbance spectra three-dimensional (3D) stack plot from the pyrolysis of unmodified wood (Fig. 2) showed few regions associated with strong absorption.
At temperatures around 100 °C, a small amount of H2O molecules was released and their characteristic absorption bands could be found at about 1640 cm−1 and in the region of 3800–3500 cm−1. These were assigned to the bending and stretching modes of O–H bond, respectively. Traces of CO2, a molecule that shows principle absorbance of IR radiation in the region of 2450–2200 cm−1, was also observed. Between 150 °C and 200 °C, molecular products such as CO2 and CO were formed, although up to 175 °C the development of these gases was relatively slow. With increasing pyrolysis temperature up to 300 °C, gases were rapidly developed, the amount of CO2 and CO goes down quickly, and rather large amounts of readily combustible carbohydrates were produced. The flame point was found to lie between 225 °C and 260 °C, whilst the burning point followed between 260 °C and 290 °C. An extracted FTIR absorbance spectrum of volatile components at the temperature of 362 °C (the major weight loss of Scots pine sapwood during the pyrolysis, Fig. 1) is presented in Fig. 3. The strong absorption bands in the 2390–2250 cm−1 (maxima at 2364 cm−1) and 730–590 cm−1 (maxima at 669 cm−1) regions were characteristic bands of CO2. The presence of carbon monoxide was observed in the 2250–2000 cm−1 region by the dual band with the maxima at 2182 cm−1 and 2108 cm−1, and these were assigned to the stretching modes of CO. As described above, a broad absorption in the 4000–3500 cm−1 region and another ∼1640 cm−1 was caused by the H2O. In addition to CO2, CO and H2O other volatile species were also observed. The strong absorption band with a maximum at 1746 cm−1 was assigned to the C![[double bond, length as m-dash]](https://www.rsc.org/images/entities/char_e001.gif) O stretching vibrations of carboxyl group present in the acetic acid and formic acid (HCOOH).34,35 The bands located at ∼1240, 1134 and 640 cm−1 also indicated the formation of formic acid.36–39 Along with carboxyl group containing products, aliphatic hydrocarbons were also obtained. The characteristic C–H stretching vibrations for these species occurred between 3000 and 2800 cm−1, where the C–H stretch of the methyl group (∼2960 cm−1 asym./∼2875 cm−1 sym.) occurred at slightly higher frequencies than those of the methylene groups (∼2930 cm−1 asym./∼2855 cm−1 sym.).40 Also, the stretching vibrations of the C
O stretching vibrations of carboxyl group present in the acetic acid and formic acid (HCOOH).34,35 The bands located at ∼1240, 1134 and 640 cm−1 also indicated the formation of formic acid.36–39 Along with carboxyl group containing products, aliphatic hydrocarbons were also obtained. The characteristic C–H stretching vibrations for these species occurred between 3000 and 2800 cm−1, where the C–H stretch of the methyl group (∼2960 cm−1 asym./∼2875 cm−1 sym.) occurred at slightly higher frequencies than those of the methylene groups (∼2930 cm−1 asym./∼2855 cm−1 sym.).40 Also, the stretching vibrations of the C![[double bond, length as m-dash]](https://www.rsc.org/images/entities/char_e001.gif) C–H bond in unsaturated and aromatic carbohydrates appeared at higher frequency (3100–3000 cm−1). The 1400–900 cm−1 region showed multiple overlapping bands. The bands between 1150 cm−1 and 1000 cm−1 arose from the C–O stretching, while the broad absorption band displayed at ∼1376 cm−1 was ascribed to the characteristic vibrations of the O–H group and corresponded to evolved alcohols and phenols. Similar FTIR spectra of evolved components from the pyrolysis of pine sawdust were demonstrated by Gao et al.29 The FTIR gas absorbance spectra were consistent with TG data and it was observed that at a temperature above 500 °C (Fig. 2), the strong FTIR absorbances were due to release of CO2 as a result of the burn-up.
C–H bond in unsaturated and aromatic carbohydrates appeared at higher frequency (3100–3000 cm−1). The 1400–900 cm−1 region showed multiple overlapping bands. The bands between 1150 cm−1 and 1000 cm−1 arose from the C–O stretching, while the broad absorption band displayed at ∼1376 cm−1 was ascribed to the characteristic vibrations of the O–H group and corresponded to evolved alcohols and phenols. Similar FTIR spectra of evolved components from the pyrolysis of pine sawdust were demonstrated by Gao et al.29 The FTIR gas absorbance spectra were consistent with TG data and it was observed that at a temperature above 500 °C (Fig. 2), the strong FTIR absorbances were due to release of CO2 as a result of the burn-up.
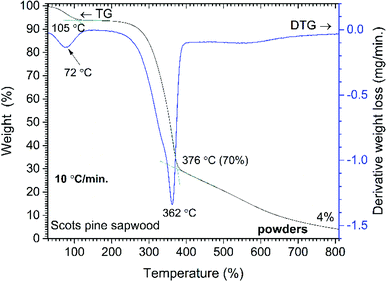 | ||
| Fig. 3 Percent weight-loss curve and derivative profile versus temperature for unmodified Scots pine sapwood powders. | ||
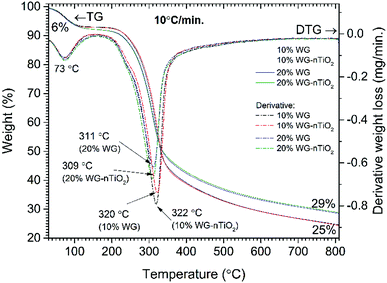
TG and DTG curves of Na2SiO3/-nTiO2 treated wood are presented in Fig. 4. The first weight loss of 6% was observed by heating the sample up to 105 °C (maxima at 73 °C, DTG curve) and was assigned to the removal of absorbed water. At a temperature of about 200 °C, the additional weight loss of 1–2% was obtained for the 20% Na2SiO3/-nTiO2 treated wood. This was ascribed to the hygroscopicity of Na2SiO3 and as a result, extra H2O molecules were bound to the Na2SiO3/-nTiO2–wood material. Results showed that nano-TiO2 presence had a very marginal effect and the changes in thermal behaviour were induced mostly by the Na–O–Si gel. The maximum weight loss for the 10% Na2SiO3 treated wood appears at 10 °C higher temperature compared to those samples treated with 20% Na2SiO3 solution (309/311 °C and 320/322 °C for the 10% Na2SiO3/-nTiO2 and 20% Na2SiO3/-nTiO2 respectively). Furthermore, the residual mass of the material after the burn-off was 14% higher for the samples treated with 20% Na2SiO3 solution compared to those treated with 10% Na2SiO3. TiO2 had a very insignificant effect on the mass change for the same compositions. The different thermal behaviour suggested chemical changes in wood material induced by the alkali-treatment, as it is known that alkali metals are strong catalysts for decomposition of lignocellulose.41 Also, the behaviour of organic components during thermal degradation is known to be dependent on the heating rate, and therefore different carbonation materials and yields might be produced during different stages of pyrolysis. There was also an apparent change in the colour of treated wood.
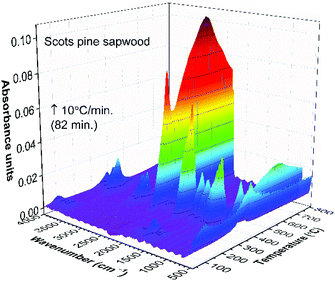 | ||
| Fig. 4 TG-FTIR absorbance spectra 3D stack plot of unmodified Scots pine sapwood pyrolysis components as a function of temperature. | ||
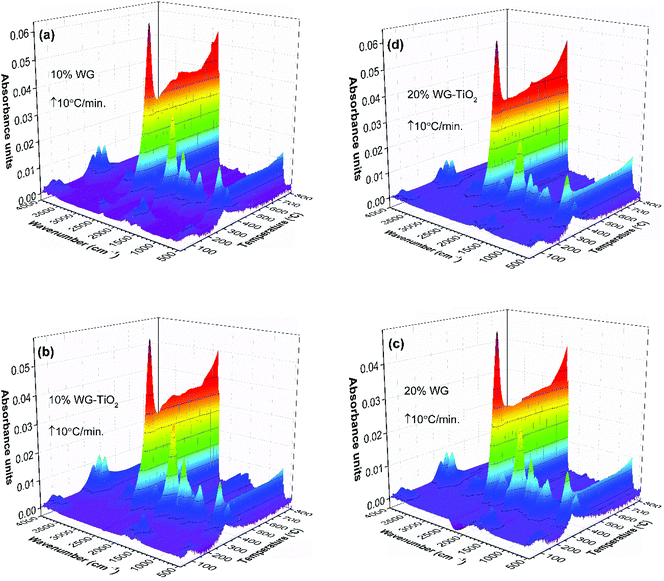
FTIR absorbance spectra 3D stack-plots of produced gases during the pyrolysis (Fig. 5) supported the occurring events in the TG and DTG curves. One can observe that the intensities of CO2 evolution varies for the 10% Na2SiO3/-nTiO2 samples compared to those that were treated with 20% Na2SiO3/-nTiO2. At higher temperature, the main gases evolved were CO2 and H2O, as organic matter undergoes combustion, accounting for the final weight-loss event.
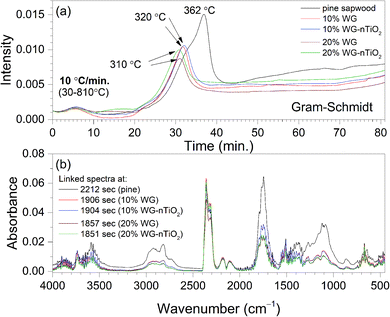
Fig. 6(a) shows Gram–Schmidt (GS) profiles derived from IR plots of untreated and Na2SiO3/-nTiO2-treated wood materials heated at 10 °C min−1 between 30 °C and 810 °C. The data were in good agreement with the TGA, showing that two major periods of weight loss observed in the derivative weight loss curves (Fig. 1 and 3), were associated with the absorption of evolved gases. The small signals in the GS plots around 5 minutes (80–90 °C) result from the CO2 and water molecules evolving from the materials. The larger peak rising after 30 min (about 310–320 °C) was associated with the multiple gas evolution. Fig. 6(b) shows linked IR spectra of gases evolved at the times when maxima absorption occur for each sample investigated. It is interesting to note that ratio of CO2 band and carboxylic (C![[double bond, length as m-dash]](https://www.rsc.org/images/entities/char_e001.gif) O) band is increasing with an increase Na2SiO3 concentration. Reduced intensities of C
O) band is increasing with an increase Na2SiO3 concentration. Reduced intensities of C![[double bond, length as m-dash]](https://www.rsc.org/images/entities/char_e001.gif) O band in the treated wood spectra indicated possible extraction of aliphatic components during the alkali treatment.
O band in the treated wood spectra indicated possible extraction of aliphatic components during the alkali treatment.
The GS curves clearly pointed to the differences in the material composition of the specimens. One can also observe that the maxima in the GS profiles of treated wood specimens was shifting to the lower temperatures with an increase of Na2SiO3 content. Furthermore, the slight differences in the maxima of the overall IR signal in time (temperature) could be seen when nano-TiO2 was introduced into the system (slightly higher absorbance was observed). This could also be seen in FTIR gas 3D plots (Fig. 5). This suggested some chemical reaction taking place between TiO2 and amorphous Na–O–Si gel upon heating. Wood pyrolysis is a complex process, while gas-phase spectra are very sensitive to the environmental conditions and, therefore, the factors such as composition, temperature and pressure could also affect resultant peak shapes and line intensities.
3.2. Distribution of inorganics in modified wood
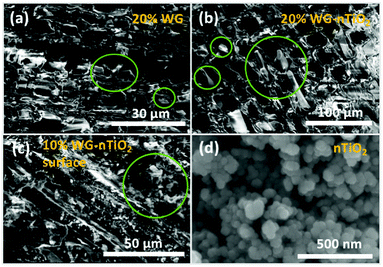
The representative cross-section FE-SEM images of the 20% Na2SiO3/-nTiO2 treated wood are show in Fig. 7(a) and (b). After the pressure-treatment, the cell lumens were filled with a solidified inorganic material. During post-treatment drying, water evaporates and subsequently shrinkage of the Na–O–Si gel occurs. As a result, the protrusion of solidified gel out of the wood cavities often exhibit smaller diameter than the cell lumen. Other materials exhibited similar morphological features. Fig. 7(c) depicts the surface of the 10% Na–O–Si–nTiO2 composite. It was evident that TiO2 nanoparticles (as received particles (Fig. 7(d)) are homogeneous with an average size of about 50 nm) were dispersed within the Na–O–Si gel and rather evenly distributed on the surface of wood specimen. The regions with agglomerated TiO2 nanoparticles (marked in circle in Fig. 7(c)) were also observed which indicated that during the vacuum-pressure treatment, nano-TiO2 accumulates within the surface cavities (additional FE-SEM images and EDS spectrum showing Ti are presented in ESI Fig. S2†). Overall, this led to the enhanced micro-smoothness of the wood surface. The attempt to improve wood surface resistance against UV radiation using TiO2 photocatalyst was demonstrated previously.18,42 Therefore, filling of the surface voids with nano-TiO2 might serve as a surface protection barrier against UV radiation. Other specimens exhibited very similar surface and cross-section morphological features. Moreover, as part of pre-studies, aqueous formulations of the TiO2, commercial HAP and nano-wollastonite without any additional additives were explored to treat different types of wood. However, these ceramic materials were not detected within the wood matrix and were very easily removed away from the surface of dried wood. This was attributed to the insufficient chemical bonding between the ceramic and wood materials, as well as the absence of imbedding/polymerizing material. The cohesion between ceramic material and wood was reported by Gao et al., where authors showed the fabrication of a film containing TiO2 coated CaCO3 particles followed by modification with stearic acid on a wooden substrate.43 Though the adhesion of these films was not reported, the authors showed an enhancement of the chemical stability and durability of the wood surface due to the fabricated coatings. Guo et al. reported Ti- and Ce-containing xerogel coatings on the wood substrate produced by a dip-coating method.18 To hydrolyze the titanium(IV) isopropoxide, the initial precursor solution was matured for about 2 weeks and thereafter the wood specimens were submerged into this solution for a period of 24 h. The studies reported that there were no changes in the natural appearance of the wood after 4 weeks of exposure to UV radiation. Additionally, the XRD patterns of initial Ti-containing xerogels showed no reflections of the crystalline phase of TiO2. A variety of physico-chemical methods for wood treatment were reported. The flexibility of solution-based treatments is related to the possibility of changing the treatment and solution parameters, such as reaction time, temperature, solution concentration, precursors and additives.To assess the micro-distribution of Na–O–Si gel and nano-TiO2, EDS analysis was used. The cross-section FE-SEM images depicted in Fig. 8 shows EDS-analysed regions of 10% and 20% Na–O–Si/-nTiO2–wood composites. The elements such as C, O, Na, Al (from the sample holder) and Si were detected (Fig. 8(e)). This further confirmed the incorporation of Na and Si ions into the wood and formation of Na–O–Si gel within the cell lumen. It was also observed that C/Si elemental ratio was higher in the cell wall compared to that estimated in the solid Na–O–Si gel material. Furthermore, Na was distributed evenly in the cell wall and in the cell lumen, whilst Si showed higher concentrations within wood lumens compared to the cell walls. The atomic% ratios of Na![[thin space (1/6-em)]](https://www.rsc.org/images/entities/char_2009.gif) :
:![[thin space (1/6-em)]](https://www.rsc.org/images/entities/char_2009.gif) Si measured of presented 10% Na–Si–O–wood composite (Fig. 8(e)) were 0.50
Si measured of presented 10% Na–Si–O–wood composite (Fig. 8(e)) were 0.50![[thin space (1/6-em)]](https://www.rsc.org/images/entities/char_2009.gif) :
:![[thin space (1/6-em)]](https://www.rsc.org/images/entities/char_2009.gif) 7.02 and 0.67
7.02 and 0.67![[thin space (1/6-em)]](https://www.rsc.org/images/entities/char_2009.gif) :
:![[thin space (1/6-em)]](https://www.rsc.org/images/entities/char_2009.gif) 0.11 for the targeted wood lumen (Spectrum 1) and wood cell wall (Spectrum 2), respectively, while the same elemental atomic% ratios estimated of 20% Na–Si–O–nTiO2–wood composite were 0.56
0.11 for the targeted wood lumen (Spectrum 1) and wood cell wall (Spectrum 2), respectively, while the same elemental atomic% ratios estimated of 20% Na–Si–O–nTiO2–wood composite were 0.56![[thin space (1/6-em)]](https://www.rsc.org/images/entities/char_2009.gif) :
:![[thin space (1/6-em)]](https://www.rsc.org/images/entities/char_2009.gif) 14.78 and 0.81
14.78 and 0.81![[thin space (1/6-em)]](https://www.rsc.org/images/entities/char_2009.gif) :
:![[thin space (1/6-em)]](https://www.rsc.org/images/entities/char_2009.gif) 3.09 for the wood lumen (Spectrum 1) and wood cell wall (Spectrum 2), respectively. The data showed that atomic concentrations were strongly influenced by the specific place of the specimens. Moreover, no Ti was detected in the cross-section of the specimens, indicating that TiO2 nanoparticles did not penetrate into the cell lumen under current experimental conditions.
3.09 for the wood lumen (Spectrum 1) and wood cell wall (Spectrum 2), respectively. The data showed that atomic concentrations were strongly influenced by the specific place of the specimens. Moreover, no Ti was detected in the cross-section of the specimens, indicating that TiO2 nanoparticles did not penetrate into the cell lumen under current experimental conditions.
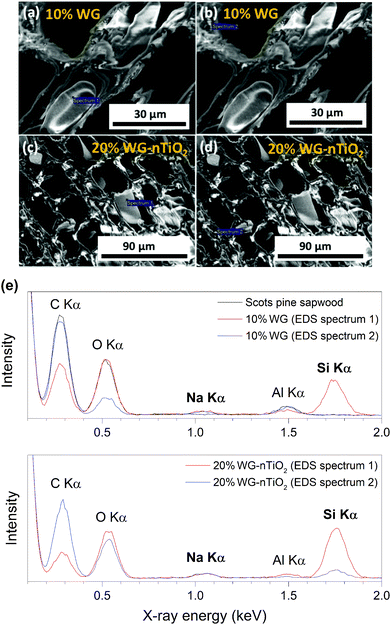 | ||
| Fig. 8 (a–d) Cross-section FE-SEM images depicting EDS-analysed regions, and (e) EDS spectra of 10% Na–O–Si and 20% Na–O–Si–nTiO2 treated Scots pine sapwood. | ||
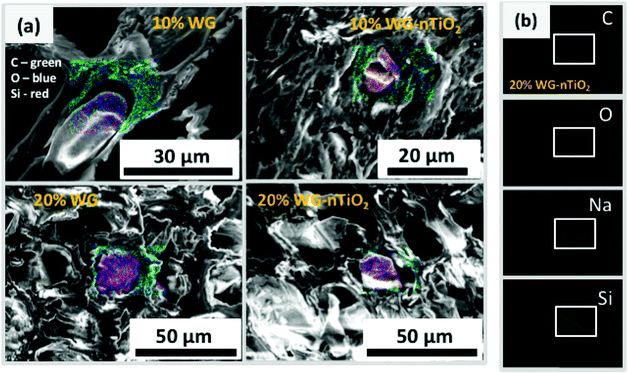
The distribution of elements within the wood matrix was further evaluated by performing the EDS elemental mapping. The cross-section FE-SEM images of Na–O–Si/-nTiO2 modified wood (Fig. 9(a)) show pseudo-colour maps of three elements where the red-green-blue (RGB) colour channels were assigned as follows: Si – red, C – green and O – blue. For each material, the elemental mapping further confirmed the diffusion of sodium silicate aqueous solution into the wood matrix. The FE-SEM elemental mapping images of the representative 20% Na–O–Si–nTiO2 wood composite (Fig. 9(b)) showed localization of individual C, O, Na and Si elements within the wood. The results confirmed our previous observations that Na atoms are evenly scattered within the whole wood matrix, while Si atoms tended to segregate within wood lumen, forming a solid Na–O–Si gel. Such behaviour might be ascribed to the different Na and Si concentration in the initial sodium-silicate solution. Furthermore, the different mobility of the ions strongly depended on its charge and size, and these were modulated by hydration shells and the solvent also needed to be taken into consideration.44,45 As previously described herein, no TiO2 was detected within the wood matrix during the elemental mapping analysis.
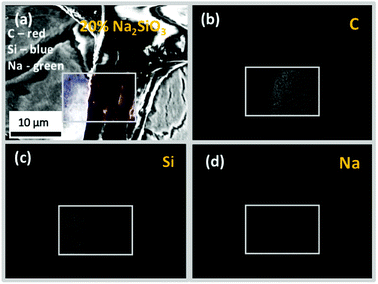
The cross-sectional view under a higher magnification and EDS-based elemental (C, Na and Si) mapping of the representative 20% Na–Si–O-modified wood composite (Fig. 10) further confirmed that Na and Si were distributed within entire wood matrix, i.e. within wood-cell lumen and cell wall. It has been previously shown that bound water within the cell walls and free water in the cell cavities, which was a result of different treatment of specimens, can make it possible to prepare wood composites with inorganic substances distributed differently.46
The microstructure of Na2SiO3/-nTiO2-modified and at 810 °C pyrolyzed wood composites was also examined. FE-SEM images (Fig. 11) showed that Na–O–Si gel was transformed into a glassy phase with differently-shaped crystalline particles formed on the surface of the carbon-rich inorganic residue. It is known that crystalline segregations in a glass matrix induce changes in material strength and hardness. The EDS analysis confirmed that the elements such as C, O, Na, Si and Ti were detected and the average concentrations of Na, Si and Ti were relatively higher for the 20% Na2SiO3 modified wood samples compared to those of the 10% Na2SiO3 modified samples. However, the atomic% ratios of Na![[thin space (1/6-em)]](https://www.rsc.org/images/entities/char_2009.gif) :
:![[thin space (1/6-em)]](https://www.rsc.org/images/entities/char_2009.gif) Si and Na
Si and Na![[thin space (1/6-em)]](https://www.rsc.org/images/entities/char_2009.gif) :
:![[thin space (1/6-em)]](https://www.rsc.org/images/entities/char_2009.gif) Si
Si![[thin space (1/6-em)]](https://www.rsc.org/images/entities/char_2009.gif) :
:![[thin space (1/6-em)]](https://www.rsc.org/images/entities/char_2009.gif) Ti varied and were again found to be place dependent (data not presented). This could be mainly attributed to the formation of complex carbon- and TiO2-rich Na–O–Si glassy materials of various crystalline phases. The temperature at which amorphous phase of inorganic glasses transformed into crystalline strongly depended on the bulk composition and it has been extensively studied before.47–49
Ti varied and were again found to be place dependent (data not presented). This could be mainly attributed to the formation of complex carbon- and TiO2-rich Na–O–Si glassy materials of various crystalline phases. The temperature at which amorphous phase of inorganic glasses transformed into crystalline strongly depended on the bulk composition and it has been extensively studied before.47–49
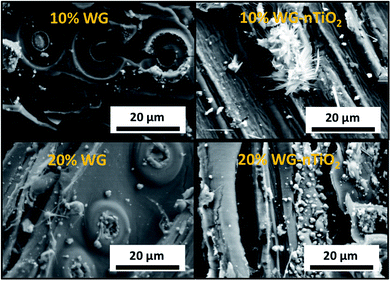 | ||
| Fig. 11 FE-SEM images (transverse wood sections) of the Na2SiO3/-nTiO2-modified and at 810 °C pyrolyzed Scots pine sapwood. | ||
3.3. Increase in mass due to the modification
WPG of the samples increased due to the treatment. Specimens that were treated from formulations containing 10% Na2SiO3 displayed weight gain of about 6.40% (an averages value of 6.23 and 6.56% was calculated for 10% Na2SiO3 and 10% Na2SiO3–nTiO2, respectively), whilst those treated from formulations containing 20% Na2SiO3 exhibited significantly higher values (13.84% and 11.68% were calculated for 20% Na2SiO3 and 20% Na2SiO3–nTiO2 modified wood samples, respectively). Apparently, there was no clear effect of TiO2 on the WPG values.EMC values of modified wood specimens were consistent and these were calculated to be 15.5 ± 0.1%.
3.4. Structure evaluation of modified wood
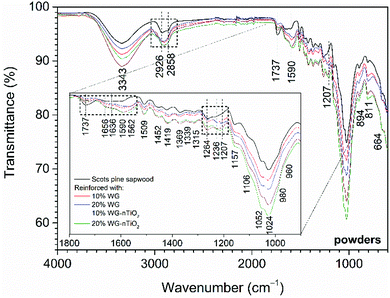
The chemical composition of the modified wood was determined by FTIR spectroscopy. FTIR spectra of the pure and Na–O–Si/-nTiO2-modified wood are presented in Fig. 12, and the assignment of the bands is summarised in Table 1. The spectra showed a broad absorption band in the 3600–3100 cm−1 region, which was assigned to the asymmetrical stretching vibration of O–H groups originating of the main chemical components (cellulose, hemicellulose and lignin).50 Comparison of FTIR spectra of modified and unmodified wood revealed different absorbencies in the three regions, i.e. of 2940–2840 cm−1, 1750–1540 cm−1 and 1300–1200 cm−1.| Wavenumber (cm−1) | Band assignment | References |
|---|---|---|
| a sh: shoulder; the band obtained at 1207 cm−1 (O–H bending (cellulose)) was shifter to 1202 cm−1 for Na–O–Si/-nTiO2 modified wood samples; the band at 1562 cm−1 (not identified) was absent in the spectra of unmodified wood specimens, but presented in the spectra of Na–O–Si/-nTiO2 modified wood samples. | ||
| Unmodified wood and Na–O–Si/-nTiO2 modified wood | ||
| 664 | C–OH out-of-plane bending vibrations (cellulose) | 50 |
| 811 | C–H out-of-plane bending vibrations (lignin) | 52 |
| 870sh | C–C | 58 |
| 894 | Aromatic C–H out-of-plane deformation (cellulose and hemicellulose) | 52 |
| 1024 | C–O deformation (cellulose), symmetric C–O–C stretching in dialkyl ethers, aromatic C–H deformation (lignin) | 51 and 52 |
| 1052 | C–O–C symmetric stretch (cellulose and hemicellulose) | 51, 52 and 58 |
| 1106sh | C–O–C stretch and O–H (cellulose and hemicellulose) | 51, 52 and 58 |
| 1157 | C–O–C asymmetric stretch vibrations (cellulose) | 51, 52 and 58 |
| 1207 | O–H bending (cellulose) | 51 and 52 |
| 1236 | Alkyl–aryl–ether bonds, lactones | 51 and 52 |
| 1264 | C–O stretch vibrations (lignin) | 58 |
| 1315 | –CH2 and O–H deformations (carbohydrates) | 58 |
| 1335 | –CH2 and O–H wagging vibrations (cellulose) | 52 |
| 1369 | C–H bending, –CH2, –CH3 (carbohydrates) | 52 and 58 |
| 1419 | C–H aromatic skeletal vibrations (lignin), –CH2 bending deformation (cellulose) | 50 and 52 |
| 1452 | C![[double bond, length as m-dash]](https://www.rsc.org/images/entities/char_e001.gif) C, C–H, O–H in plane deformation, –CH3 asymmetric bending (lignin) C, C–H, O–H in plane deformation, –CH3 asymmetric bending (lignin) |
50, 52 and 59 |
| 1462 | C![[double bond, length as m-dash]](https://www.rsc.org/images/entities/char_e001.gif) C, C–H, O–H in plane deformation, –CH3 asymmetric bending (lignin) C, C–H, O–H in plane deformation, –CH3 asymmetric bending (lignin) |
52 and 58 |
| 1509 | C![[double bond, length as m-dash]](https://www.rsc.org/images/entities/char_e001.gif) C aromatic skeletal vibrations (lignin) C aromatic skeletal vibrations (lignin) |
52 and 58 |
| 1590 | C–O–C stretch vibration and C![[double bond, length as m-dash]](https://www.rsc.org/images/entities/char_e001.gif) C aromatic skeletal C aromatic skeletal |
51 and 58 |
| 1605 | C![[double bond, length as m-dash]](https://www.rsc.org/images/entities/char_e001.gif) C aromatic skeletal vibrations C aromatic skeletal vibrations |
53 and 58 |
| 1636 | H–O–H deformation vibration of adsorbed H2O | 58 |
| 1656 | C![[double bond, length as m-dash]](https://www.rsc.org/images/entities/char_e001.gif) O stretching vibration (conjugated) O stretching vibration (conjugated) |
52 and 58 |
| 1737 | C![[double bond, length as m-dash]](https://www.rsc.org/images/entities/char_e001.gif) O stretching vibration (unconjugated) O stretching vibration (unconjugated) |
51 and 58 |
| 2858 | C–H symmetric stretching vibrations in methyl and methylene groups (aliphatic) | 50, 58 and 60 |
| 2926 | C–H stretching vibration in methyl and methylene groups (aliphatic) | 50, 58 and 60 |
| 3343 | O–H stretching vibrations (cellulose, hemicellulose and lignin) | 50 and 58 |
The bands located in the 2940–2840 cm−1 region (maxima at 2926 cm−1 and 2858 cm−1) originated from the C–H asymmetric stretching in methyl and methylene groups of aliphatic hydrocarbons.50 As for the modified wood, these bands become less pronounced and all spectra exhibited one broad absorption band with a maxima around 2900 cm−1. This could indicate the partial removal of the hemicelluloses.
In 1750–1540 cm−1 region several wood components give IR absorption bands. Bands at 1509 cm−1 and 1600 cm−1 were characteristic to the aromatic skeletal vibrations of lignin. Carbonyl (C![[double bond, length as m-dash]](https://www.rsc.org/images/entities/char_e001.gif) O) stretching of carboxylate ions occurred at 1590–1560 cm−1, however due to the protonation of carboxylate ions, these bands may shift to 1710–1620 cm−1 region, as glucuronic acid exhibits absorption at 1710 cm−1. It was observed that the overall intensity of these bands increased for the Na–O–Si/-nTiO2-modified wood. These changes in intensity were even more pronounced for the 20% Na–O–Si/-nTiO2-modified samples compared to those treated from solutions of lower concentrations. It was noted that a broad band with a maximum at 1562 cm−1, that was absent in the spectrum of unmodified wood, was obtained in all spectra of the treated wood (absorption not identified). Further, conjugated carbonyl structures (ketones) of lignin also absorbed radiation in 1690–1620 cm−1, while C
O) stretching of carboxylate ions occurred at 1590–1560 cm−1, however due to the protonation of carboxylate ions, these bands may shift to 1710–1620 cm−1 region, as glucuronic acid exhibits absorption at 1710 cm−1. It was observed that the overall intensity of these bands increased for the Na–O–Si/-nTiO2-modified wood. These changes in intensity were even more pronounced for the 20% Na–O–Si/-nTiO2-modified samples compared to those treated from solutions of lower concentrations. It was noted that a broad band with a maximum at 1562 cm−1, that was absent in the spectrum of unmodified wood, was obtained in all spectra of the treated wood (absorption not identified). Further, conjugated carbonyl structures (ketones) of lignin also absorbed radiation in 1690–1620 cm−1, while C![[double bond, length as m-dash]](https://www.rsc.org/images/entities/char_e001.gif) O stretching bands of unconjugated ketones and esters were present at 1740–1710 cm−1 (maximum at 1737 cm−1).51,52 The intensity of bands assigned to the latter components drastically decreased for the modified wood, while most other absorptions increased. Previous studies had shown that alkali treatment resulted in many changes in the polysaccharides (such as saponification of acetyl groups in acetylgalactoglucomannans) and various alkali solutions have been used for hemicellulose extractions. Therefore, the treatment with Na2SiO3 can induce the separation between wood constituencies (galactoglucomannans, xylans and the less soluble glucomannans). Consequently, the attachment of water molecules to the C
O stretching bands of unconjugated ketones and esters were present at 1740–1710 cm−1 (maximum at 1737 cm−1).51,52 The intensity of bands assigned to the latter components drastically decreased for the modified wood, while most other absorptions increased. Previous studies had shown that alkali treatment resulted in many changes in the polysaccharides (such as saponification of acetyl groups in acetylgalactoglucomannans) and various alkali solutions have been used for hemicellulose extractions. Therefore, the treatment with Na2SiO3 can induce the separation between wood constituencies (galactoglucomannans, xylans and the less soluble glucomannans). Consequently, the attachment of water molecules to the C![[double bond, length as m-dash]](https://www.rsc.org/images/entities/char_e001.gif) O groups of aromatic structures is induced and as a result, the intensity of absorption bands located at 1656 cm−1 and 1636 cm−1 increased for the Na–O–Si/-nTiO2-modified wood.
O groups of aromatic structures is induced and as a result, the intensity of absorption bands located at 1656 cm−1 and 1636 cm−1 increased for the Na–O–Si/-nTiO2-modified wood.
Lignin, in addition to the strong band located at 1509 cm−1, also gave characteristic bands at lower wavenumbers, i.e. at 1452 cm−1 and 1419 cm−1; these were assigned to the characteristic bands for aromatic phenyl C![[double bond, length as m-dash]](https://www.rsc.org/images/entities/char_e001.gif) C stretching (aromatic skeletal vibrations).51 There were no changes observed in the intensity of these bands.
C stretching (aromatic skeletal vibrations).51 There were no changes observed in the intensity of these bands.
The bands located at 1369, 1335 and 1315 cm−1 were assigned to the C–H bending, O–H in-plane bending and –CH2 wagging deformations of cellulose.53,54 These bands do not exhibit any changes for the modified wood compared to those of the untreated wood. It has been demonstrated that the ratio of the combined areas of these three peaks to that of the peak at 670 cm−1 may be used to determine relative cellulose crystallinity in wood.54 Results agree that the crystallinity of cellulose remained unchanged under current experimental conditions.
Significant changes in the band intensities were also observed in 1300–1200 cm−1 region. Three broad bands with maxima at 1264, 1236 and 1207 cm−1 were distinguished. The band located at 1264 cm−1 has been reported to originate from the ν(C–O) stretch vibrations in lignin, the band present at 1236 cm−1 from the alkyl–aryl–ether bonds and lactones, and the band at 1207 cm−1 from the O–H bending in cellulose.52,54 The intensity of band at 1264 cm−1 decreased after the modification, while an increase for those bands present at 1236 and 1207 cm−1 was observed. This indicated that the alkali treatment might partially remove the hemicelluloses and lignin and O–H groups become more accessible to water.
The fingerprint region was dominated by the bands approximately at 1050 cm−1 due to various polysaccharide vibrations (Table 1). Cellulose gave vibrations from 900 to 1100 cm−1 and there were no changes in the band intensities obtained after the modification.
The FTIR spectrum of the TiO2 nano-powders exhibited only few absorptions (ESI Fig. S1†); a broad band in 3600–3100 cm−1 region (maximum at 3481 cm−1) and at 1633 cm−1, and these were assigned to the free water that may absorb on the surface of the nano-TiO2.55 Subsequently, the recorded spectrum of amorphous Na–O–Si gel (ESI Fig. S3†) showed bands at 1651 cm−1 (O–H vibrations of water), 1450 cm−1 (unidentified), 960 cm−1 (Si–O(Si) vibrations), 873 cm−1 (Si–O(Na) vibrations) and 767 cm−1 ((H)O–Si–O(H) vibrations).56 The position of the Si–O–Si peaks in the spectrum depended on the Si/metal molar ratio of the silicate and therefore some shift, compared to similar glasses described in other studies, was observed.9,56,57
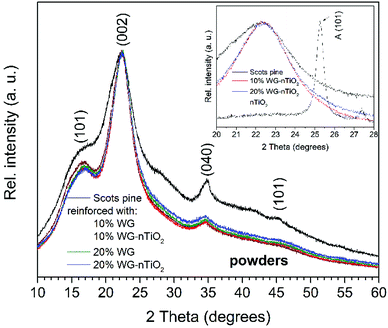
XRD patterns of untreated and Na2SiO3/-nTiO2 treated wood powders are presented in Fig. 13. The intensity and width of the peaks in a diffraction pattern indicate the dimensions of the ordered crystallites. XRD pattern of unmodified wood exhibit reflections at 2θ = 17°, 22°, 34°, 45° and 53°. The reflections at 17°, 24° and 34° were assigned to the (101), (002) and (040) diffraction peaks of crystalline cellulose.61–63 It is known that cellulose contains both highly ordered (crystalline) and less ordered (semi-crystalline or even amorphous) structures and that wood cellulose tends to be less crystalline than other sources of cellulose. A broad elevation in background ∼15–25° was assigned to the amorphous cellulose.64,65
The XRD patterns of Na–O–Si/-nTiO2 modified wood showed a slightly reduced intensity of reflections assigned to the crystalline cellulose. This can be attributed to the presence of amorphous Na–O–Si gel, which might conceal the reflections of crystalline cellulose. The XRD pattern of the Na–O–Si gel dried at 105 °C (ESI Fig. S4†) exhibited a single broad reflection at 2θ of about 24° that is characteristic to the amorphous glassy material, as Na–O–Si gels transforms into the crystalline glassy phase at higher temperatures.66 With increasing alkali concentration, the intensity of reflections assigned to the crystalline cellulose was further reduced. Although the amount of amorphous inorganic material increased, this event might be also associated to the changes in the cellulose crystal lattice and subsequent decreased crystallinity.63 The XRD patterns of modified wood show very small elevation at 2θ = 24.5° (Fig. 12 inset), which was the characteristic (101) reflection of TiO2 anatase phase (the XRD pattern of nano-TiO2 is presented in ESI Fig. S5†).
3.5. Effect of treatment on Brinell hardness
The Brinell hardness (HB) test was performed to evaluate the effect of Na–O–Si gel and nano-TiO2 on the material surface strength. Results showed that HB values (Fig. 14) for the modified and at room temperature for 48 h dried samples were slightly lower compared to the reference untreated wood (8.95 N mm−2, 8.12 N mm−2, 8.75 N mm−2, 7.23 N mm−2 and 8.64 N mm−2 were calculated for the untreated wood, 10% Na2SiO3, 10% Na2SiO3–nTiO2, 20% Na2SiO3 and 20% Na2SiO3–nTiO2 modified wood blocks, respectively). The small reduction in hardness of treated samples was associated with the higher water content due to the treatment from aqueous mixtures. However, there were significant differences obtained in the composites dried at room temperature for 3 months. Results showed that surface hardness measured of the reversed side of wood blocks increased for treated samples and the highest HB values were obtained for 10% Na2SiO3/-nTiO2 modified wood. The higher HB value for 10% Na2SiO3/-nTiO2 (12.33/13.13 N mm−2) compared to that of 20% Na2SiO3/-nTiO2 (10.18/10.13 N mm−2) could be related to the hygroscopicity of the Na–O–Si gel and subsequent higher moisture uptake by the material reinforced with higher amount of Na2SiO3. This indicates that additional drying is needed to achieve the higher surface hardness for these wood composites. Furthermore, results showed that formulations of Na2SiO3 in combination with nano-TiO2 could enhance the HB of wood material. It seems clear that the ceramic material of 10% Na2SiO3–nTiO2-modified wood is embedded within an amorphous Na–O–Si gel network and as a result, a thin layer on the surface of wood material was created. As for 10% Na2SiO3–nTiO2 wood samples an increase in HB of about 1 N mm−2 was obtained compared to the 10% Na2SiO3 treated wood and about 4 N mm−2 compared to the unmodified wood. The wood modified with 20% Na2SiO3–nTiO2 showed no improvement after prolonged drying compared to the 20% Na2SiO3-treated wood. This might be due to the fact that the TiO2 content in the initial formulations was less significant compared to the actual Na2SiO3 concentration. The variations in the HB values were demonstrated for the poly(ethylene glycol) modified Scots pine blocks and this was attributed to the combined effect of the oligomer sample, composition of the formulation and electron-beam curing that creates polymeric network within the wood material.67 Furthermore, due to the natural material heterogeneity the initial density of the sapwood might also slightly vary for the individual specimens that could affect the hardness of wood–inorganic composite.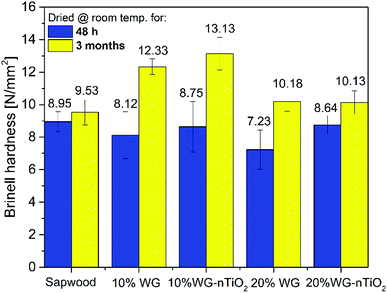 | ||
| Fig. 14 Brinell hardness of unmodified and 10% and 20% Na2SiO3/-nTiO2 reinforced wood tested 48 h and 3 months after treatment impregnation. | ||
3.6. Flame-retardancy measurements
To obtain a better understanding of composition–structure–properties relationship the flame-retardancy of Na–O–Si/-nTiO2 reinforced wood was evaluated measuring limiting oxygen index (LOI).3 LOI values presented in Table 2 show that the fraction of oxygen in a nitrogen–oxygen mixture needed to support combustion increased by 9–14% with an increase of sodium silicate concentration (ESI Fig. S6† shows camera image of specimens used for LOI test). This could be attributed to the suppressed decomposition of organic matter due to the phase transformation and crystallization of Na–O–Si gel. The phase transformation of amorphous glasses of various compositions to produce metastable structures on heat treatment has been widely reported.47,68–70 The synergy between sodium metasilicate and inorganic clay minerals for flame retardancy of wood was also demonstrated.71 An increase in LOI values showed that fixation of nano-TiO2 on the wood surface using aqueous sodium silicate solution has a potential in modeling low-cost and less fire hazardous materials. Also, when in combination with the surface hardness improvement, this ceramic–amorphous glass modified wood has the potential to achieve beneficial properties for industrial applications where the enhancement of mechanical strength or surface density is needed, i.e. windows, doors or floors. Shabir Mahr et al. reported a similar increase in LOI values for single and double layered sol–gel derived TiO2 and SiO2–wood composites.72 The values of LOI were increased up to 41% in comparison to 23% for untreated wood. Though values were comparable with those obtained of Na–O–Si/-nTiO2-modified wood studied in the current work, also it should be noted that the silicon and titania precursors used to treat wood were alkoxides as well as a different treatment procedure was employed. Thus, it is possible to demonstrate that ignition and flammability of specific materials will differ.Present results also showed that minor changes in the LOI values were obtained for the sapwood treated with Na2SiO3 in combination with TiO2. This resulted in 0.8% and 2.3% increase of LOI values for 10% and 20% Na2SiO3–nTiO2 treated samples, respectively, compared to those treated only with relevant Na2SiO3 formulations. The LOI values were in agreement with mass loses in the TG curves, indicating that the higher content of the inorganic substance required a higher supply of oxygen to induce ignition. Furthermore, results also implied that due to the treatment the interfacial contact between organic and inorganic phases was maintained and thus at high temperature (>1000 °C) the silicates and the mineral co-additive acted as an adhesive barrier layer that partially insulated wood from the heat source.
Although enhancement of the wood surface hardness and fire retardant properties using Na–O–Si/-nTiO2 system was demonstrated, the current study also indicated that after an ignition the propagation of combustion was sustained (ESI Video_1†) and therefore other co-additives for inorganic–wood composite system that can further improve hardness and thermal stability of the wood need to be investigated. The approach of removing alkali from the aqueous sodium silicate solution through ion exchange technique, which would induce polycondensation reaction and formation of silicon dioxide, also should be considered.
In the future, there is an interest to investigate in greater detail how the bonding between ceramic and bio-based materials can be enhanced by pursuing a multiple approach based on environmentally friendly nontoxic materials, abundant elements and commercially used wood-treatment technologies. Clearly, the knowledge about the ceramic intercalation into the wood and the relationship between bio-based composite structure and improvement of strength as well as flammability properties of the treated wood are still not fully developed.
4. Conclusions
Na–O–Si/-nTiO2 reinforced Scots pine sapwood composites were successfully prepared by vacuum-pressure treatment. TG data showed that maximum weight loss during the pyrolysis for the composites appears at 40–50 °C lower temperature compared to the untreated wood and this indicated that modified material thermally degraded at lower temperatures. The Gram–Schmidt curves and IR spectra extracted at maxima absorption from Gram–Schmidt plots were in agreement with TG data and showed that decomposition of wood–inorganic composites began at about 300 °C, which was a lower temperature compared to that of unmodified wood. SEM/EDS analysis revealed a homogeneous distribution of the sodium and silicon within the entire wood matrix, i.e. cell lumen and cell wall. A homogeneous coating of TiO2 on the surface of specimens could be observed, but no TiO2 was detected in the cell lumen. FTIR spectra revealed chemical changes in the treated wood, showing the different absorbencies in the regions characteristic to the skeletal vibrations of lignin and cellulose. XRD analysis revealed that the intensity of reflections assigned to the crystalline cellulose diminished under the presence of the amorphous Na–O–Si gel. A good correlation between material thermal behaviour, Brinell hardness test and flame-retardancy properties was found. Brinell hardness test demonstrated significant influence of the Na2SiO3/-nTiO2 on the material strength. Flammability test of the modified samples showed 9–14% increase in LOI values observed for the modified wood in comparison to the untreated material, confirming the fixation of nano-TiO2 on the wood surface by sodium silicate; the formed layer acted as a physical barrier restricting the interaction of oxygen with the wood substrate. Results demonstrated that wood modification using Na–O–Si/-nTiO2 system has a potential for enhancing wood surface hardness and flame retardant properties, allowing for the exploration of a broader range of wood material properties in a concept of sustainable material management.Conflicts of interest
There is no conflicts to declare.Acknowledgements
The work has been partially supported by the Swedish Research Council FORMAS Project “Utilization of solid inorganic waste from the aquaculture industry as wood reinforcement material for flame retardancy” (grant no. 2018-01198) and IPOS (No. DP2 BFAST AP4 Brand).References
- M. H. Ramage, H. Burridge, M. Busse-Wicher, G. Fereday, T. Reynolds, D. U. Shah, G. Wu, L. Yu, P. Fleming, D. Densley-Tingley, J. Allwood, P. Dupree, P. F. Linden and O. Scherman, Renewable Sustainable Energy Rev., 2017, 68, 333–359 CrossRef.
- P. Evans, Weathering and photoprotection of wood in Development of Commercial Wood Preservatives, ACS Symposium Series, American Chemical Society, 2008, vol. 982, ch. 5, pp. 69–117 Search PubMed.
- E. D. Weil, J. Fire Sci., 2011, 29, 259–296 CrossRef CAS.
- J. Alongi, Z. Han and S. Bourbigot, Prog. Polym. Sci., 2015, 51, 28–73 CrossRef CAS.
- M. Nikolaeva and T. Kärki, Balt. For., 2011, 17, 314–326 Search PubMed.
- L. Wang, X. He and C. A. Wilkie, Materials, 2010, 3, 4580–4606 CrossRef CAS PubMed.
- S. Donath, H. Militz and C. Mai, Wood Sci. Technol., 2004, 38, 555–566 CrossRef CAS.
- X. Han, R. Li, Q. Zhang and J. Pu, Wood Fiber Sci., 2017, 49, 43–51 CAS.
- A. Pfeffer, C. Mai and H. Militz, Eur. J. Wood Wood Prod., 2012, 70, 165–176 CrossRef CAS.
- M. Humar, P. Kalan, M. Šentjurc and F. Pohleven, Wood Sci. Technol., 2005, 39, 685 CrossRef CAS.
- B. Sundqvist, O. Karlsson and U. Westermark, Wood Sci. Technol., 2006, 40, 549–561 CrossRef CAS.
- P. Gérardin, Ann. For. Sci., 2016, 73, 559–570 CrossRef.
- Q. Fu, L. Medina, Y. Li, F. Carosio, A. Hajian and L. A. Berglund, ACS Appl. Mater. Interfaces, 2017, 9, 36154–36163 CrossRef CAS PubMed.
- T. Akaki, H. Maehara and M. Tooyama, J. Wood Sci., 2012, 58, 532–537 CrossRef CAS.
- H. R. Taghiyari, G. Rassam and K. Ahmadi-DavazdahEmam, J. For. Res., 2017, 28, 403–410 CrossRef CAS.
- P. D. Evans, H. Matsunaga, H. Averdunk, M. Turner, A. Limaye, Y. Kataoka, M. Kiguchi and T. J. Senden, Microdistribution of copper in Southern pine treated with particulate wood preservatives in Deterioration and Protection of Sustainable Biomaterials, ACS Symposium Series, American Chemical Society, 2014, vol. 1158, ch. 13, pp. 227–238 Search PubMed.
- H. Li, Z. Hu, S. Zhang, X. Gu, H. Wang, P. Jiang and Q. Zhao, Prog. Org. Coat., 2015, 78, 318–324 CrossRef CAS.
- H. Guo, D. Klose, Y. Hou, G. Jeschke and I. Burgert, ACS Appl. Mater. Interfaces, 2017, 9, 39040–39047 CrossRef CAS PubMed.
- V. Blanchard and P. Blanchet, BioResources, 2011, 6, 1219–1229 CAS.
- L. Gao, Z. Qiu, W. Gan, X. Zhan, J. Li and T. Qiang, Sci. Rep., 2016, 6, 26055 CrossRef CAS PubMed.
- B. Wang, M. Feng and H. Zhan, RSC Adv., 2014, 4, 56355–56360 RSC.
- X. Wang, J. Liu and Y. Chai, BioResources, 2012, 7, 893–901 CAS.
- P. Zanatta, M. L. Peres, E. Gallio, D. A. Gatto and M. L. Moreira, Materia-Rio de Janeiro, 2018, 23, e-12147 Search PubMed.
- A. Chanpirak, A. Samphakdee, S. Wangna and W. Weerachipichasgul, J. Eng. Sci. Technol., 2018, 13, 2405–2420 Search PubMed.
- T. Hubert and M. Shabir Marh, Sol-gel wood preservation, in Handbook of Sol-Gel Science and Technology, ed. L. Klein, et al., Springer, 2016, pp. 1–52 Search PubMed.
- C. Hill, Modifying the properties of wood in Wood modification: chemical, thermal and other processes, Willey series in renewable resources, John Wiley & Sons, Ltd., 2006, ch. 2, pp. 19–44 Search PubMed.
- B. Neyses, L. Rautkari, A. Yamamoto and D. Sandberg, IForest, 2017, 10, 857–864 CrossRef.
- R. M. Rowell and S. L. LeVan-Green, Thermal properties in Handbook of wood chemistry and wood composites, Taylor & Francis Group, CRS Press, 2005, ch. 6 Search PubMed.
- N. Gao, A. Li, C. Quan, L. Du and Y. Duan, J. Anal. Appl. Pyrolysis, 2013, 100, 26–32 CrossRef CAS.
- R. H. White and M. A. Dietenberger, Encyclopedia of Materials, Science and Technology, 2001, pp. 9712–9716 Search PubMed.
- A. J. Stamm, Ind. Eng. Chem., 1956, 48, 413–417 CrossRef CAS.
- R. Alén, E. Kuoppala and P. Oesch, J. Anal. Appl. Pyrolysis, 1996, 36, 137–148 CrossRef.
- H. Zhou, Y. Long, A. Meng, Q. Li and Y. Zhang, Thermochim. Acta, 2013, 566, 36–43 CrossRef CAS.
- L. George, E. Sanchez-García and W. Sander, J. Phys. Chem. A, 2003, 107, 6850–6858 CrossRef CAS.
- J. Lundell, M. Räsänen and Z. Latajka, Chem. Phys., 1994, 189, 245–260 CrossRef CAS.
- H. Zhou, A. Meng, Y. Long, Q. Li and Y. Zhang, J. Anal. Appl. Pyrolysis, 2014, 108, 19–25 CrossRef CAS.
- M. Halupka and W. Sander, Spectrochim. Acta, Part A, 1998, 54, 495–500 CrossRef.
- M. Pettersson, J. Lundell, L. Khriachtchev and M. Räsänen, J. Am. Chem. Soc., 1997, 119, 11715–11716 CrossRef CAS.
- Q. Liu, S. Wang, Y. Zheng, Z. Luo and K. Cen, J. Anal. Appl. Pyrolysis, 2008, 82, 170–177 CrossRef CAS.
- J. Coates, Interpretation of infrared spectra, a practical approach, in Encyclopedia of Analytical Chemistry, ed. R. A. Meyers, John Wiley & Sons Ltd, 2006, pp. 1–23 Search PubMed.
- K. E. Sundberg, B. R. Holmbom and A. V. Pranovich, J. Wood Chem. Technol., 2003, 23, 89–112 CrossRef.
- A. Hazarika and T. K. Maji, Ind. Eng. Chem. Res., 2013, 52, 13536–13546 CrossRef CAS.
- Z. Gao, M. Ma, X. Zhai, M. Zhang, D. Zang and C. Wang, RSC Adv., 2015, 5, 63978–63984 RSC.
- S. Koneshan, J. C. Rasaiah, R. M. Lynden-Bell and S. H. Lee, J. Phys. Chem. B, 1998, 102, 4193–4204 CrossRef CAS.
- M. A. Carignano, G. Karlström and P. Linse, J. Phys. Chem. B, 1997, 101, 1142–1147 CrossRef CAS.
- S. Saka, Wood inorganic composites as prepared by the sol-gel process, in Wood and Cellulose chemistry, ed. D. N.-S. Hon and N. Schiraishi, Marcel Dekker Inc., New York, 2nd edn, 2000, ch. 20, pp. 781–794 Search PubMed.
- R. Golubevas, A. Zarkov, L. Alinauskas, Z. Stankeviciute, G. Balciunas, E. Garskaite and A. Kareiva, RSC Adv., 2017, 7, 33558–33567 RSC.
- A. R. Allu, A. Gaddam, S. Ganisetti, S. Balaji, R. Siegel, G. C. Mather, M. Fabian, M. J. Pascual, N. Ditaranto, W. Milius, J. Senker, D. A. Agarkov, V. V. Kharton and J. M. F. Ferreira, J. Phys. Chem. B, 2018, 122, 4737–4747 CrossRef CAS PubMed.
- M. Naji, F. Piazza, G. Guimbretière, A. Canizarès and Y. Vaills, J. Phys. Chem. B, 2013, 117, 5757–5764 CrossRef CAS PubMed.
- M. Schwanninger, J. C. Rodrigues, H. Pereira and B. Hinterstoisser, Vib. Spectrosc., 2004, 36, 23–40 CrossRef CAS.
- C. Namyslo Jan, E. Kaufmann Dieter, C. Mai and H. Militz, Holzforschung, 2015, 69, 595 Search PubMed.
- Ö. Özgenç, S. Durmaz, I. H. Boyaci and H. Eksi-Kocak, Spectrochim. Acta, Part A, 2017, 171, 395–400 CrossRef PubMed.
- J. Baeza and J. Freer, Chemical characterization of wood and its components, in Wood and Cellulose chemistry, ed. D. N.-S. Hon and N. Shiraishi, Marcel Dekker Inc., New York, 2nd edn, 2000, pp. 275–384 Search PubMed.
- R. Evans, R. H. Newman, U. C. Roick, I. D. Suckling and A. F. A. Wallis, Holzforschung, 1995, 49, 498–504 CrossRef CAS.
- P. Wang, M. Du, M. Zhang, H. Zhu and S. Bao, Dalton Trans., 2014, 43, 1846–1853 RSC.
- I. Halasz, M. Agarwal, R. Li and N. Miller, Catal. Lett., 2007, 117, 34–42 CrossRef CAS.
- L. Vidal, E. Joussein, M. Colas, J. Cornette, J. Sanz, I. Sobrados, J. L. Gelet, J. Absi and S. Rossignol, Colloids Surf., A, 2016, 503, 101–109 CrossRef CAS.
- V. Emmanuel, B. Odile and R. Céline, Spectrochim. Acta, Part A, 2015, 136, 1255–1259 CrossRef CAS PubMed.
- P. Das, R. B. Stoffel, M. C. Area and A. J. Ragauskas, Biomass Bioenergy, 2019, 120, 350–358 CrossRef CAS.
- D. Fengel and G. Wegener, Wood: chemistry, ultrastructure, reactions, ch 4 Cellulose: ch 4.2. Molecular properties, Walter de Gruyter & Co., Berlin, 1984, pp. 67–83 Search PubMed.
- D. Chu, J. Mu, L. Zhang and Y. Li, Holzforschung, 2017, 71, 217 CAS.
- S. Park, J. O. Baker, M. E. Himmel, P. A. Parilla and D. K. Johnson, Biotechnol. Biofuels, 2010, 3, 10 CrossRef PubMed.
- D. Fengel, H. Jakob and C. Strobel, Holzforschung, 1995, 49, 505 CrossRef CAS.
- X. Ju, M. Bowden, E. E. Brown and X. Zhang, Carbohydr. Polym., 2015, 123, 476–481 CrossRef CAS PubMed.
- L. P. Novo, J. Bras, A. García, N. Belgacem and A. A. S. Curvelo, ACS Sustainable Chem. Eng., 2015, 3, 2839–2846 CrossRef CAS.
- H. Roggendorf, D. Böschel and J. Trempler, J. Non-Cryst. Solids, 2001, 293–295, 752–757 CrossRef CAS.
- S. M. Trey, J. Netrval, L. Berglund and M. Johansson, ACS Appl. Mater. Interfaces, 2010, 2, 3352–3362 CrossRef CAS PubMed.
- K. W. Terry and T. D. Tilley, Chem. Mater., 1991, 3, 1001–1003 CrossRef CAS.
- M. M. Sebdani, J. C. Mauro and M. M. Smedskjaer, J. Non-Cryst. Solids, 2015, 413, 20–23 CrossRef CAS.
- P. C. Schultz, J. Am. Ceram. Soc., 1976, 59, 214–219 CrossRef CAS.
- S. P. Kumar, S. Takamori, H. Araki and S. Kuroda, RSC Adv., 2015, 5, 34109–34116 RSC.
- M. Shabir Mahr, T. Hübert, B. Schartel, H. Bahr, M. Sabel and H. Militz, J. Sol-Gel Sci. Technol., 2012, 64, 452–464 CrossRef CAS.
Footnote |
| † Electronic supplementary information (ESI) available: FT-IR spectrum of TiO2 nanopowders; FTIR spectrum of Na–O–Si gel dried for 24 h at 103 °C; XRD of dried WG powders at 103 °C for 24 h; XRD pattern of TiO2 nanopowders; camera image shows untreated and pressure treated specimens of Scots pine sapwood; flammability test of wood reinforced with aqueous 20% sodium silicate solution. See DOI: 10.1039/c9ra05200c |
| This journal is © The Royal Society of Chemistry 2019 |

