DOI:
10.1039/C9RA05088D
(Paper)
RSC Adv., 2019,
9, 28399-28408
Cold model investigation of mixing-separation time distribution in a multi-element process coupled cyclone reactor for ionic liquid-catalyzed isobutane/butene alkylation
Received
5th July 2019
, Accepted 20th August 2019
First published on 16th September 2019
Abstract
The residence time distributions of a dispersed phase in a multi-element process coupled cyclone reactor for ionic liquid-catalyzed isobutane/butene alkylation were numerically studied with a CFD method. The Eulerian–Eulerian multiphase flow model and Reynolds stress model were applied to simulate the flow field distribution in the cyclone reactor. The time in which the dispersed phase flows from the inlet slot to the overflow outlet tube is defined as the mean mixing-separation time between two phases in the cyclone reactor. The effects of the structural parameter of the slot on the mean mixing-separation time were investigated in this work. The results show that the residence time distributions are unimodal except for the condition that the number of slots is 1. Besides, it is concluded that the velocity of dispersed phase flow into the reaction chamber and the relative velocity between two phases in the cyclone reactor are the main influence factors. Based on the results, a prediction model to explain the relationship between the mean mixing-separation time and the velocity of two phases was established.
1. Introduction
Energy-saving and emission-reduction have been a research focus due to the increased consciousness of the importance of environment protection. Therefore, improving the quality of oil, reducing the harmful substances in automobile exhaust emissions and promoting the development of low sulfur, low olefins, low aromatics, and low benzene content, as well as low vapor pressure of gasoline, are becoming development trends of global fuel cleaning. In the petroleum industry, isobutane/butene alkylation is widely used to produce high-quality gasoline.1,2 The alkylate produced in the alkylation process is characterized by a high octane number, low vapor pressure, and low contents of sulfur, olefins, and aromatics.3
Concentrated sulfuric acid alkylation and hydrofluoric acid alkylation processes are the widely used traditional alkylation processes at present. However, these two processes are corrosive to equipment and cause environmental pollution. Ionic liquid is a novel chemical material, which is mainly composed of organic cations, inorganic or organic anions.4–7 As the catalyst for alkylation, ionic liquids show a high reactivity and broad prospect for development. The articles by Yoo et al. show that ionic liquids are a promising substitute for H2SO4 and HF as the alkylation catalyst because of their safer operation, low consumption, and strong catalytic performance.8
Ionic liquid catalyzed isobutane/butene alkylation is a heterogeneous system wherein reactions occur in or near the interface between the ionic liquid and hydrocarbon phases. The intrinsic reaction rate is extremely fast due to the highly reactive carbonium intermediate.9 Therefore, the residence time of the ionic liquid–hydrocarbon mixture is of fundamental importance to the alkylate quality. Thus, it is necessary to study and develop a matched reactor for ionic liquid-catalyzed isobutane/butene alkylation. A pioneering investigation of the novel reactor for the ionic liquid-catalyzed isobutane/butene alkylation was performed by Zhou et al.10 They proposed a loop reactor for the alkylation process. However, the ideal time to separate alkylate from the ionic liquid is unclear, which limits its industrial application.
Based on hereinbefore problems, we proposed a multi-element process coupled cyclone reactor for ionic liquid-catalyzed isobutane/butene alkylation. Cyclone reactor is developed from the cyclone and hydrocyclone, which can be used in the multi-phase reaction system with the aid of other equipment. Recently, many experts and scholars applied the cyclone and hydrocyclone as a reactor to the heterogeneous reaction system, such as wastewater treatment,11 pyrolysis processes,12 hydrogen production,13 dry scrubbing of HCl,14 fermentation processes,15 petroleum industry16 etc. The works show that the cyclone reactor is a perspective subject.
Residence time refers to the time of the material flowing through an equipment. The work of Danckwerts was the first to introduce the concept of residence time distribution (RTD),17 presenting the flow and mixing of fluids in non-ideal tubes, mixers and reactors. The works on RTD in the hydrodynamic study of equipment were by the method of experiments and simulations.18,19 Gamba et al. simulated the RTD in a stirred tank by CFD software and validated the results of tracer method by experimental data and literature information. Adeosun and Lawal investigated the mixing characteristics in a T-junction microchannel using residence time distribution. They used the RTD and coefficient of variation to quantify the mixing behavior. Besides, RTD in a reactor is also an important parameter required for the design of reactor.
In our previous works, a cold-model system was established. The pioneering investigations of the mixing and separation characters in the cyclone reactor were conducted. In these works, the concentration distributions of dispersed phase were investigated.21 And a parameter, named dispersion uniformity was used to evaluate the dispersion performance of dispersed phase in the cyclone reactor. The recoveries of two phases were used to evaluate the separation performance of the cyclone reactor.22 Moreover, a numerical simulation method for flow field distribution of the cyclone reactor was established.22,23 Besides, the droplet size distributions of dispersed phase were obtained by the focused beam reflectance measurement (FBRM D600L) and population balance model (PBM).
The aim of the present paper is to study the mean mixing-separation time between two phases in the cyclone reactor. In the cyclone reactor, the residence time distribution of dispersed phase is different from the mean mixing-separation time. The flow time of dispersed phase in the inlet cushion chamber and overflow outlet should be deducted from the residence time distribution to calculate the mean mixing-separation time. Based on this, the effects of the structure of dispersed phase inlet on the mean mixing-separation time were investigated. Moreover, an empirical equation for predicting the mean mixing-separation time in the cyclone reactor was established.
The paper is structured as follows. In Section 2, the structure and working principle of the multi-element process coupled cyclone reactor are introduced. In Section 3, the numerical method along with the governing equations and a brief description of the solver is discussed. The effects of the structural parameters on the mean mixing-separation time between two phases in the cyclone reactor are studied in Section 4. In Section 5, a simple empirical model to calculate the mean mixing-separation time under different conditions is suggested.
2. Experiments
2.1. The cyclone reactor
The basic structure of the mentioned cyclone reactor is shown in Fig. 1. The cyclone reactor is designed on the base of the axial–axial-flow hydrocyclone developed by Wang et al.24 The C4 hydrocarbon mixture (dispersed phase) is injected through the symmetric tangential slots (inlet 2, 3), while the ionic liquid (continuous phase) flows axially from inlet 1 into the cyclone reactor. A guided vane lies below the continuous phase inlet. After entering the cyclone reactor, a layer of ionic liquid forms near the wall surface in the reaction chamber of cyclone reactor under the function of guided vane. Meanwhile, the C4 hydrocarbon mixture moves to the axis with the effect of centrifugal force after entering the LLCR through the tangential slots.25 During the moving process, the dispersed phase oscillates to liquid film, liquid film draws to form droplets and the droplets breakup under the action of shear force, which is the mixing process between two phases. Afterwards, the liquid mixture flows into the separation chamber. Under the influence of the structure of cyclone reactor and the density difference between reaction products and ionic liquids, the reaction products and ionic liquids discharges from the overflow outlet and underflow outlet, respectively. Namely, the cyclone reactor couples the mixing, reaction and separation element process. The integration of multi-element processes in a single equipment can effectively reduce the occurrence of side reactions, improve the yield of target products and simplify the process flow.
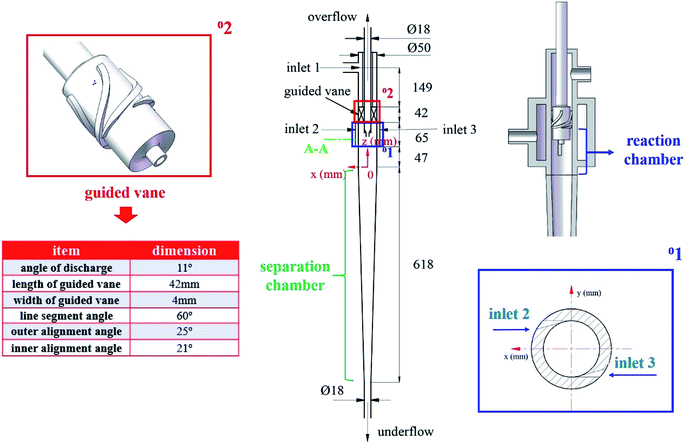 |
| | Fig. 1 Schematic diagram of the cyclone reactor structure. | |
2.2. The cold-model investigation system
As mentioned above, the mixing, reaction and separation element processes occur in two phases throughout in the cyclone reactor. Therefore, the concentration distributions and droplet size distributions of dispersed phase obtained by the cold-model investigation system can be used to evaluate the mixing performance between two phases. Besides, the recoveries of two phases at outlets can be used to evaluate the separation efficiency of the cyclone reactor. Hence, with the consideration of cost, preliminary studies were conducted on the cold-model investigation system.
In the cold-model investigation system, kerosene and 74 wt% glycerin water solution were used as the cold-model test liquids, which were chosen for hydrocarbon–ionic liquid system owing to their density and viscosity are close to hydrocarbon–ionic liquid as shown in Table 1.
Table 1 Physical parameters of the two phases
| Fluids |
Phase |
Density/kg m−3 |
Viscosity/Pa s |
Surface tension/N m−1 |
| 74 wt% glycerin solution |
Continous |
1164 |
0.03304 |
0.0223 |
| Kerosene |
Dispersed |
754 |
0.0016 |
| Ionic liquid |
Continous |
1312 |
0.0314 |
0.0128 |
| C4 hydrocarbon mixture |
Dispersed |
600 |
0.002 |
2.3. The definition of structural parameters
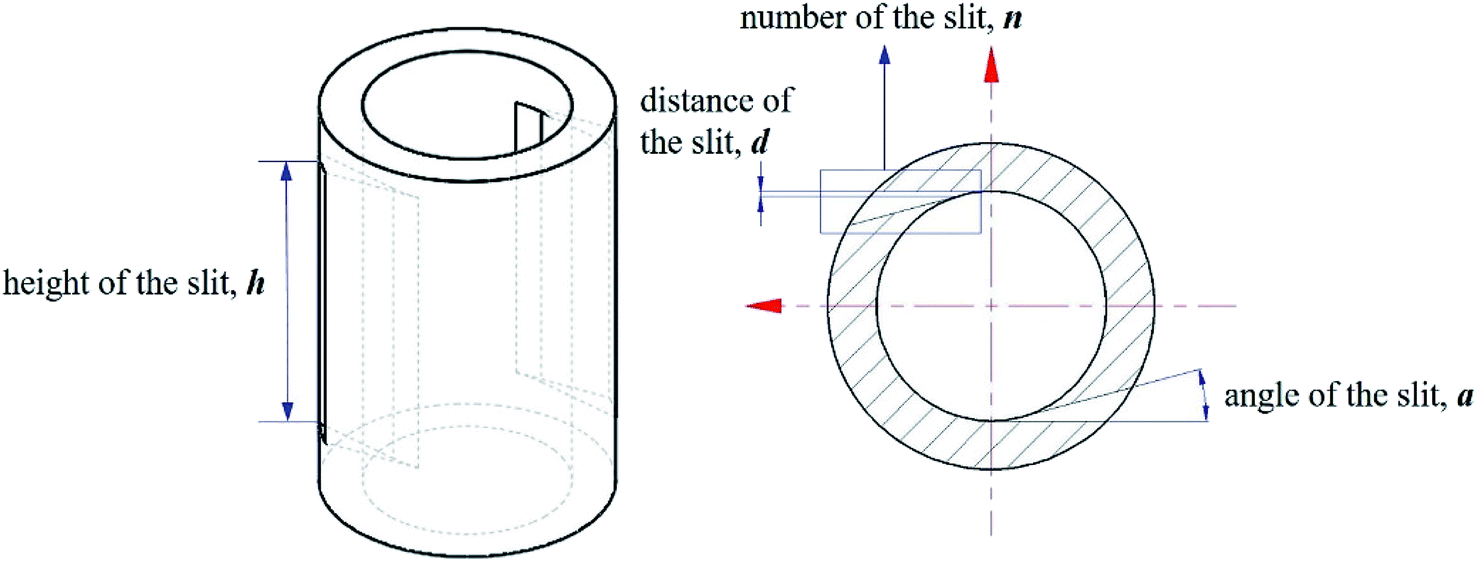
In this paper, four structural factors, i.e., height of the slit (h), distance of the slit (d), number of the slit (n) and angle of the slit (a) were studied, which can be seen in Fig. 2. The height of the slit was varied at 45, 50, 55, 60, 65, 70 mm. The distance of the slit was varied at 0.5, 1.0, 1.5, 2.0, 2.5, 3.0 mm. The number of the slit was varied to seven levels, i.e., 1, 2, 3, 4, 5, 6, 8. And the angle of the slit was adjusted to seven levels, which were 5°, 7°, 9°, 11°, 13°, 15°, 17°. Moreover, the effect of the total inlet flow on the mean mixing-separation time was used to verify the accuracy of the empirical model to calculate the mean mixing-separation time.
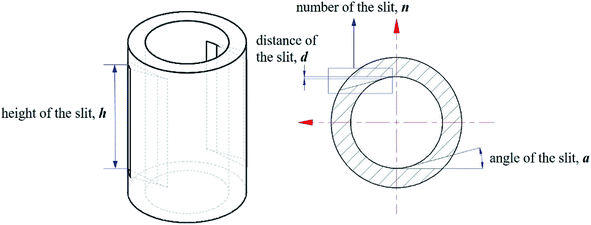 |
| | Fig. 2 The structural parameters under investigation. | |
3. Governing equations and flow solver
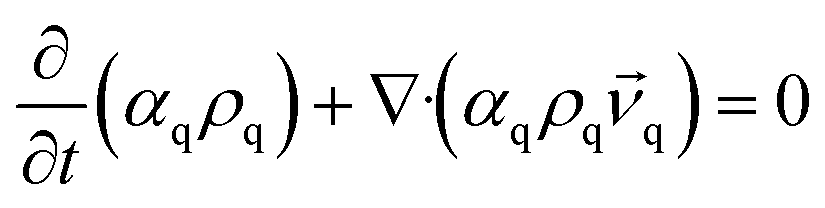
Numerical simulations are performed on a two-phase liquid–liquid system using the Eulerian multiphase model and Reynolds stress model (RSM), which are realized in the software Ansys15.0, and the liquids used are considered as incompressible fluids. The governing equations describing the flow are the conservation equations for mass and momentum. The description of multiphase flow as interpenetrating continua incorporates the concept of phasic volume fractions, denoted here by αq. Volume fractions represent the space occupied by each phase, and the laws of conservation of mass and momentum are satisfied by each phase individually. The derivation of the conservation equations can be done by ensemble averaging the local instantaneous balance for each of the phases or by using the mixture theory approach.26,27 The continuity equation for phase q is,| |
 | (1) |
where ![[v with combining right harpoon above (vector)]](https://www.rsc.org/images/entities/i_char_0076_20d1.gif) q, ρq is the velocity and density of phase q.
q, ρq is the velocity and density of phase q.
The momentum balance for phase q yields
| |
 | (2) |
Here
p is the velocity of phase p,
Kpq is interphase exchange coefficients,
![[F with combining right harpoon above (vector)]](https://www.rsc.org/images/entities/i_char_0046_20d1.gif) lift,q
lift,q is a lift force, the lift force acting on a secondary phase p in a primary phase q is computed from
| | |
lift,q = −Clρqαp(q − p) × (∇ × q)
| (3) |
where
Cl is the lift coefficient, the Tomiyama model was used to calculate the lift coefficient in this paper.
28
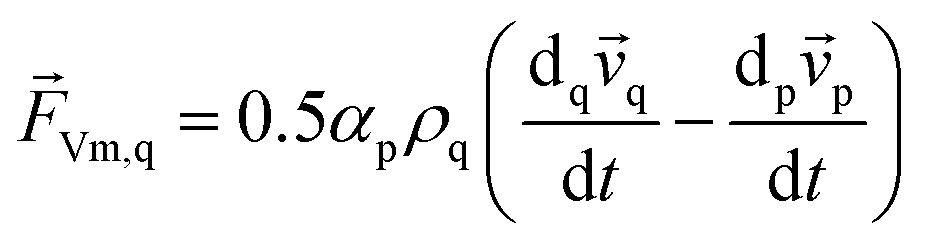
Vm,q in eqn (2) is a virtual mass force. For multiphase flows, virtual mass effect is considered when the relative velocity exists between the secondary phase p and the primary phase q, which can be expressed as:29
| |
 | (4) |
The term

denotes the phase material time derivative of the form
| |
 | (5) |

in
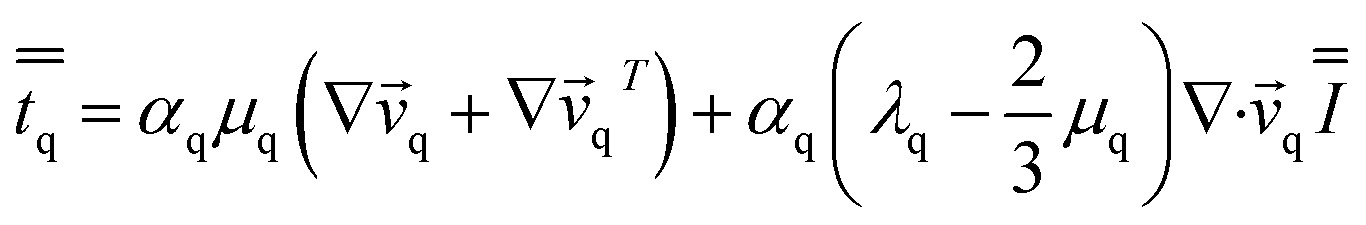
eqn (2) is the q phase stress–strain tensor, which can be expressed as:
| |
 | (6) |
where
μq and
λq are the shear and bulk viscosity of phase q.
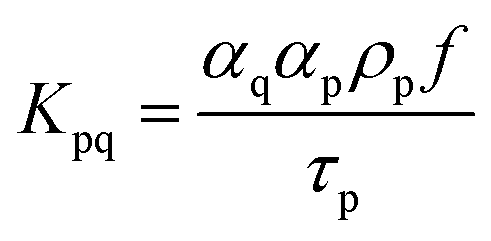
Moreover, and the exchange coefficient was obtained with the following equation:
| |
 | (7) |
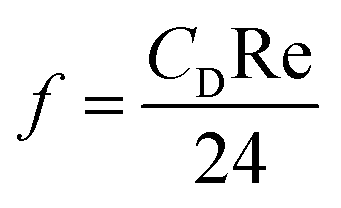
where
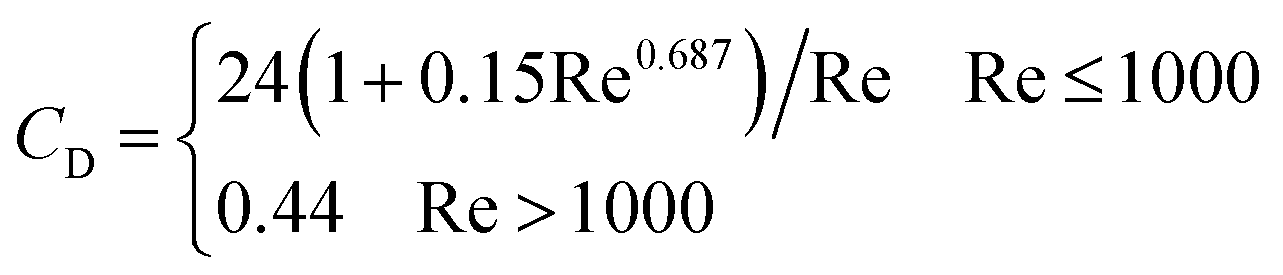
f is the drag function and
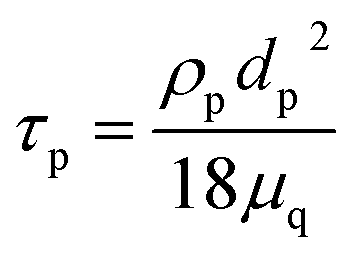
τp is the “particulate relaxation time”, defined as
| |
 | (8) |
| |
 | (9) |
| |
 | (10) |
where
dp is the diameter of the droplets of phase p, which were set based on the experimental data.
30 Re is the relative Reynolds number.
In this paper, the transport equation of tracer is used to calculate the mixing-separation time distribution. The transport equation of tracer concentration is as follows,
| |
 | (11) |
where
Yi presents the local mass fraction of each species,
Di,m is the mass diffusion coefficient for species i in the mixture,
μt is the turbulent viscosity, Sc
t is the turbulent Schmidt number, the default Sc
t is 0.7.
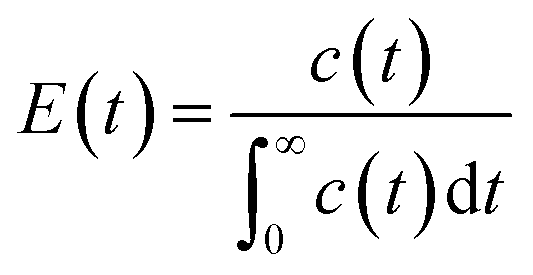
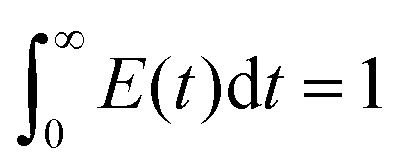
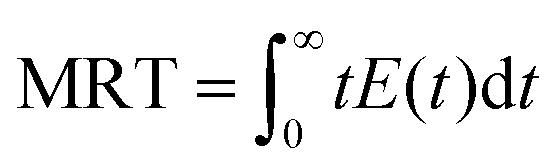
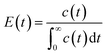
The pulse tracing method was used in the residence time distribution simulation. 5% tracer was added at the dispersed phase inlet in one time step. And the variation of tracer volume fraction c(t) at different times at the detection locations were detected. Bases on the volume fraction distributions, the residence time distribution function E(t) and the average residence time (MRT) of dispersed phase were obtained, which can be calculated as follows,
| |
 | (12) |
| |
 | (13) |
| |
 | (14) |
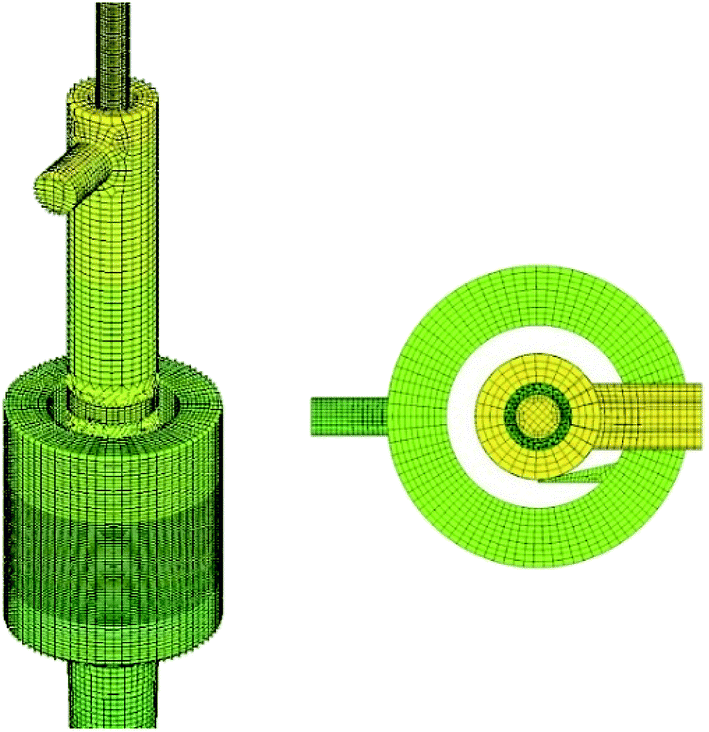
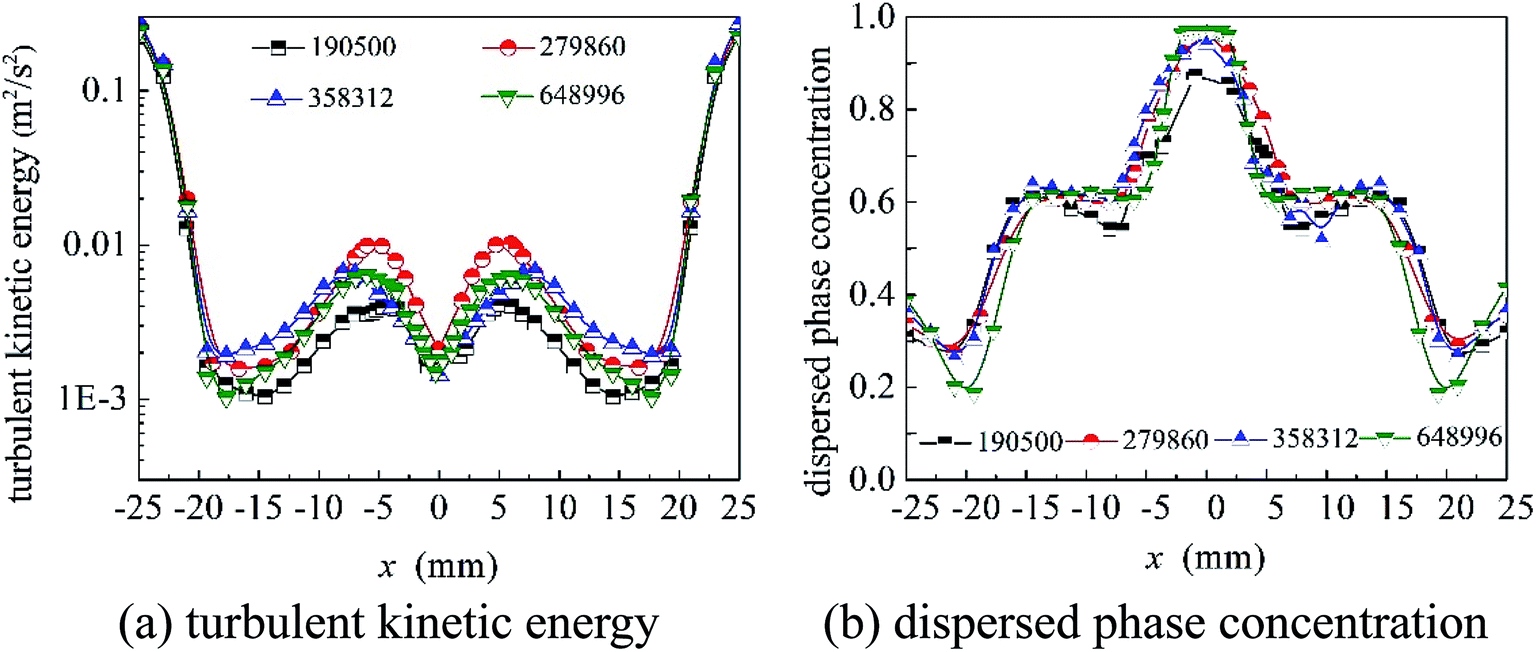
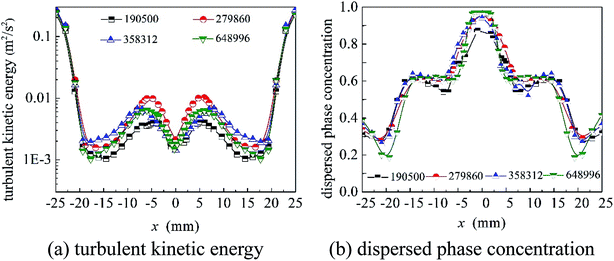
As shown in Fig. 1, the structure of the cyclone reactor is relatively complex, particularly near the guided vane and overflow outlet. Therefore, the local mesh improvement procedure and hexahedral mesh priority principle were used to improve the mesh quality. A typical mesh of the cyclone reactor is shown in Fig. 3. To validate the numerical results, the grid dependence was first examined to minimize numerical uncertainty. The turbulent kinetic energy and axial distribution of dispersed phase concentration at the A–A cross section (z = 55 mm) using different grid numbers is shown in Fig. 4. The results show that the simulation results fitted well with the experimental data when the grid number was greater than 304![[thin space (1/6-em)]](https://www.rsc.org/images/entities/char_2009.gif) 400. Therefore, a total of 304400 cells was used to maximize simulation cost and time.
400. Therefore, a total of 304400 cells was used to maximize simulation cost and time.
 |
| | Fig. 3 Cyclone reactor meshes. | |
 |
| | Fig. 4 Grid independence verification. | |
4. Results and discussions
4.1. Validity of the results
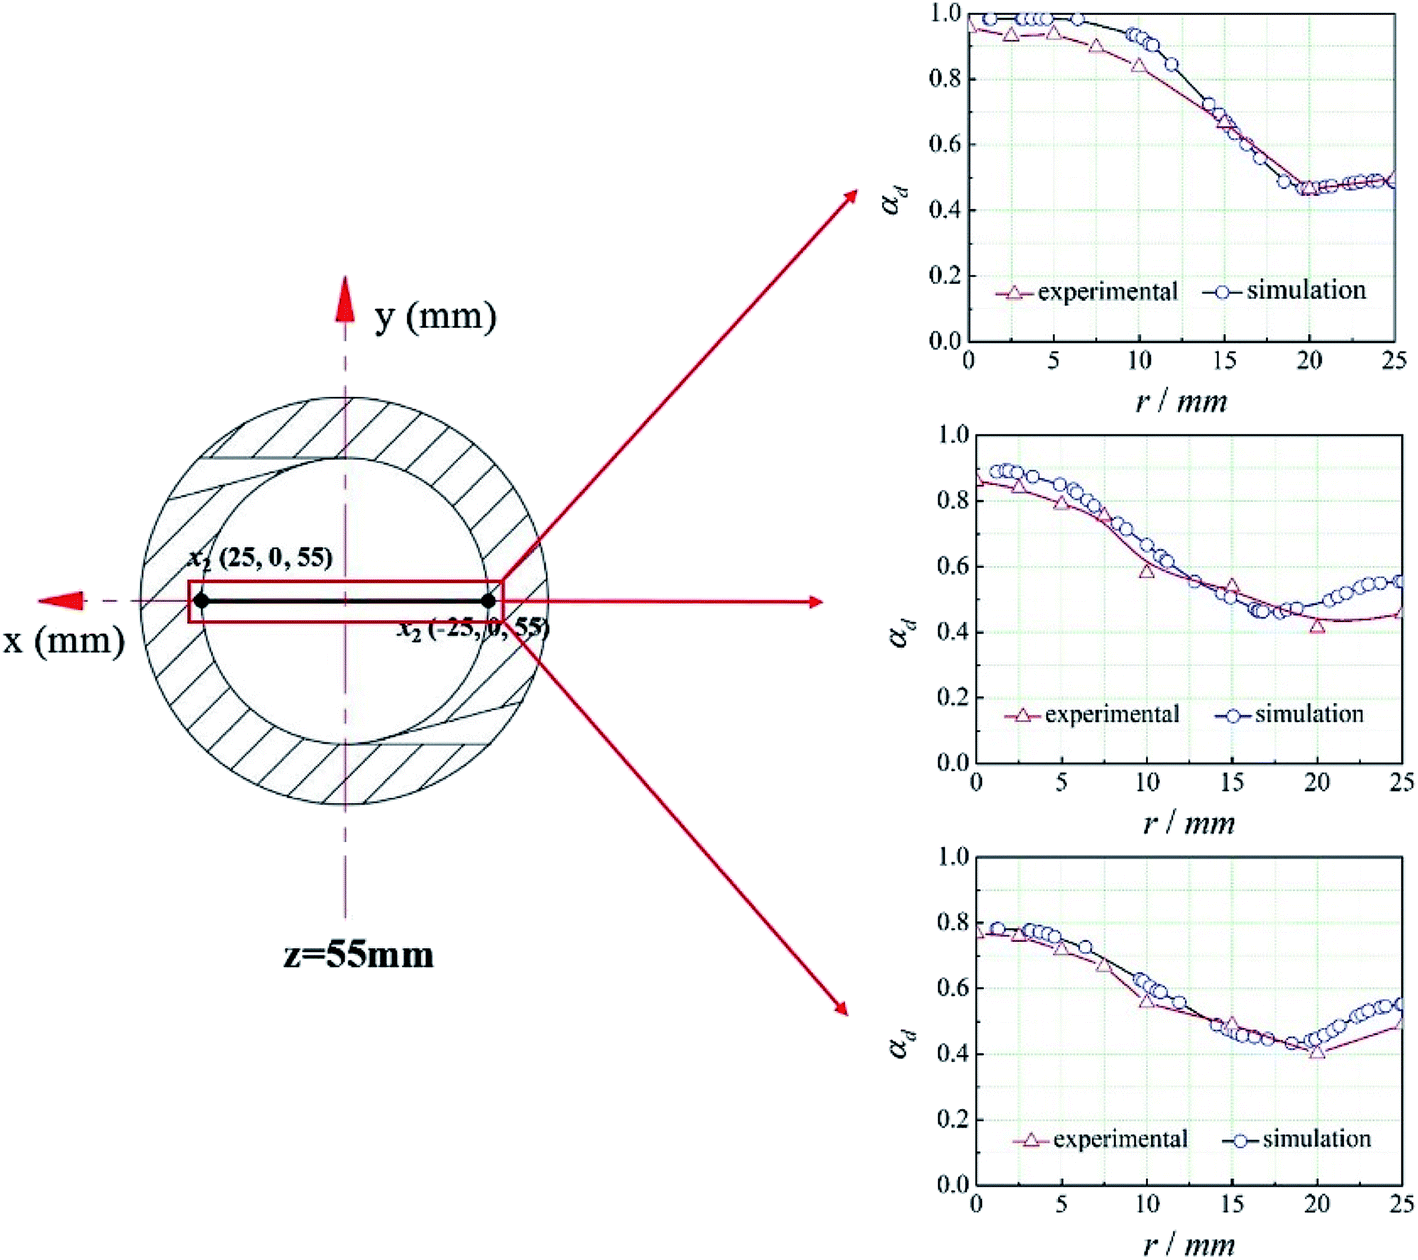
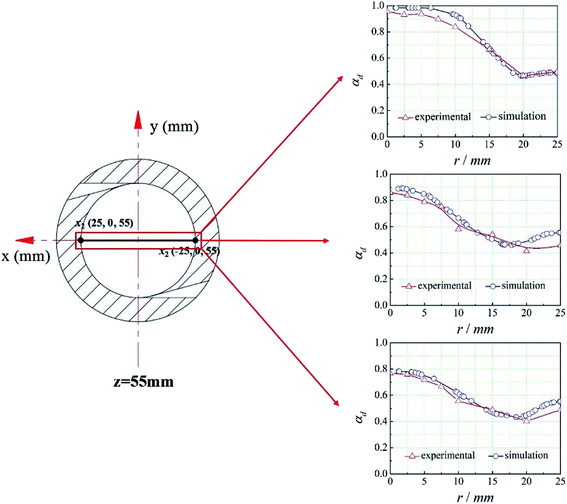
The CFD method mentioned above was used to simulate the flow field in the cyclone reactor. And the line x1x2 at z = 55 mm was set as the monitoring line, the coordinates of x1 and x2 are shown in Fig. 5. To validate the simulation results, we compared the experimental data and the simulation results of the dispersed phase volume fraction (εd) at different radial position under different operational parameters (the overflow ratio, which is defined as the ratio of overflow outlet flow rate to the total inlet flow rate of two phases, is 0.4, 0.5, 0.6, respectively).20 It can be seen from Fig. 5 that there is a good agreement between the experimental and predicted data and the error between them is less than 5%. Therefore, the CFD method can be used to predict the flow field in the cyclone reactor.
 |
| | Fig. 5 Comparison between the experimental and predicted results. | |
4.2. Defination of the mean mixing-separation time
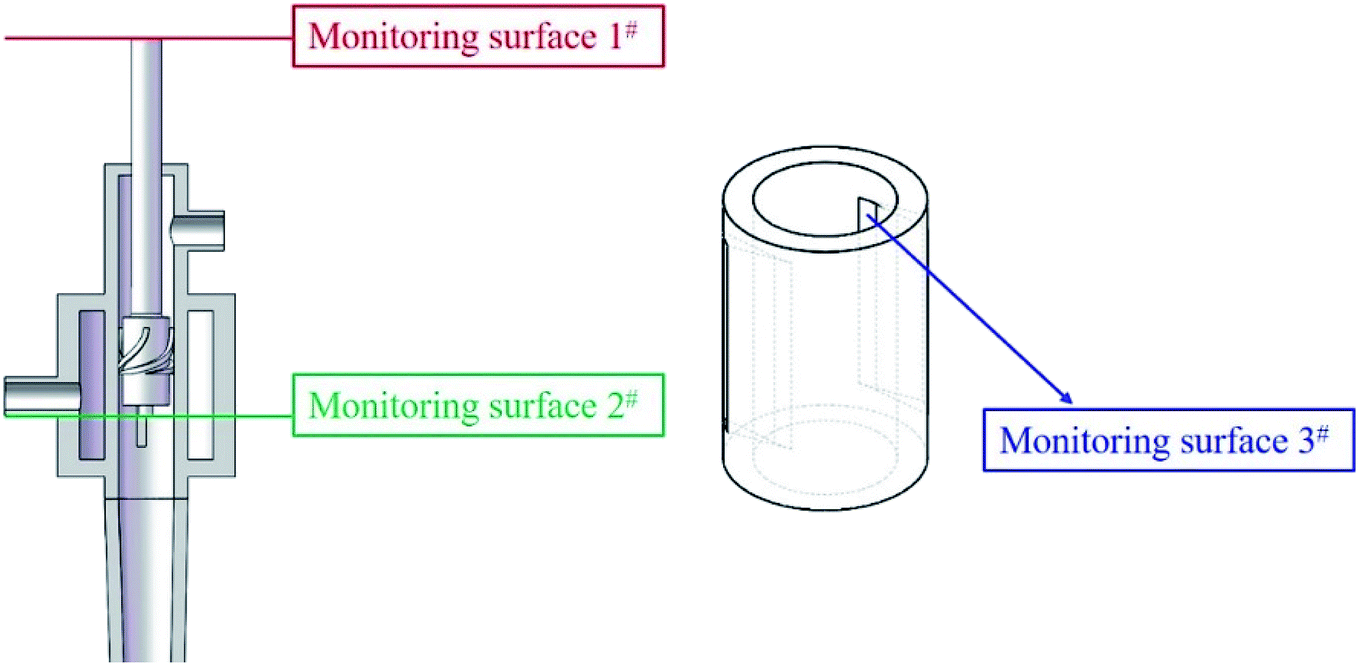
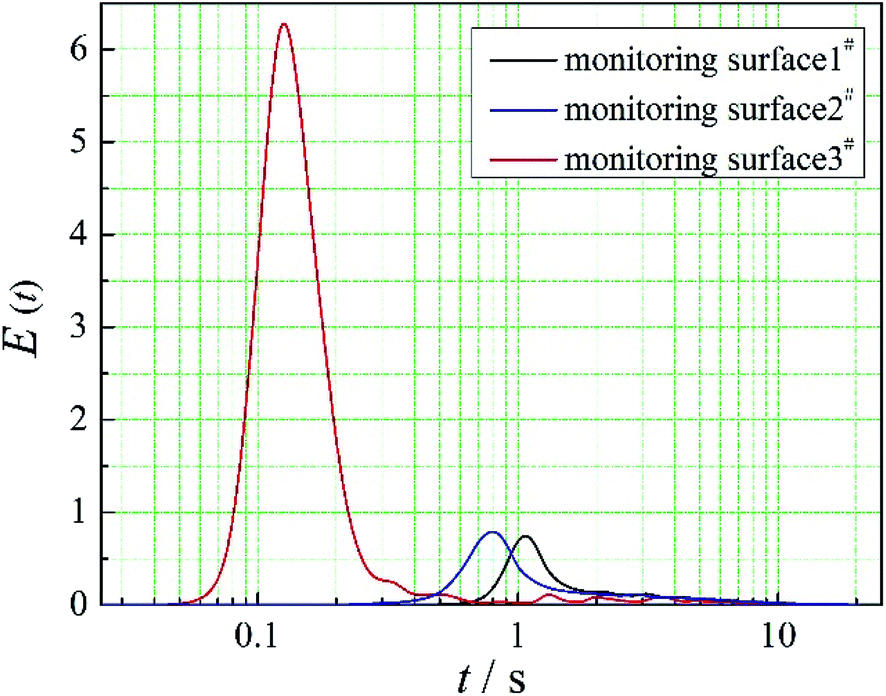
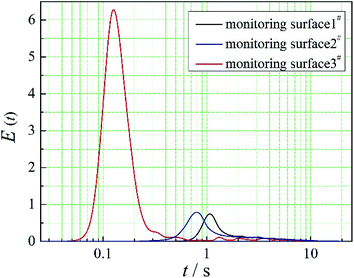
The positions of the three monitoring surface are shown in Fig. 6. As shown in Fig. 6, the MRT calculated on the c(t) at monitoring surface 1# represents the residence time of dispersed phase in the cyclone reactor. However, the mixing-separation time between two phases in the cyclone reactor is different from the residence time of dispersed phase. The residence time in the cushion chamber and overflow tube should be ignored. Therefore, the flow time from monitoring surface 3# to monitoring surface 2# of dispersed phase is defined as the mixing-separation time between two phases in the cyclone reactor. Fig. 7 shows the difference between residence time distribution function E(t) at three monitoring surfaces. As shown in Fig. 7, the RTD curves show one obvious peak with a tail, which indicates that dead-zone may exist in the cyclone reactor. Moreover, the peak of the residence time distribution at monitoring surface 3# is higher than the other two monitoring surfaces. And the position of the peak at monitoring surface 2# is on the left of the position of the peak at monitoring surface 1#, which is consistent with that the time flow to monitoring surface 1# is longer then the time flow to monitoring surface 2#.
 |
| | Fig. 6 Monitoring surface position. | |
 |
| | Fig. 7 RTD curves at monitoring surfaces. | |
4.3. Effect of structural parameters of the slot on the mixing-separation time between two phases
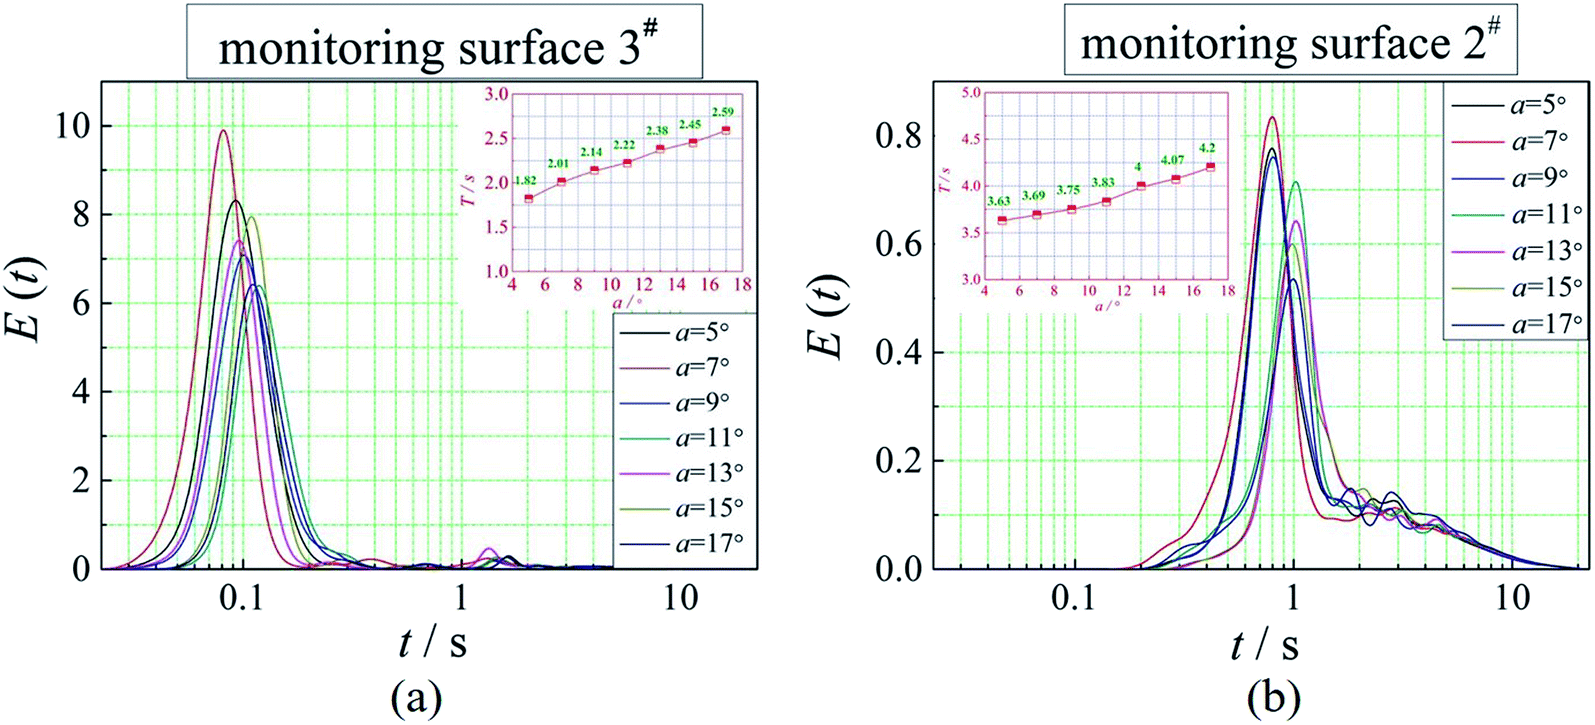
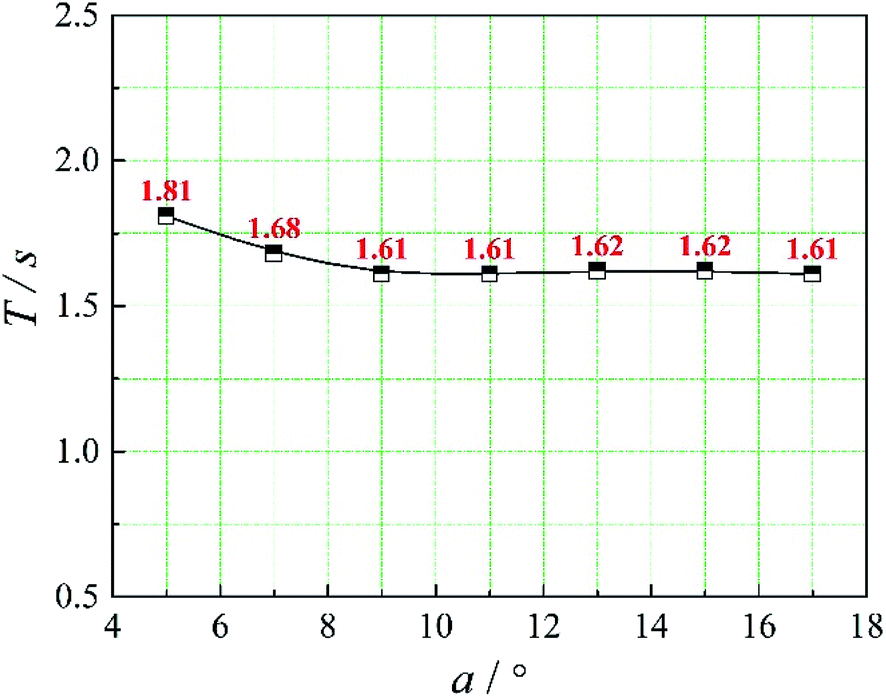
4.3.1. Effect of a on the mixing-separation time between two phases. The effect of the angle of the slot on the RTD curves at monitoring surface 2# and 3# is shown in Fig. 8. As shown in Fig. 8, the variation of the RTD curves under different angles of the slot at monitoring surface 3# is more regular than that at monitoring surface 2#. With the increase of the angle of the slot, the change of the RTD curves is not obvious. Fig. 9 shows the effect of the angle of the slot on the mean mixing-separation time. As shown in Fig. 9, with the increase of the angle of the slot, the mixing-separation time between two phases reduces firstly and then tends to be stable. The change of the angle of the slot does not show effect on the velocity of dispersed phase flow into the cyclone reactor. But when the angle is too small, the wall adhesion is harmful to the process that dispersed phase flows from cushion chamber into the cyclone reactor. Thereby, when the angle changes from 5° to 7°, the mean mixing-separation time reduces because of effect of the wall adhesion decreases. Besides, when the angle is greater than 7°, wall adhesion shows little influence on the flow process of dispersed phase from cushion chamber into the cyclone reactor.
 |
| | Fig. 8 Effect of a on the RTD curves. | |
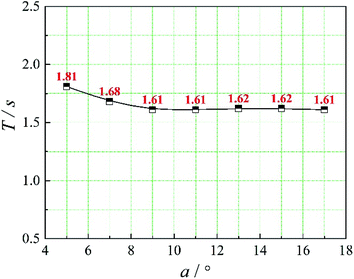 |
| | Fig. 9 Mean mixing-separation time under different angles of the slot. | |
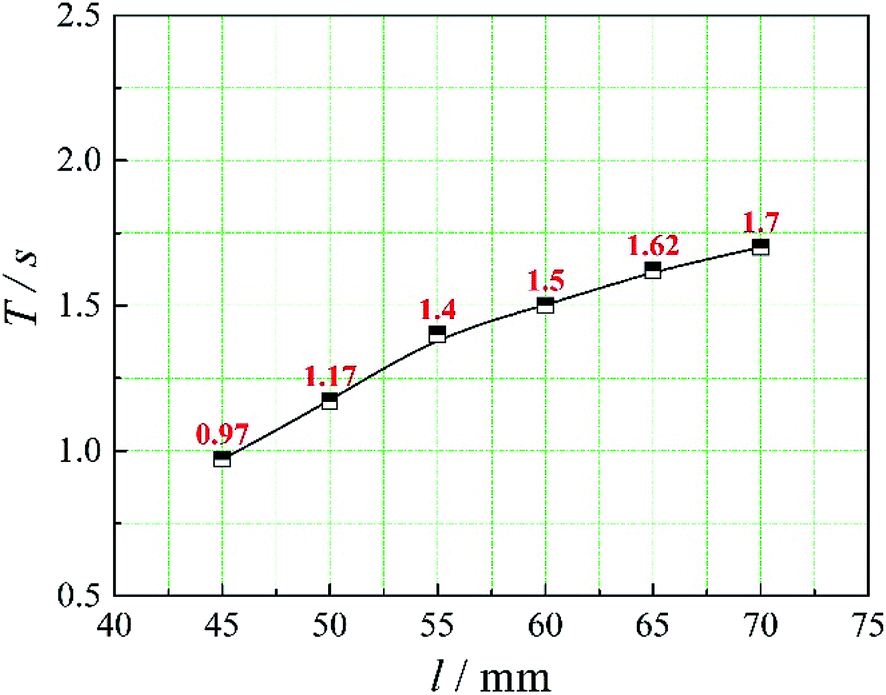
4.3.2. Effect of l on the mixing-separation time between two phases. Fig. 10 shows the effect of the length of the slot on the RTD curves at monitoring surface 2# and 3#. As shown in Fig. 10a, with the increase of the length of the slot, the peak of the RTD curves at monitoring surface 3# becomes lower and the peak moves to the right, which mean that the flow time from inlet to the monitoring surface 3# increases. Compared with the variation of the RTD curves at monitoring surface 3#, the change of the RTD curves at monitoring surface 2# is more obvious. The peak of the RTD curves also moves to the right with the increase of the length of the slot. Fig. 11 shows the variation of the mean mixing-separation time with the increase of the length of the slot. As shown in Fig. 11, the variation tendency is consistent with the results in Fig. 10. It is known that the flow velocity of two phases all show effect on the mixing-separation time in the cyclone reactor from the introduction of the cyclone reactor. The relative velocity between two phases increases the residence time of dispersed phase in the cyclone reactor. Therefore, the decrease of the velocity of dispersed phase caused by the increase of the length of the slot leads to the increase of the relative velocity between two phases. As a result, the mean mixing-separation time between two phases in the cyclone reactor increases.
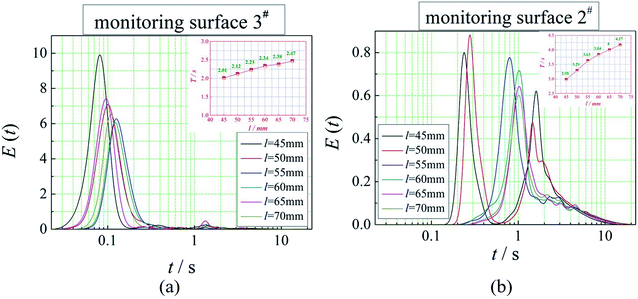 |
| | Fig. 10 Effect of l on the RTD curves. | |
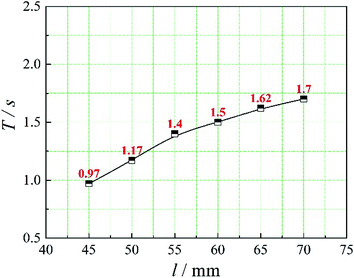 |
| | Fig. 11 Mean mixing-separation time under different length of the slot. | |
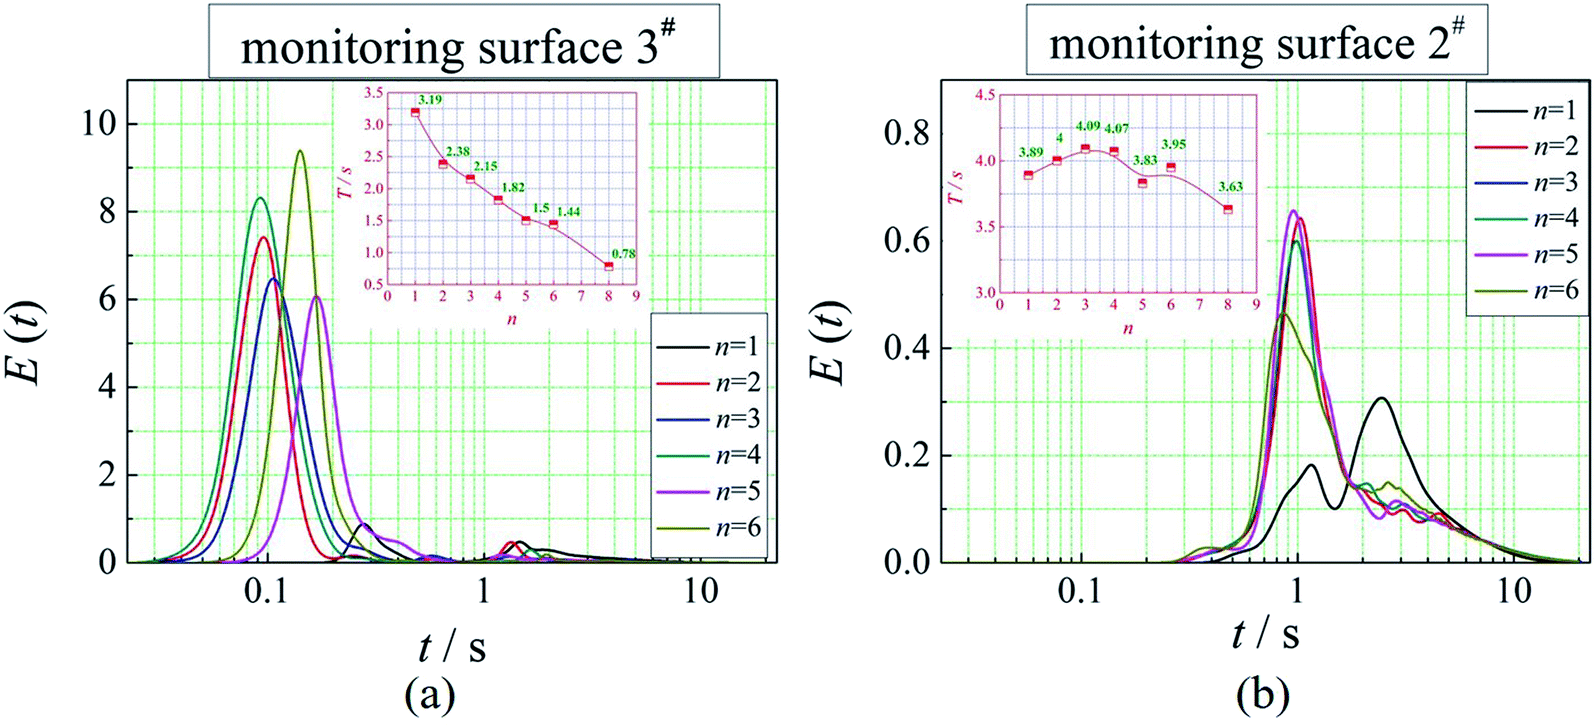
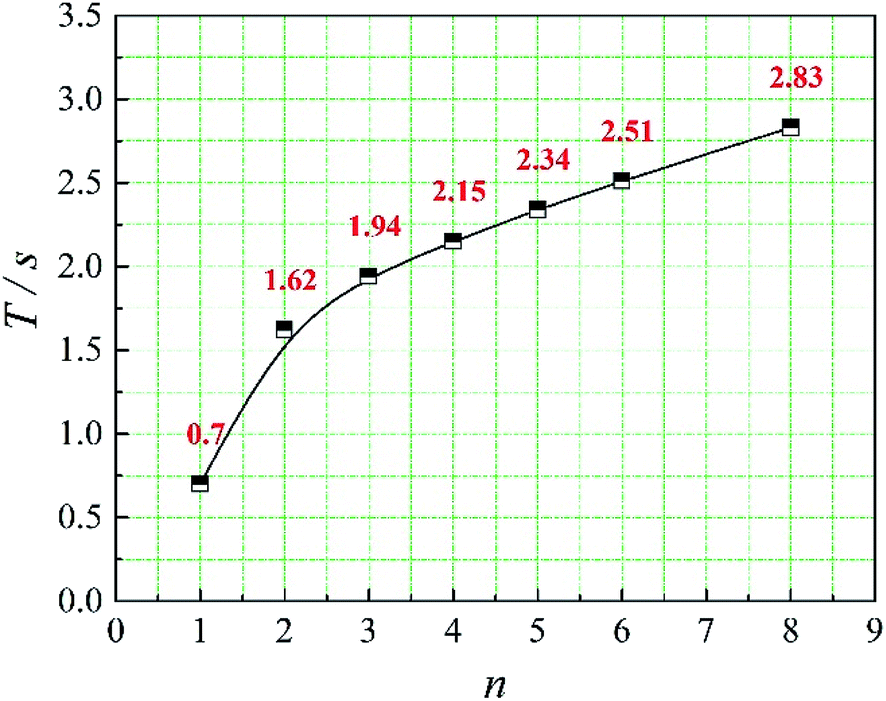
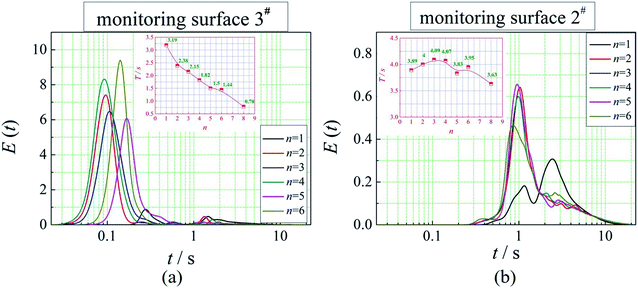
4.3.3. Effect of n on the mixing-separation time between two phases. The effect of the number of the slot on the RTD curves at monitoring surface 2# and 3# is shown in Fig. 12. It can be seen that the variation of the RTD curves is not regular with the increase of the number of the slot both at monitoring surface 2# and 3#. But the flow time that dispersed phase flow to monitoring surface 2# and 3# changes regularly over the number of the slot. As shown in Fig. 12, the time that dispersed phase flow to monitoring surface 3# decreases with the increase of the number of the slot. And the time that dispersed phase flow to monitoring surface 2# also shows a downward trend with the increase of the number of the slot generally. Fig. 13 shows the variation of the mean mixing-separation time with the increase of the number of the slot. As shown in Fig. 13, the mean mixing-separation time increase with the increase of the number of the slot. The velocity of dispersed phase flow into the reaction chamber decreases with the increase of the number of the slot. Meanwhile, the time that the dispersed phase stay in the cushion chamber decreases. Therefore, the time that the dispersed phase flow into the monitoring surface 3# was affected by the mentioned two aspects. Besides when the number of the slot is 1, the RTD curves is bimodal at monitoring surface 2# and 3#. We all know that the dispersed phase flow from the inlet to the slot in two directions, and the two roads take different time. Thus, there exits two peaks in the RTD of the dispersed phase at monitoring surface 3#. Correspondingly, the RTD of the dispersed phase at monitoring surface 2# is bimodal.
 |
| | Fig. 12 Effect of n on the RTD curves. | |
 |
| | Fig. 13 Mean mixing-separation time under different length of the slot. | |
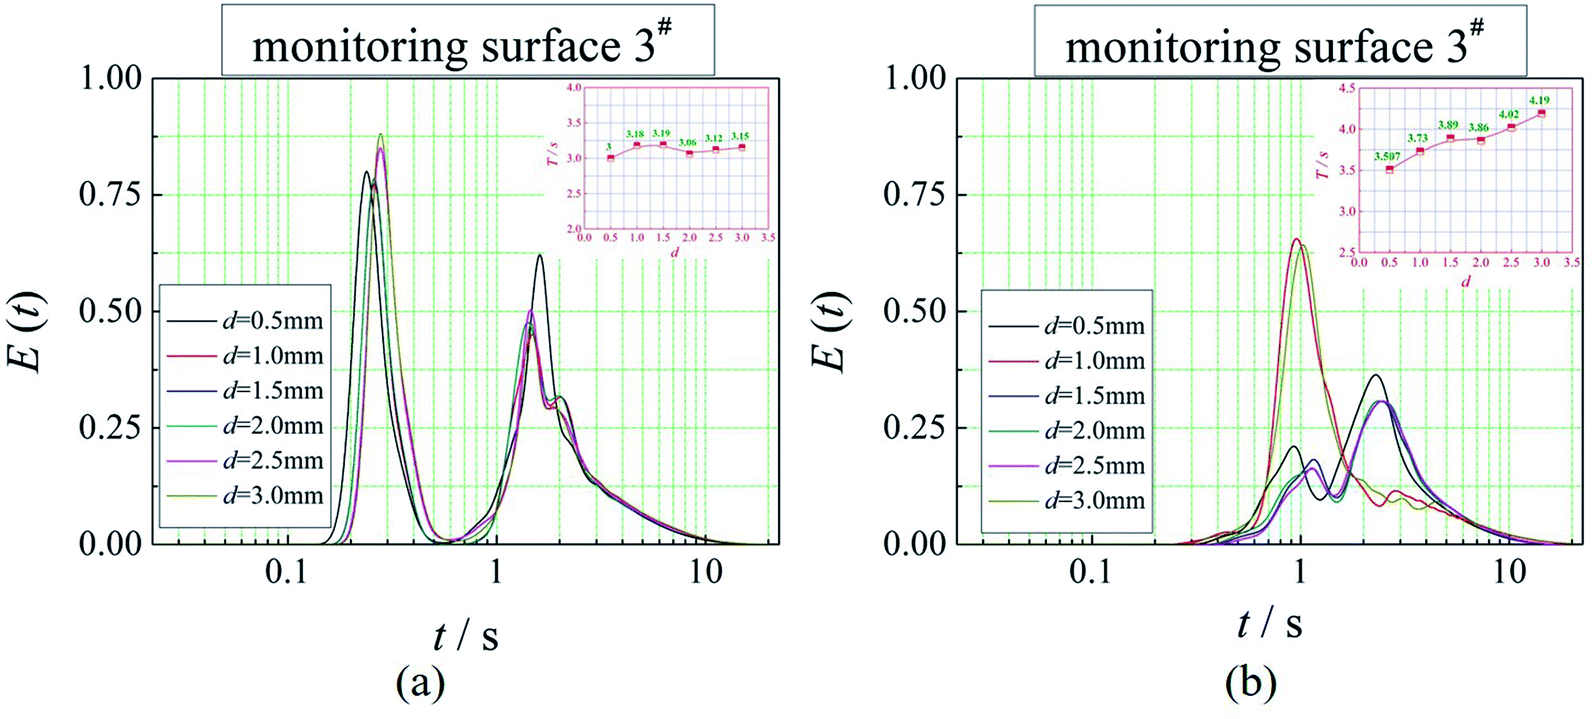
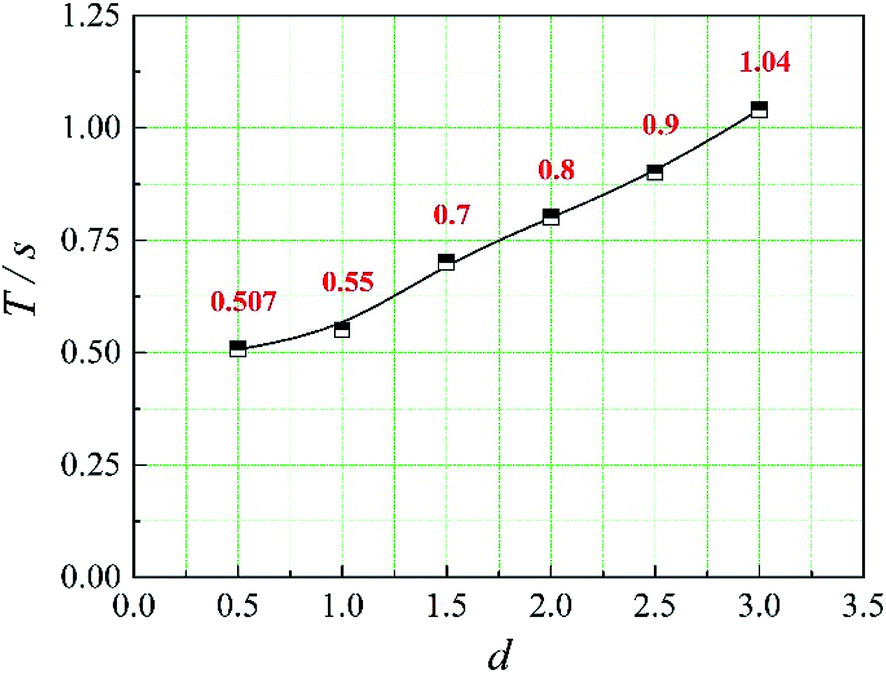
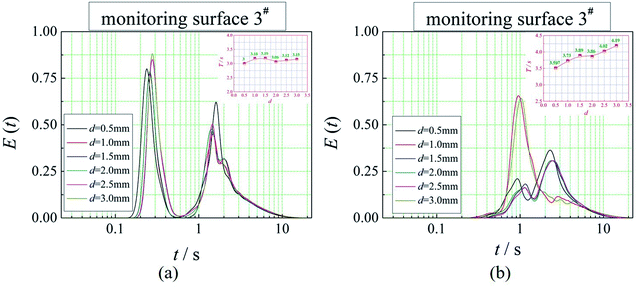
4.3.4. Effect of d on the mixing-separation time between two phases. Fig. 14 shows the effect of the distance of the slot on the RTD curves at monitoring surface 2# and 3#. As shown in Fig. 14, the influence of the distance on the RTD curves is less than that of the number of the slot, which indicates the variation of the velocity of dispersed phase caused by the distance of the slot is smaller than that caused by the number of the slot. With the increase of the distance of the slot, the time that the dispersed phase flow to the monitoring surface 2# and 3# increases, which is related to that the velocity of dispersed phase decrease with the increase of the distance of the slot. Therefore, the mean mixing-separation time increase with increase of the distance of the slot, which can be seen in Fig. 15. Moreover, the number of the slot is 1 during the investigation of the effect of the distance of the slot on the mean mixing-separation time. Therefore, the RTD curves under different distance of the slot is bimodal, which is consistent with the analysis in 4.3.3.
 |
| | Fig. 14 Effect of d on the RTD curves. | |
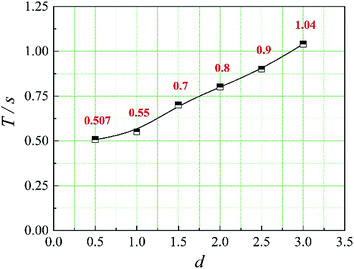 |
| | Fig. 15 Mean mixing-separation time under different distance of the slot. | |
4.4. Development prediction model to calculate the mean mixing-separation time
It can be concluded from the above analysis that the mean mixing-separation time between two phases in the cyclone reactor, namely the time of the dispersed phase flow from monitoring surface 3# to monitoring surface 2#, is related to the velocity of dispersed phase into the reaction chamber. And the mixing process between two phases in the cyclone reactor is the dispersion of dispersed phase into continuous phase in the form of droplets. Besides, the effect of the operational parameters (total inlet flow, feed ratio, overflow ratio) on the flow field in the cyclone reactor have been investigated in the previous studies. The results show that the total inlet flow and feed ratio are the main influence factors on the flow field in the reaction chamber and the velocities of two phases change with the change of total inlet flow and feed ratio.20,23 Based on these results, we can conclude that the relative velocity between two phases plays an important role in the dispersion process. Therefore, we established a prediction model to explain the relationship between the mean mixing-separation time and the velocity of two phases, which is shown in eqn (12).
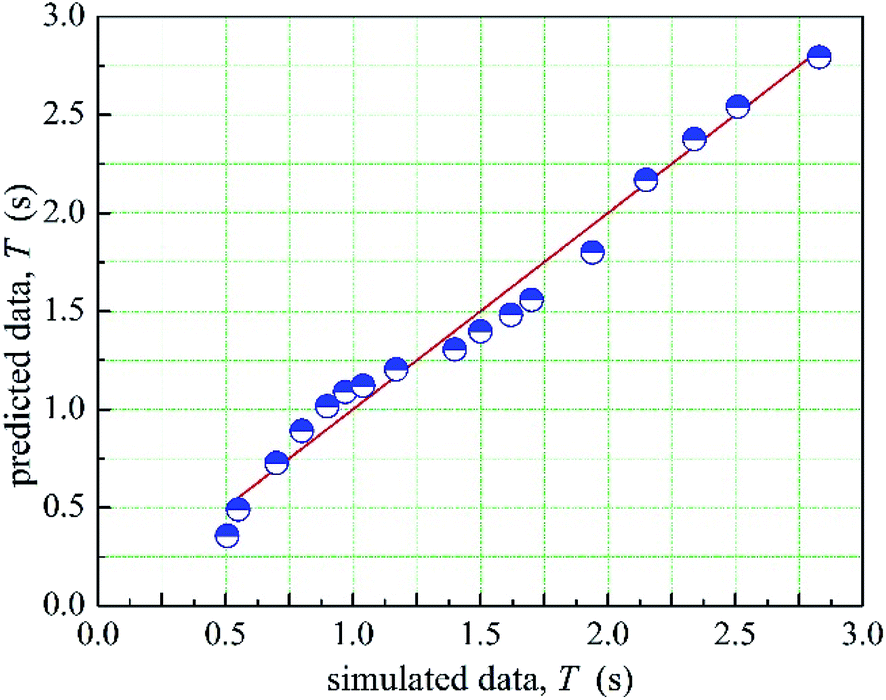
The 1stopt5.0 software was used in the fitting process to calculate the coefficient in the prediction model. The optimized a, b, c, d is −0.137, 0.135, −67.767, 9.174, respectively. Therefore, the relationship between the mean mixing-separation time and velocity of two phases is as shown in eqn (11). Moreover, the comparison between the prediction data and the simulated data is shown in Fig. 16. As shown in Fig. 16, the prediction data agrees well with the simulated data.
| | |
T = −0.137vd0.135vc−67.767 + 9.174
| (16) |
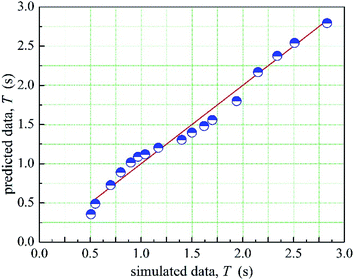 |
| | Fig. 16 Comparison between fitting data and simulated data. | |
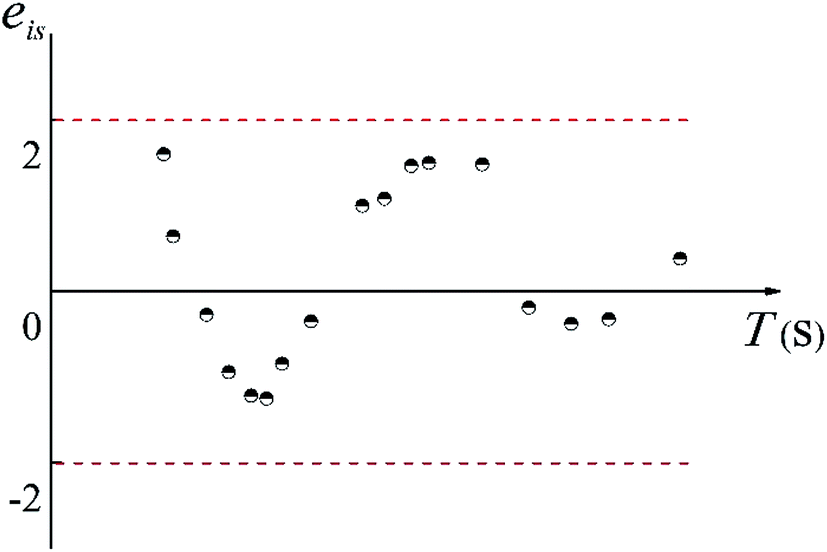
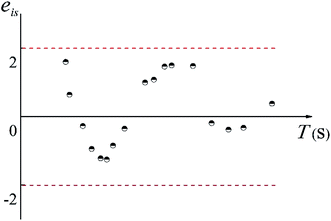
Moreover, if the basic hypothesis of the prediction model is reasonable, the standardized residual, eis, obeys a normal distribution, therefore,
The distribution of eis is shown in Fig. 7. As shown in Fig. 17, more than 95% of the points are in the belt area (eis ± 2) with a random distribution, which indicated the predicted data and experimental data are in good agreement. Therefore, the prediction model can be used to calculate the mean mixing-separation time between two phases in the cyclone reactor.
 |
| | Fig. 17 Residual graph. | |
5. Conclusion
In this paper, a CFD model was adopted to investigate the mixing-separation time between two phases in a multi-element process coupled cyclone reactor for ionic liquid-catalyzed isobutane/butene alkylation. We investigated the effect of structural parameters of the dispersed phase inlet (the slot) on the residence time distributions of dispersed phase and mean mixing-separation time between two phases in the cyclone reactor. The results show that the main factor to affect the mean mixing-separation time are the velocity of dispersed phase flow into the reaction chamber and the relative velocity between two phases in the cyclone reactor. Besides, when the number of the slot is 1, the residence time distribution is a bimodal distribution. Moreover, a prediction model to calculate the mean mixing-separation time between two phases in the cyclone reactor was established.
Conflicts of interest
There are no conflicts to declare.
Acknowledgements
The authors gratefully acknowledge the support from the National Science Fund for Distinguished Young Scholars: No. 21425626, National Natural Science Foundation of China: No. 51806248 and the Doctoral Research Fund of Shandong Jianzhu University: No. X18068Z.
References
- W. Z. Zheng, H. Y. Wang, W. X. Xie, L. Zhao and W. Z. Sun, AIChE J., 2017, 64(3), 950–960 CrossRef.
- H. Wang, X. Z. Meng, G. Y. Zhao and S. J. Zhang, Green Chem., 2017, 19(6), 1462–1489 RSC.
- L. F. Albright, Ind. Eng. Chem. Res., 2009, 48(3), 1409–1413 CrossRef CAS.
- J. S. Wilkes, J. A. Levisky, R. A. Wilson and C. Hussey, Inorg. Chem., 1982, 21(3), 1263–1264 CrossRef CAS.
- T. Welton, Chem. Rev., 1999, 99(8), 2071–2084 CrossRef CAS PubMed.
- R. Sheldon, Chem. Commun., 2001, 23, 2399–2407 RSC.
- J. F. Brennecke and E. J. Maginn, AIChE J., 2001, 47(11), 2384–2389 CrossRef CAS.
- K. Yoo, V. V. Namboodiri, R. S. Varma and P. G. Smirniotis, J. Catal., 2004, 222, 511–519 CrossRef CAS.
- L. Schmerling, J. Am. Chem. Soc., 2002, 68(2), 2491–2497 Search PubMed.
- J. J. Zhou, Z. C. Liu and M. X. Liu, Acta Pet. Sin., Pet. Process. Sect., 2008, 24(2), 134–140 CAS.
- S. J. Royaee, M. Sohrabi and A. Shafeghat, Korean J. Chem. Eng., 2014, 31(2), 240–247 CrossRef CAS.
- J. Lédé, F. Broust, F. T. Ndiaye and M. Ferrer, Fuel, 2007, 86(12–13), 1800–1810 CrossRef.
- V. Shilapuram, D. Jaya Krishna and N. Ozalp, Int. J. Hydrogen Energy, 2011, 36(21), 13488–13500 CrossRef CAS.
- A. M. Fonseca, J. J. Órfão and R. L. Salcedo, Ind. Eng. Chem. Res., 2001, 40(1), 304–313 CrossRef CAS.
- D. Weuster-Botz, E. Hünnekes and A. Hartbrich, Bioprocess Eng., 1998, 18(6), 433 CrossRef CAS.
- Y. C. Zhang, Z. B. Wang and Y. H. Jin, Chem. Eng. Res. Des., 2013, 91(9), 1768–1776 CrossRef CAS.
- P. V. Danckwerts, Chem. Eng. Sci., 1953, 2(1), 1–13 CrossRef CAS.
- I. L. Gamba, S. Marquez Damian, D. A. Estenoz, N. Nigro, M. A. Storti and D. Knoeppel, Int. J. Chem. React. Eng., 2012, 10(1), 1542-6580 Search PubMed.
- J. T. Adeosun and A. Lawal, Chem. Eng. Sci., 2009, 64(10), 2422–2432 CrossRef CAS.
- M. Y. Zhang, L. Wang, L. Y. Zhu, Z. B. Wang, Z. C. Liu and Y. H. Jin, Chem. Eng. Res. Des., 2017, 125, 257–264 CrossRef CAS.
- Z. B. Wang, M. Y. Zhang, Z. C. Liu, L. Y. Zhu, Y. H. Jin and C. M. Xu, Chem. Eng. Res. Des., 2018, 137, 502–509 CrossRef CAS.
- M. Y. Zhang, T. Y. Zhang, L. Y. Zhu, Z. B. Wang and Y. H. Jin, Powder Technol., 2017, 316, 289–295 CrossRef CAS.
- M. Y. Zhang, L. Y. Zhu, Z. B. Wang, Z. C. Liu, Z. Z. Liu, C. M. Xu and Y. H. Jin, Chem. Eng. Res. Des., 2017, 125, 282–290 CrossRef CAS.
- Z. B. Wang, Y. Ma and Y. H. Jin, Chem. Eng. Res. Des., 2011, 89(6), 603–610 CrossRef CAS.
- M. Narasimaha, R. Sripriya and P. K. Banerjee, Int. J. Miner. Process., 2005, 75(1–2), 53–68 CrossRef.
- T. B. Anderson and R. A. Jackson, Ind. Eng. Chem. Fundam., 1967, 6, 527–534 CrossRef CAS.
- R. M. Bowen, in Continuum Physics, ed. A. C. Eringen, Academic Press, New York, 1967, pp. 1–127 Search PubMed.
- A. Tomiyama, H. Tamai, I. Zun and S. Hosokawa, Chem. Eng. Sci., 2002, 57(11), 1849–1858 CrossRef CAS.
- D. A. Drew and R. T. Lahey, in Particulate Two-Phase Flow, Butterworth-Heinemann, Boston, 1993, pp. MA509–566 Search PubMed.
- M. Y. Zhang, A. J. Li, L. Y. Zhu, Z. B. Wang, Z. C. Liu and Y. H. Jin, Separation and Purification Technology, 2019, 209, 375–382 CrossRef CAS.
|
| This journal is © The Royal Society of Chemistry 2019 |
Click here to see how this site uses Cookies. View our privacy policy here. 
 Open Access Article
 This Open Access Article is licensed under a Creative Commons Attribution-Non Commercial 3.0 Unported Licence
 *a,
Xiaoyu Li*b,
Shijie Lia,
Yan Gaoa,
Zhenbo Wang
*a,
Xiaoyu Li*b,
Shijie Lia,
Yan Gaoa,
Zhenbo Wang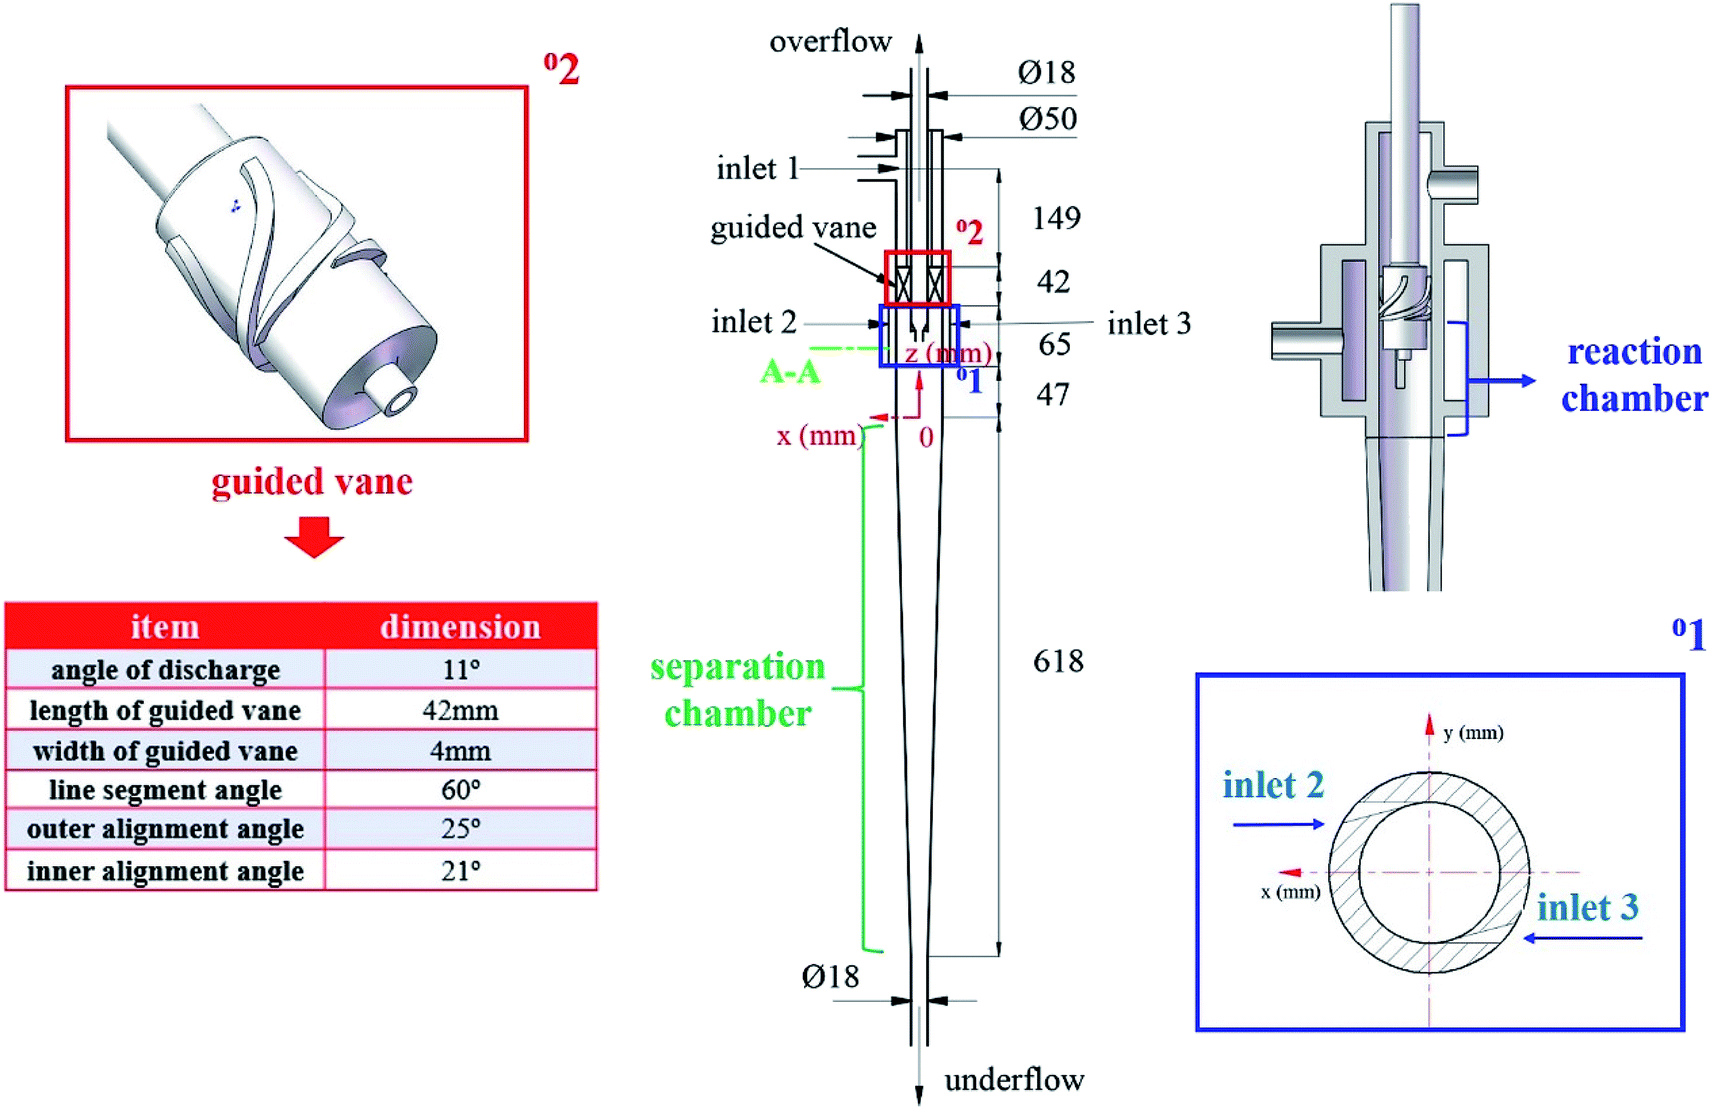

 denotes the phase material time derivative of the form
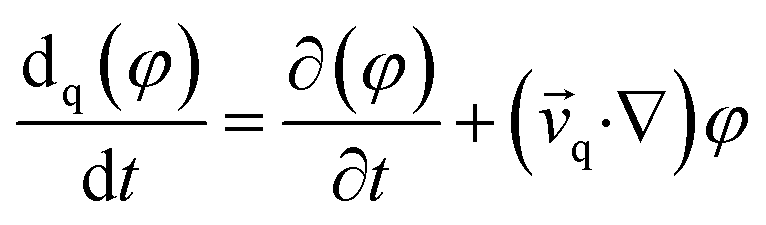
 in eqn (2) is the q phase stress–strain tensor, which can be expressed as: