 Open Access Article
Flow modification enhancing the growth rate in top seeded solution growth of SiC crystals†
Minh-Tan Ha ab,
Yeong-Jae Yua,
Yun-Ji Shina,
Si-Young Baea,
Myung-Hyun Leea,
Cheol-Jin Kimb and
Seong-Min Jeong
 *a
*a
aEnergy and Environmental Division, Korea Institute of Ceramic Engineering and Technology, Jinju-si 52851, Korea. E-mail: smjeong@kicet.re.kr
bDepartment of Ceramic Engineering, Gyeongsang National University, Jinju-si 52828, Korea
First published on 27th August 2019
Abstract
In this study, multiphysics simulations were carried out to understand the convection mechanisms of the top seeded solution growth (TSSG) of SiC. Experimental melting tests and crystal growth were conducted to verify the simulation results in the growing temperatures between 1700 and 1900 °C with rf induction heating furnace. From the solidified melt of Si–Cr solution after the melting test, the melt flow in the simulation was successfully verified. In the given experimental conditions, the electromagnetic convection was found to govern the global fluid flow, while other mechanisms including the Marangoni convection, the buoyancy convection and the centrifugal forced convection influence the fluid flow near the crystal. Based on an understanding of the fluid flow obtained with the simulations, a structural flow modifier (FM) was applied to enhance the growth rate of the SiC crystal. The growth rates of SiC with/without FM were successfully estimated from simulations showing good agreements with the experimental values. After the experimental crystal growth using FM, a remarkable enhancement in the growth rate was found in an FM configuration, which suggests a way to improve the growth rate by the TSSG method based on the efficient use of the dissolved C in the melt.
Introduction
Power devices are a key component for generating, transporting, and consuming electric energy in modern industrial societies. Hence, the efficient usage of electric energy is essential to realize a sustainable society that should be established for the next generation. Hence, SiC is a promising substrate applicable to highly efficient power. SiC single crystals were first grown by physical vapor transport (PVT) methods in 1978,1 and significant progress in crystal size has been demonstrated in the commercialized 150 mm (6 inch) wafer and demonstrated 200 mm (8 inch) wafer.2Although crystal growth via PVT is used currently as the mass production method for SiC crystals, SiC wafers fabricated using the PVT method still exhibit quality issues such as high dislocation density. The quality issue in SiC wafers necessitates an alternative method to obtain high-quality SiC crystals. As an alternative growing method for SiC bulk crystal, the top seeded solution growth (TSSG) method has been developed for the last two decades.3–5 The TSSG method has been confirmed to be advantageous in obtaining high-quality SiC crystals by reducing the dislocation density6–8 and with a reasonable growth rate such that TSSG is now assumed as the next-generation fabrication method of SiC crystals.
Because SiC forms incongruent melts of Si with dissolved C, the composition ratio of Si and C is inevitably not uniform in the melt of the TSSG method.9 When SiC is formed at the crystal, the same amount of Si and C is consumed from the melt. Because C has low solubility in Si liquid, however, C can deplete easily near the crystal without a continuous C feed by fluid flow. Hence, the crystal growth of SiC is affected significantly by mass transport in the TSSG method. The mass transport in the melt is inevitably affected by the operating conditions, such as the hot-zone design, operating temperature, and melt composition.
To stabilize the process condition, the mass transport of the melt in the TSSG method should be optimized, as emphasized in previous studies.10–13 Concerning the mass transport of the melt in the TSSG method, Yamamoto et al. reported that both electromagnetic and Marangoni convections are dominant,10,11 while Mercier et al. suggested that buoyancy convection is dominant.12 The difference in the dominant factor reported by Yamamoto et al. and Mercier et al. might be due to the differences in experimental setups, including the reactor designs and operating conditions. The difference in the governing convections reported in the literature10–12 suggests that the experimental setup of TSSG should be fully understood for optimizing the crystal growth of SiC.
Because the mass transport of the melt is also influenced by the structural modification of the melt reservoir, efforts to optimize the mass transport by changing the crucible shape have increased. Mercier et al. suggested a podium crucible design to reduce the destabilizing effect of electromagnetic and Marangoni convections.13 Kusunoki et al. adopted an immersion guide attached to a crucible for a homogeneous melt flow near the seed and discovered an improvement in growth rate.14 However, the mass transport of the melt in TSSG must be fully understood for the given experimental setup before modifying the crucible shape.
In this study, we aim to obtain an efficient flow modification to enhance the growth rate of SiC by structural flow modification. Therefore, a comprehensive analysis of the mass transport of the melt based on the TSSG method was first conducted using multiphysics simulations. Next, based on further understanding the mass transport of the melt, a structural modification adopting a “flow modifier (FM)” was suggested to enhance the growth rate of SiC. Finally, the effect of the FM on the growth rate was analyzed by comparing the simulation and experimental results.
Experimental and modeling
The SiC seed crystal was placed by contacting the Si melt with dissolved C in the induction heating furnace (Takeuchi Electric Co., Japan), as illustrated in Fig. 1a. The operating frequency of the induction-heating furnace was 8.5 kHz. High purity (11-Nine) Si chunk (OCI, Korea) was loaded into a graphite crucible of inner diameter 50 mm. The amount of Si was weighed carefully to obtain a Si melt height of 17 mm. The inner crucible was placed inside an outer crucible, where both crucibles were fabricated using graphite (M-501, Morgan, Korea). The crucibles were placed on a crucible shaft that could change the vertical position. A seed crystal was attached to a seed shaft. The graphite parts were enclosed in a thermal insulator (M-501, Morgan, Korea) and isolated in a stainless chamber that was filled by an inert gas such as Ar or He. The temperatures on the melt surface and beneath the outer crucible were measured using pyrometers (IR-CA, Chino, Japan). The melt was heated to a target temperature measured at the melt surface. At the target temperature, the seed crystal touched the melt surface and subsequently rotated at a rate of 30 rpm. After growing for 1 h, the seed shaft was lifted to separate from the melt surface. To characterize the grown crystals, the residual Si on the as-grown crystal was removed chemically with a mixed solution of nitric acid and hydrofluoric acid. After the chemical cleaning, the grown crystals were evaluated using optical microscopy (ME600L, Nikon, Japan), field emission scanning electron microscopy (JSM-7610F, Jeol, Japan), energy dispersive spectroscopy (X-Max 50, Oxford Instruments, UK), and micro-Raman spectroscopy (Alpha300, WITec, Germany). The thickness of the grown layer was measured by optical microscopy after the cross-sectional cutting of the grown crystals following all other characterizations.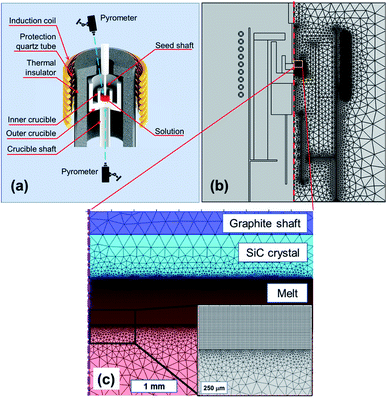 | ||
| Fig. 1 (a) Schematics of a TSSG grower, (b) global meshed model for TSSG grower, and (c) detailed mesh model in the melt and near crystal/melt interface (inset). | ||
Fig. 1b shows the meshed TSSG model used in this study. Meshing is essential in finite element analysis, and an extremely fine mesh is required to solve fluid dynamics because the mesh size affects the calculation accuracy directly. In the global domains, the maximum size in the hot-zone was 0.5 mm. To improve the accuracy of the fluid calculation, a 1 mm layer beneath the seed–solution interface was meshed by rectangular elements of element size of 12.5–500 μm, as shown in Fig. 1c.
The variables hereinafter are listed in Table 1. In the induction heating, an induced eddy current is generated according to Lenz's law; subsequently, parts are heated by that current owing to Joule's effect. The electromagnetic field is defined by Maxwell's equation,
| ∇×H = J | (1) |
| B = ∇×A | (2) |
| E = −jωA | (3) |
| J = σE + jωD. | (4) |
| Variable | Description [unit] | Variable | Description [unit] |
|---|---|---|---|
| ρ | Density [kg m−3] | k | Thermal conductivity [W (m−1 K−1)] |
| ε | Relative permittivity | Cp | Heat capacity [J (kg−1 K−1)] |
| σ | Electrical conductivity [S m−1] | p | Pressure [Pa] |
| D | Diffusion coefficient [m2 s−1] | L | Characteristic length [m] |
| T | Temperature [K] | u | Velocity vector [m s−1] |
| c | Concentration [mol m−3] | N | Flux vector [mol (m−2 s−1)] |
| Re | Reynolds number | μ | Dynamic viscosity [Pa s] |
| ∇· | Divergence operator | ∇ | Gradient operator |
| ∇× | Curl operator | ||
| H | Magnetic field intensity [A m−1] | E | Electric field intensity [V m−1] |
| B | Magnetic flux density [T] | D | Electric flux density [C m−2] |
| A | Magnetic potential vector [V s m−1] | J | Electric current density [A m−2] |
| ω | Angular frequency [rad s−1] | j | Imaginary unit |
| Fext | External force density | Femf | Electromagnetic force density |
| Fgra | Gravity force density | Fbuo | Buoyancy force |
| G | Surface irradiation [W m−2] | Gm | Mutual surface irradiation [W m−2] |
| Famb | Ambient view factor | Tamb | Ambient temperature [K] |
| εs | Surface emissivity | J | Surface radiosity |
The heat transfer via thermal conduction is calculated as follows:
| ρCp·∇T = ∇·(k∇T) + Q. | (5) |
Thermal radiation is a major mechanism of heat transfer, especially at high temperatures, which is described by the following equations:
| G = Gm(J) + FambσTamb4 | (6) |
| (1 − εs)G = J − εσT4 | (7) |
| εs(G − σT4) = −n·(−k∇T). | (8) |
In this study, the Si melt with dissolved C was assumed as an incompressible newtonian fluid with laminar flow, following a previous study.13 From the literature,10,13 we considered four primary convection mechanisms in the model: Buoyancy convection, Marangoni convection, electromagnetic convection, and centrifugal forced convection, by rotating the seed shaft. Therefore, the governing equation of the fluid dynamics is expressed by the following Navier–Stokes equation:
 | (9) |
The Marangoni effect that is caused by surface tension depends on the tangential temperature gradient ∇τT at the free surface of the melt.11,13 Therefore, the viscous force at the free surface is described by the boundary condition −p + τ = γ∇τT, where γ is the temperature derivative of the surface tension. Because of the seed rotation, the boundary condition of the melt velocity at the melt/crystal interface is u = vsφ, where vs is the magnitude of the velocity and φ is a vector indicating the out-of-plane direction of flow. The slip condition was applied on the melt surface: n·u = 0 and τ − (τ·n)n = 0, where n is a vector normal to the boundary. No slip condition was applied to the solution at the solution/crucible interface: u = 0.
The mass transport of C in Si melt is driven by diffusion and convection, as described by ∇·(−D∇c) + u·∇c = 0, and the flux of C is defined by N = −D∇c + u·∇c. The solubility of C in Si C0 is derived from the temperature-dependent C fraction in molten Si xC:
 | (10) |
![[thin space (1/6-em)]](https://www.rsc.org/images/entities/char_2009.gif) 460/T) is obtained from the literature.15,16 The equilibrium condition is supposed to be at the interaction interfaces of melt/graphite and melt/crystal; therefore, a boundary condition C = C0 was applied on the interfaces of melt/crucible and melt/crystal. A no-flux constraint was applied on the melt surface. The material properties used in the simulation are listed in Table 2.
460/T) is obtained from the literature.15,16 The equilibrium condition is supposed to be at the interaction interfaces of melt/graphite and melt/crystal; therefore, a boundary condition C = C0 was applied on the interfaces of melt/crucible and melt/crystal. A no-flux constraint was applied on the melt surface. The material properties used in the simulation are listed in Table 2.
| Properties | Ar | Thermal insulator | Graphite | SiC | Si (melt) | |
|---|---|---|---|---|---|---|
| Heat capacity, Cp | [J (kg−1 K−1)] | 520.33 | 200 | 710 | 1400 | 908.7 |
| Density, ρ | [kg m−3] | 522.21/T | 120 | 1950 | 3160 | 3120.45–0.35T |
| Relative permittivity, εr | 1 | 1 | 1 | 1 | 1 | |
| Relative permeability, μr | 1 | 1 | 1 | 1 | 1 | |
| Electrical conductivity,σ | [S m−1] | 1 | 430 | 75![[thin space (1/6-em)]](https://www.rsc.org/images/entities/char_2009.gif) 400 400 |
225 | 1.2 × 10⁶ |
| Thermal conductivity, k | [W (m−1 K−1)] | 0.07 | 0.336 | 150 | 61 | 63 |
| Surface emissivity, εrad | 0 | 0.8 | 0.9 | — | 0.3 | |
| Dynamic viscosity, μ | [Pa s] | — | — | — | — | 0.8 × 10⁻³ |
| Temperature derivative of the surface tension, γ | [N m−1 K−1] | — | — | — | — | 0.25 × 10⁻³ |
Understanding of mass transport of TSSG
Fig. 2 shows the simulation results of the magnetic flux and the temperature in the reactor when the surface temperature of the melt was 1800 °C. According to Fig. 2a, the highest temperature was 1870 °C at the wall of the outer crucible. As shown in Fig. 2b, the magnetic field was stronger as it approached the coils, while the magnetic field around the inner crucible was weak. Hence, we assumed that the inductive current was strong in the outer crucible and that the inductive heat generated in the outer crucible was the primary heat source in the reactor. The inner crucible was assumed to be heated by heat transfer primarily from the outer crucible. This could explain the higher temperature near the melt/crucible compared to that at the center of the melt.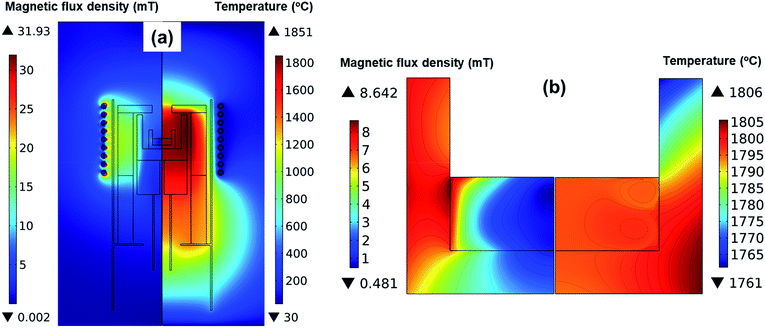 | ||
| Fig. 2 Magnetic flux density and temperature distribution (a) in the entire reactor, and (b) detailed in the crucible and melt. | ||
To verify the simulation model, a melting test with pure Si was performed seed crystal at ∼1700 °C, ∼1800 °C, and ∼1900 °C with the temperature at the melt surface. Table 3 shows the measured temperatures at the melt surface and bottom of the crucible. The errors between the simulation and experiments were estimated from the temperature difference between the two measured temperature points. The temperature differences are in the range of 21–24 °C, and the errors are approximately 1%, indicating a good agreement between simulation and experiment.
| ① Melt surface temperature (°C) | ② Crucible bottom temperature (°C) | Temperature difference (① − ②) (°C) | Error | |||
|---|---|---|---|---|---|---|
| Experimental | Simulation | Experimental | Simulation | Experimental | Simulation | |
| 1695 | 1694.8 | 1674 | 1674.1 | 21 | 20.7 | 1.43% |
| 1776 | 1776.4 | 1754 | 1754.2 | 22 | 22.2 | 1.00% |
| 1889 | 1887.2 | 1865 | 1863.4 | 24 | 23.6 | 1.67% |
To verify the mass transport in the melt, melting experiments with 90% Si–10% Cr was performed without seed crystal at ∼1800 °C, and the melt after cooling was evaluated with cross-sectional images using field emission scanning electron microscopy (FE-SEM). Considering the existence of Cr in the melt, the dynamic viscosity of the melt was adjusted to 1.0 × 10⁻³ Pa s from the relationship of the mixture viscosity, ln![[thin space (1/6-em)]](https://www.rsc.org/images/entities/char_2009.gif) μmix = xi
μmix = xi![[thin space (1/6-em)]](https://www.rsc.org/images/entities/char_2009.gif) ln
ln![[thin space (1/6-em)]](https://www.rsc.org/images/entities/char_2009.gif) μi + xj
μi + xj![[thin space (1/6-em)]](https://www.rsc.org/images/entities/char_2009.gif) ln
ln![[thin space (1/6-em)]](https://www.rsc.org/images/entities/char_2009.gif) μj, where 5.7 × 10⁻³ Pa s for μCr and 0.8 × 10⁻³ Pa s for μSi.
μj, where 5.7 × 10⁻³ Pa s for μCr and 0.8 × 10⁻³ Pa s for μSi.
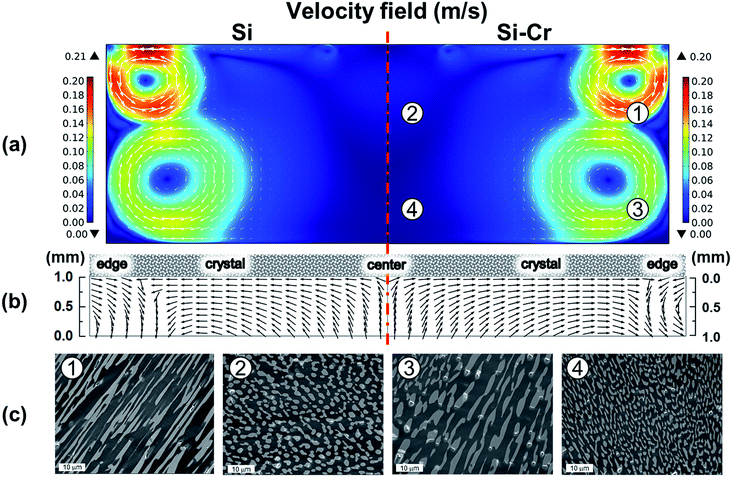
Fig. 3 shows the simulation results obtained from the Si–Cr melt and pure Si melt together with the experimental results of the cross-sectional FE-SEM images for the solidified melt. The bright region and dark region in the FE-SEM images were identified as Cr-rich and Si-rich regions, respectively, by energy dispersive spectroscopy (see ESI†). By adding Cr in the Si melt, the characteristic of the fluid flow could be analyzed from the shape and size of the distinguished Cr-rich precipitates. As shown in Fig. 3c, the shape and size of the precipitates were different depending on the sampling points. While the widely spread precipitates were found in ① and ③, the less spread precipitates were found in ② and ④. The widely spread precipitates and the less spread precipitates were assumed to be the evidence of the rapid fluid flow and the slow fluid flow, respectively. The distribution of the precipitates correlated very well to simulation results showing the flow velocity shown in Fig. 3a. Therefore, the current simulation model used in this study was verified successfully by the melting test with Si–Cr melt.
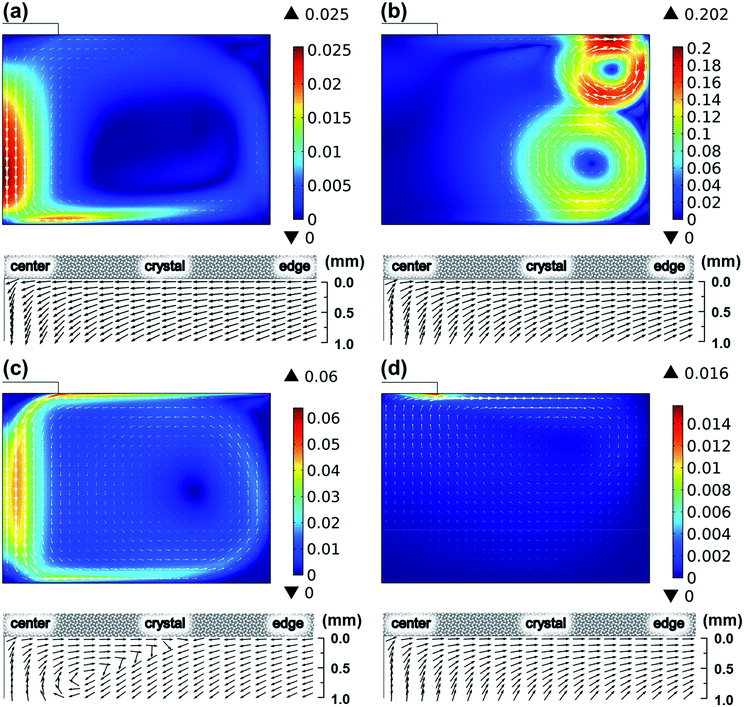
To determine the governing force developing fluid flow, the contribution of convection mechanisms was evaluated, as shown in Fig. 4. Compared to the fluid flow considering all convection mechanisms shown in Fig. 3, the fluid flows shown in Fig. 4 represented the individual flows originated from every convection mechanism by neglecting other convection mechanisms. Fig. 4 shows the global fluid in this study that is determined by electromagnetic convection. The fluid flow driven by electromagnetic convection indicated the maximum flow rate of 0.202 m s−1 at the melt surface near the wall of the crucible, while the maximum flow rates driven by buoyancy convection were only less than 0.025 m s−1. For the Marangoni convection and the centrifugal forced convection, the driven fluid flow reached 0.06 m s−1 and 0.016 m s−1 near the melt surface, respectively. Hence, the global fluid flow was assumed to be determined by electromagnetic convection. However, as reported in our previous study,17–20 the crystal growth is affected significantly by the subsurface flow near the seed crystal. This suggests that the Marangoni convection and centrifugal forced convection had also contributed to the crystal growth together with electromagnetic convection. The normalized velocity field shown in Fig. 4 shows that the fluid flow beneath the crystal is determined by the interaction driven by electromagnetic convection, Marangoni convection, and centrifugal forced convection.
Mass transport control by flow modifier
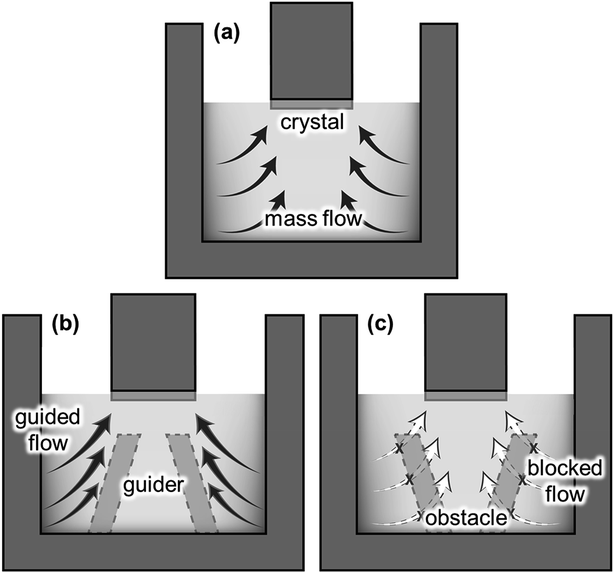
In the previous section, we confirmed that the global fluid flow was governed by the electromagnetic convection that formed strong convection near the crucible wall. Hence, the dissolved C near the crucible wall could be transported to the SiC crystal, as illustrated in Fig. 5a. The structural modification of the reservoir affects the fluid flow significantly, as represented by the “immersion guide”,14 to promote vertical fluidic flow to enhance the growth rate of SiC in the TSSG method. In this study, the fluid flow near the crystal is along the reverse radial direction from the crucible wall to the crystal. Hence, the installation of the FM on the bottom of the crucible is an easy method to control the fluid flow of TSSG, as represented in Fig. 5b and c. If the FM serves as a fluid guide to enhance the mass transport of C, the dissolved C is consumed more efficiently to grow SiC on the crystal. Alternatively, the FM serves as an obstacle to block the mass transport of C to the crystal. In this section, the effect of FM installation is investigated with the verified simulation model.Fig. 6 shows the fluid velocity field, temperature distribution, and carbon concentration distribution in the melt at ∼1800 °C with the melt surface temperature in the cases shown in Fig. 5. In the fluid velocity fields evaluated in the three cases, two primary vortexes appeared near the crucible wall. In all cases, the upper vortexes were always stronger than the lower vortexes, thus suggesting that the upper vortex primarily take responsibility to the mass transport of the melt in the TSSG method. In the case of no-FM, the upper vortex was smaller than the lower vortex, and the two vortexes were connected to each other. The coupling of two vortexes can enhance the uniformity of the temperature and C concentration. In the case of FM-upward, however, two vortexes were separated, such that the dissolved carbon was confined at the corner crucible, so the heat and mass transfer via the lower vortex was minimized. In the case of FM-downward, the upper vortex was large, and two vortexes were connected as in the case of no-FM. Furthermore, the fluid flow was guided along the FM slope and toward the crystal. Therefore, the heat and mass were transported well to the crystal in the following order: FM-downward > no-FM > FM-upward. With the model, FM was confirmed to be effective in enhancing the mass transport of C to the crystal, especially in the case of FM-downward.
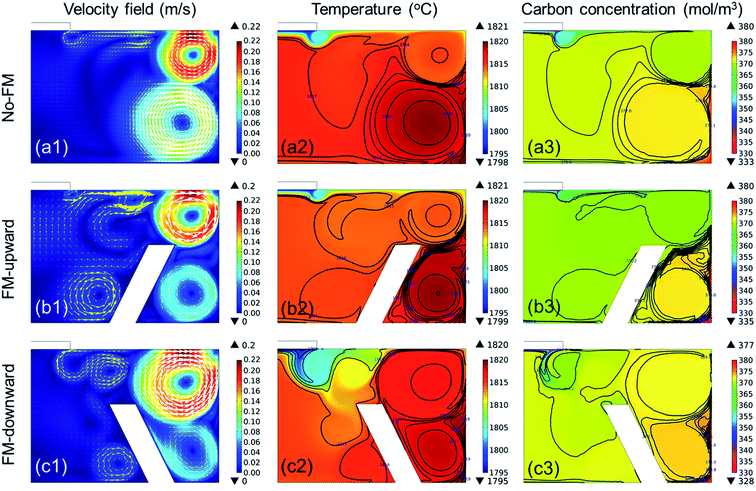 | ||
| Fig. 6 Temperature profile, velocity field, and carbon concentration distribution in the melt with different crucible configurations: no-FM, FM-upward, and FM-downward. | ||
Compared to previous studies13,14 on the flow modification, the fluid flow controlled by FM in this study represents remarkable differences. Mercier et al. proposed several crucible configurations, including a “podium crucible” minimizing the effect of electromagnetic convection and Marangoni convection to the melt flow near the growth front.13 Kusunoki et al. reported the homogeneity of the fluid flow under the seed crystal improved by placing a ring inside the melt, so-called an “immersion guide (IG)”.14 With IG, the upper region of the melt had a relatively higher temperature, C solubility, and C concentration compared to the lower region so that the crystal growth rate increased. In contrary, the “flow modifier (FM)” attached to the bottom of the crucible in this study, acted as a flow guide forming two flow vortexes connected each other which directed the mass transport of C from the crucible wall to the seed crystal. Since FM enables the efficient use of C under uniform temperature gradient by forming the flow guide, the application of FM is advantageous in the long term crystal growth which requires the homogeneous process less dependent on growing time. The application of FM to long-term growth will be studied in our next work.
The crystal growth of SiC by modifying mass transport using the FM was investigated experimentally between ∼1700 and ∼1900 °C. Fig. 7a, b, and c represent the change in growth rate as a function of the melt surface temperature for the cases of no-FM, FM-upward, and FM-downward, respectively. From the Raman spectroscopy shown in Fig. 7d, the grown layers in all conditions were identified as pure 4H-SiC because the Raman peaks demonstrated the characteristic peaks of SiC at ∼776, ∼796, and ∼964 cm−1, respectively. The growth rates increased with temperature. It is noteworthy that the growth rate indicated the highest values for FM-downward at all temperatures and the lowest values for FM-upward, as expected in the simulations. Compared to no-FM, FM-downward increased the growth rate as much as 78.46%, 44.08%, and 18.67% at 1700 °C, 1800 °C, and 1900 °C, respectively, which proved that the proper FM configuration could improve the growth rate in TSSG, especially at low temperatures.
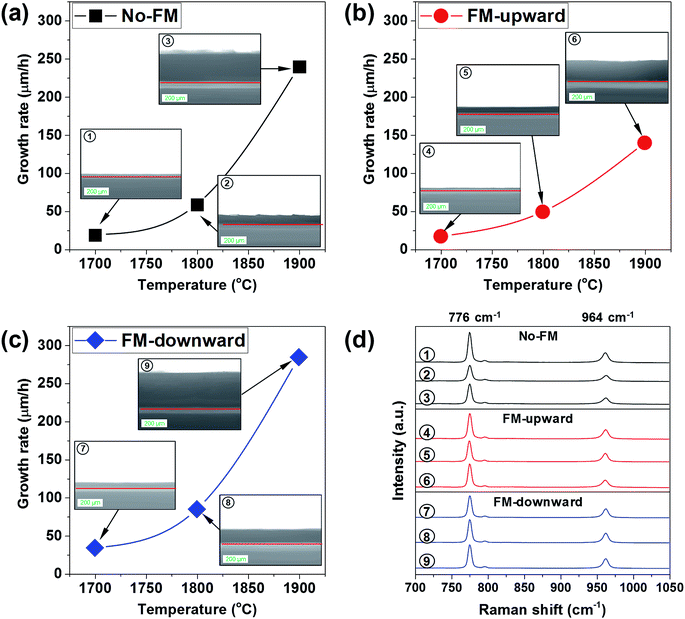 | ||
| Fig. 7 (a–c) Cross-sectional optical images and growth rates of grown crystals at different FM configurations and temperatures, and (d) the micro-Raman spectra of grown crystals. | ||
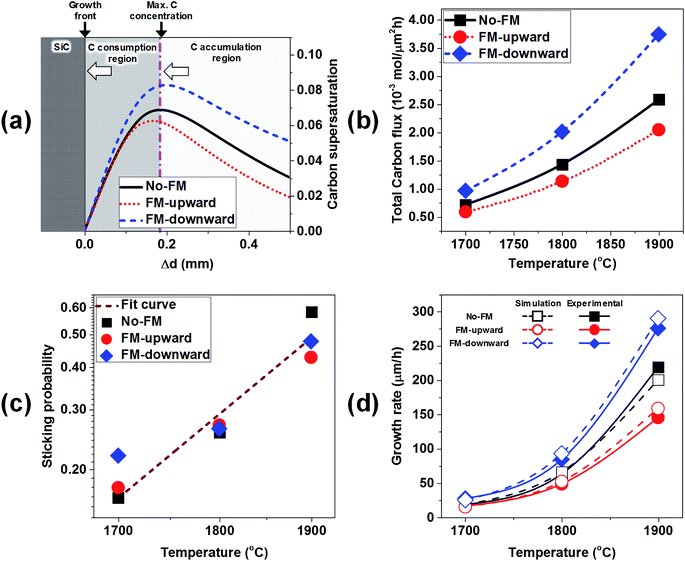
To estimate the growth rate with the simulation model, the C supersaturation and C flux to the crystal were considered. The C supersaturation is defined as S = (c − C0)/C0. Because the growth rate is directly correlated with the C supersaturation near the crystal, the calculated C supersaturation along the distance from the crystal/melt interface was plotted for the cases of no-FM, FM-upward, and FM-downward at ∼1800 °C in Fig. 8a. The C supersaturation indicated maximum values at ∼0.2 mm from the crystal, thus suggesting a mass transport model of accumulation and the consumption of C. As shown in Fig. 8a, the melt with supersaturated C near the crystal can be divided to two regions. In the C accumulation region, the C supersaturation increases as C approaches the crystal by mass transport. In the C consumption region, the C supersaturation decreases as C approaches the crystal because C consumption contributes to the crystal growth. The C accumulation region and C consumption region are divided at the depth with the maximum C concentration, as shown in Fig. 8a. With this model, the C contributing to crystal growth is assumed to be limited to the supersaturated C in the C consumption region.
The C diffusive flux to the seed crystal Jc is derived from Fick's law:
 | (11) |
If the temperature gradient in the consumption region is negligible, the diffusion coefficient D and solubility C0(T) are constant. Subsequently, the C diffusive flux to the crystal is proportional to the C supersaturation gradient (S + 1)/δx, where x is the distance from the growth front. As shown in Fig. 8a, the C supersaturation is the highest for FM-downward, while the C supersaturations for no-FM and FM-upward are in the same order. Therefore, the C diffusive flux for of FM-downward is the highest; therefore, the growth rate in that case is estimated to be the highest among the suggested FM configurations.
However, an abrupt temperature gradient occurred near the crystal owing to the heat transfer to the shaft and melt;20 therefore, the carbon solubility C0(T) is not constant. Furthermore, the convective C flux at the consumption region cannot to be ignored. Hence, to better derive the growth rate, the total C flux normal to the crystal including the diffusive flux and convective flux with temperature gradient near the crystal was calculated numerically, as shown in Fig. 8b. The total C flux normal to the crystal was proportional to the growth temperature, and the highest C flux was obtained for FM-downward, followed by no-FM and FM-upward.
Because the surface reaction in the crystal growth of SiC occurred at high temperatures, the kinetics in the surface reaction at the crystal can be ignored to determine the growth rate.16 Hence, by neglecting the kinetics limitation in the growth reaction, the growth rate of SiC crystal is derived as
 | (12) |
| Rads = PsF, | (13) |
 | (14) |
 | (15) |
Fig. 8d shows the experimental growth rates together with the simulated values obtained with eqn (15) for the cases of no-FM, FM-upward, and FM-downward. Regardless of whether the FM existed, the simulation results indicated good agreement with the experimental results.
From this study, we discovered that the FM affected the growth rate of SiC using TSSG significantly and that the configuration of FM-downward was the best to enhance the growth rate at the given temperature and reactor design.
Conclusion
In this study, we discovered that the electromagnetic convection governed the global melt flow in TSSG of SiC. The other mechanisms, including Marangoni convection, buoyancy convection, and centrifugal forced convection were found to considerably influent on the fluid flow near the crystal. The modification of fluid flow by setting the FM was proved to be very strong to determine the growth rate of SiC. Especially, the FM-downward was found to be an efficient method to get high growth rate by the efficient use of the dissolved C in the melt at the given temperature and reactor design.Author contributions
The manuscript was written through the contributions of all authors. All authors have given approval to the final version of the manuscript.Conflicts of interest
The authors declare no competing financial interest.Acknowledgements
This study was financially supported by the Strategic Core Materials Technology Development program (No. 10062272) funded by the Ministry of Trade, Industry, and Energy (MOTIE), Korea. The authors thank Mr Dae-Seop Byeon (KICET) for his help and fruitful discussion.References
- Y. M. Tairov and V. F. Tsvetkov, Investigation of Growth Processes of Ingots of Silicon Carbide Single Crystals, J. Cryst. Growth, 1978, 43(2), 209–212 CrossRef CAS
.
- A. R. Powell, J. J. Sumakeris, Y. Khlebnikov, M. J. Paisley, R. T. Leonard, E. Deyneka, S. Gangwal, J. Ambati, V. Tsevtkov and J. Seaman, et al., Bulk Growth of Large Area SiC Crystals, Mater. Sci. Forum, 2016, 858, 5–10 Search PubMed
.
- D. H. Hofmann and M. H. Müller, Prospects of the Use of Liquid Phase Techniques for the Growth of Bulk Silicon Carbide Crystals, Mater. Sci. Eng., B, 1999, 61–62, 29–39 CrossRef
.
- K. Kamei, K. Kusunoki, N. Yashiro, N. Okada, K. Moriguchi, H. Daikoku, M. Kado, H. Suzuki, H. Sakamoto and T. Bessho, Crystallinity Evaluation of 4H-SiC Single Crystal Grown by Solution Growth Technique Using Si-Ti-C Solution, Mater. Sci. Forum, 2012, 717–720, 45–48 CAS
.
- K. Kusunoki, K. Kamei, Y. Ueda, S. Naga, Y. Ito, M. Hasebe, T. Ujihara and K. Nakajima, Crystalline Quality Evaluation of 6H-SiC Bulk Crystals Grown from Si-Ti-C Ternary Solution, Mater. Sci. Forum, 2005, 483–485, 13–16 CAS
.
- S. Harada, Y. Yamamoto, K. Seki, A. Horio, M. Tagawa and T. Ujihara, Different Behavior of Threading Edge Dislocation Conversion during the Solution Growth of 4H–SiC Depending on the Burgers Vector, Acta Mater., 2014, 81, 284–290 CrossRef CAS
.
- S. Harada, Y. Yamamoto, K. Seki, A. Horio, T. Mitsuhashi, M. Tagawa and T. Ujihara, Evolution of Threading Screw Dislocation Conversion during Solution Growth of 4H-SiC, APL Mater., 2013, 1(2), 022109 CrossRef
.
- S. Xiao, S. Harada, K. Murayama, M. Tagawa and T. Ujihara, Conversion Behavior of Threading Screw Dislocations on C Face with Different Surface Morphology During 4H-SiC Solution Growth, Cryst. Growth Des., 2016, 16(11), 6436–6439 CrossRef CAS
.
- J. E. Lee, B. G. Kim, J.-Y. Yoon, M.-T. Ha, M.-H. Lee, Y. Kim, W.-S. Seo, H.-J. Choi, W.-J. Lee and S.-M. Jeong, The Role of an SiC Interlayer at a Graphite–Silicon Liquid Interface in the Solution Growth of SiC Crystals, Ceram. Int., 2016, 42(10), 11611–11618 CrossRef CAS
.
- T. Yamamoto, N. Adkar, Y. Okano, T. Ujihara and S. Dost, Numerical Investigation of the Transport Phenomena Occurring in the Growth of SiC by the Induction Heating TSSG Method, J. Cryst. Growth, 2017, 474, 50–54 CrossRef CAS
.
- T. Yamamoto, Y. Okano, T. Ujihara and S. Dost, Global Simulation of the Induction Heating TSSG Process of SiC for the Effects of Marangoni Convection, Free Surface Deformation and Seed Rotation, J. Cryst. Growth, 2017, 470, 75–88 CrossRef CAS
.
- F. Mercier and S. Nishizawa, Solution Growth of SiC from Silicon Melts: Influence of the Alternative Magnetic Field on Fluid Dynamics, J. Cryst. Growth, 2011, 318(1), 385–388 CrossRef CAS
.
- F. Mercier, J.-M. Dedulle, D. Chaussende and M. Pons, Coupled Heat Transfer and Fluid Dynamics Modeling of High-Temperature SiC Solution Growth, J. Cryst. Growth, 2010, 312(2), 155–163 CrossRef CAS
.
- K. Kusunoki, N. Okada, K. Kamei, K. Moriguchi, H. Daikoku, M. Kado, H. Sakamoto, T. Bessho and T. Ujihara, Top-Seeded Solution Growth of Three-Inch-Diameter 4H-SiC Using Convection Control Technique, J. Cryst. Growth, 2014, 395, 68–73 CrossRef CAS
.
- F. Durand and J. C. Duby, Carbon Solubility in Solid and Liquid Silicon—A Review with Reference to Eutectic Equilibrium, J. Phase Equilib., 1999, 20(1), 61–63 CrossRef CAS
.
- J. Lefebure, J.-M. Dedulle, T. Ouisse and D. Chaussende, Modeling of the Growth Rate during Top Seeded Solution Growth of SiC Using Pure Silicon as a Solvent, Cryst. Growth Des., 2012, 12(2), 909–913 CrossRef CAS
.
- K. Ariyawong, Y. J. Shin, J.-M. Dedulle and D. Chaussende, Analysis of Macrostep Formation during Top Seeded Solution Growth of 4H-SiC, Cryst. Growth Des., 2016, 16(6), 3231–3236 CrossRef CAS
.
- H. Daikoku, M. Kado, A. Seki, K. Sato, T. Bessho, K. Kusunoki, H. Kaidou, Y. Kishida, K. Moriguchi and K. Kamei, Solution Growth on Concave Surface of 4H-SiC Crystal, Cryst. Growth Des., 2016, 16(3), 1256–1260 CrossRef CAS
.
- C. Zhu, S. Harada, K. Seki, H. Zhang, H. Niinomi, M. Tagawa and T. Ujihara, Influence of Solution Flow on Step Bunching in Solution Growth of SiC Crystals, Cryst. Growth Des., 2013, 13(8), 3691–3696 CrossRef CAS
.
- M.-T. Ha, Y.-J. Shin, M.-H. Lee, C.-J. Kim and S.-M. Jeong, Effects of the Temperature Gradient Near the Crystal-Melt Interface in Top Seeded Solution Growth of SiC Crystal, Phys. Status Solidi A, 2018, 215(20), 1701017 CrossRef
.
- M. Nasir Khan, S. Nishizawa, W. Bahng and K. Arai, Liquid-Phase Epitaxy on 6H-SiC Acheson Seed Crystals in Closed Vessel, J. Cryst. Growth, 2000, 220(1–2), 75–81 CrossRef CAS
.
Footnote |
| † Electronic supplementary information (ESI) available: FE-SEM image and EDS element mappings of a cross-sectioned solidified melt of 90% Si–10% Cr. See DOI: 10.1039/c9ra04930d |
| This journal is © The Royal Society of Chemistry 2019 |

