 Open Access Article
Aqueous carbofuran removal using slow pyrolyzed sugarcane bagasse biochar: equilibrium and fixed-bed studies†
Vineet Vimal,
Manvendra Patel and
Dinesh Mohan
 *
*
School of Environmental Sciences, Jawaharlal Nehru University, New Delhi 110067, India. E-mail: dm_1967@hotmail.com; Fax: +91-11-26704616; Tel: +91-11-26704616
First published on 23rd August 2019
Abstract
Herein, biochar was produced by the slow pyrolysis of sugarcane bagasse at 500 °C in absence of oxygen. The resulting sugarcane bagasse biochar (SB500) was characterized and used for aqueous carbofuran sorptive removal. Batch carbofuran sorption studies were accomplished to ascertain the influence of solution pH, contact time, temperature (25, 35 and 45 °C) and adsorbate/adsorbent concentration. SB500 adsorbed more carbofuran at low pH values and less carbofuran at high pH values. The necessary sorption equilibrium, kinetic and thermodynamic parameters were determined. The equilibrium isotherm data were fitted to the Freundlich, Langmuir and Temkin models. The Langmuir equation best fitted the experimental sorption data. The maximum Langmuir adsorption capacity of 18.9 mg g−1 was obtained at pH 6.0 and 45 °C. The enthalpy change (ΔH°), entropy change (ΔS°) and Gibbs free energy (ΔG°) were evaluated. The fixed-bed carbofuran sorption studies were carried out using the optimum parameters determined via the batch studies. The necessary fixed-bed design parameters were obtained. Carbofuran desorption and SB500 regeneration were successfully achieved. About 96% of the total carbofuran was successfully desorbed from the exhausted biochar using 20 mL ethanol in 10 mL increments. Moreover, a possible carbofuran adsorption mechanism has been proposed. A number of interactions including (1) hydrogen bonding of the protonated and neutral carbofuran to biochar, (2) carbofuran sorption onto biochar via π–π electron donor–acceptor interactions and (3) carbofuran diffusion into the biochar pores were considered to explain the sorption mechanism. The batch and fixed-bed sorption results demonstrate that the sugarcane bagasse biochar (SB500) can be effectively used for the sustainable removal and recovery of carbofuran from water.
1. Introduction
Water is of prime importance for the sustenance of life on Earth and most exploited among all the available natural resources.1 Water quality deterioration results in its limited use by human beings and other organisms.2 Any adverse change in the biological, chemical, and physical properties of water results in harmful effects on human health and other living beings.3 Pesticides are considered to be toxic water contaminants. Their large scale use for agricultural as well as non-agricultural purposes has resulted in their outreach to different environmental matrices.4 Pesticides are used for killing specific target organisms; however they also affect the non-target organisms including soil microorganisms, birds and human beings. Moreover, pesticides may cause cancer, chronic kidney disease, sterility in male and females, genotoxicity, reproductive, physiological, neurological, behavioral and endocrine disorders.5,6 Carbofuran (2,3-dihydro-2,2-dimethylbenzofuranyl-7-N-methylcarbamate; trade name furadan) is an organic pesticide.7 It is used as a broad spectrum insecticide, acaricide and nematicide.8–13 The maximum contamination level goal (MCLG) of carbofuran in drinking water is 0.04 mg L−1.14 However, carbofuran is now being used quite often as it has low persistence as compared to organochlorines (OC) and is less toxic than neurotoxic organophosphates (OP).15 The EC50 value of carbofuran as determined using the microtox bioassay of V. fischeri is 20.5 mg L−1.16 Carbofuran is highly toxic to bees, birds, and fish17 and can kill fishes, wildlife and invertebrates.17 Moreover, carbofuran causes sensory system overstimulation by hindering acetyl-cholinesterase.17 Overexposure to carbofuran results in abdominal cramping, blurred vision, coma, convulsions, headache, nausea, tremors, and weakness.17Photolysis,18–21 ozonation,22,23 UV-irradiation,24 advanced oxidation,22 nanofiltration and osmosis25 and adsorption26–29 are currently used for aqueous carbofuran removal. Activated carbon sorption in water is the most frequently employed method as compared to other methods;30,31 however, the use of activated carbon is not very cost effective; thus, there is an urgent requirement to find low-cost, sustainable and effective adsorbents for the removal of carbofuran at varying concentrations from water. The application of biochar in the removal of inorganic and organic contaminants is gaining attention.32,33 Biochar provides a sustainable option as it possesses the characteristics, including high surface area and adsorbate recovery and regeneration of the exhausted biochar, of activated carbon.34 Fast pyrolyzed35 biochar, a by-product obtained during bio-oil production, has also been used for contaminant removal.36 Slow and fast pyrolyzed biochars have been used to remediate arsenic,36 fluoride,37,38 aniline and nitrobenzene,39 nitrates,38 lead,40,41 cadmium,40 pesticides,42,43 nickel,44 pharmaceuticals,43,45,46 and phenols.47 Other slow and fast pyrolyzed biochars used for organic and inorganic contaminants have also been reviewed.32 Biochars obtained from rice husks27 and tea waste28 have been successfully applied for aqueous carbofuran removal. These studies were conducted in an acidic medium in the batch mode. The fixed-bed studies are essential for scaling up the process. Thus, both the batch and the fixed-bed studies have been undertaken in the present investigation.
In India, the current biomass availability is ∼500 million metric tons per year.48,49 India is the second largest producer of sugarcane (Saccharum officinarum) in the world after Brazil. During 2015–2016, India produced 348 million tonnes of sugarcane.50 Furthermore, the residue production percentage of the sugarcane crop is 33%.51 Thus, the total bagasse production in 2015–16 was ∼115 million tonnes. Bagasse is commonly used as a boiler fuel and also in paper manufacturing. Thus, herein, sugarcane bagasse-derived biochar (SB500) was obtained and successfully used as a sustainable environmental approach for the sorptive removal of carbofuran.
2. Materials and methods
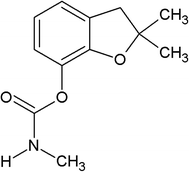
Carbofuran (C12H15NO3) of 98% purity was obtained from Sigma-Aldrich, India (Fig. 1).2.1 Sugarcane bagasse biochar (SB500) development
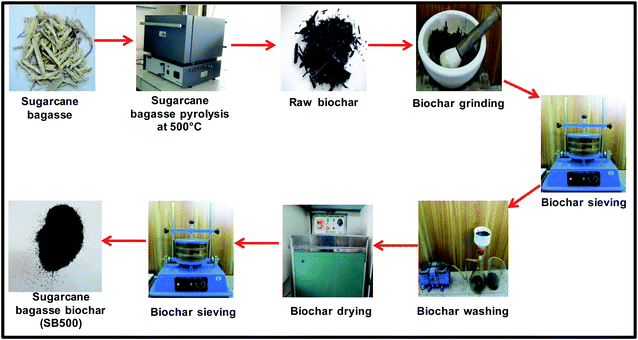
Sugarcane bagasse was collected from Bhikhanpur village (28°44.828′ N and 77°27.656′ E with 698 ft elevation), Ghaziabad, Uttar Pradesh, India. It was cut into small pieces and sun dried for a week. It was then slow pyrolyzed at different temperatures. The biochar obtained at temperatures higher or lower than 500 °C was not very effective for carbofuran removal as compared to biochar obtained at 500 °C. Thus, dried sugarcane bagasse was pyrolyzed in the absence of oxygen at 500 °C at 10 °C min−1 heating rate and 30 min dwell time in a muffle furnace (Thermolyne model 33900-45). The developed biochar was used for carbofuran sorption. The development process of sugarcane bagasse biochar (SB500) is summarized in Fig. 2.2.2 Characterization
![[thin space (1/6-em)]](https://www.rsc.org/images/entities/char_2009.gif) 000 kV mA−1). A small quantity of SB500 was rested on a double sided carbon tape placed on an aluminum stub. A thin layer of gold nanoparticles was coated on the SB500 sample surface to make it conductive. The sample surface was examined at different magnifications.
000 kV mA−1). A small quantity of SB500 was rested on a double sided carbon tape placed on an aluminum stub. A thin layer of gold nanoparticles was coated on the SB500 sample surface to make it conductive. The sample surface was examined at different magnifications.2.3 Sorption studies
| qe = [(Co–Ce) × V]/M | (1) |
2.3.1.1 Thermodynamic parameters
The Gibbs free energy change (ΔG°), enthalpy change (ΔH°) and entropy change (ΔS°) were evaluated to examine the carbofuran adsorption process. ΔG°, ΔH° and ΔS° were calculated using eqn (2) and (3).52
ΔG° = −RT![[thin space (1/6-em)]](https://www.rsc.org/images/entities/char_2009.gif) ln ln![[thin space (1/6-em)]](https://www.rsc.org/images/entities/char_2009.gif) K K
| (2) |
 | (3) |
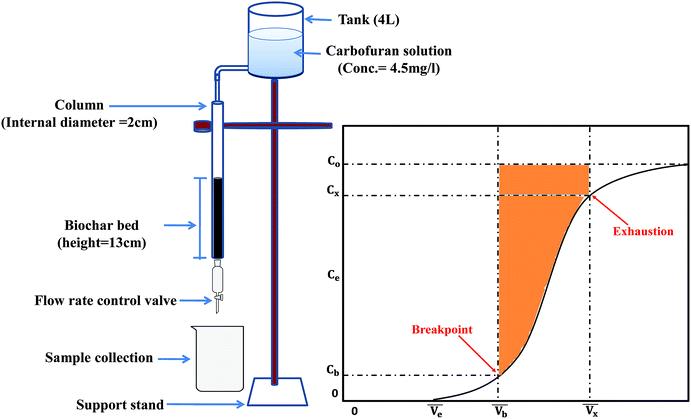 | ||
| Fig. 3 Sugarcane bagasse biochar (SB500) fixed-bed setup.47,54 | ||
The concentration of the aqueous adsorbate changes as a function of time. In an ideal breakthrough curve, the effluent concentration of carbofuran (Cf) passing through the sugarcane bagasse biochar (SB500) fixed bed is almost zero or negligible at the beginning of the operation. However, in real practice, the effluent concentration (Cf) is not always zero.47 Thus, in the ideal breakthrough curve, the carbofuran effluent concentration (Cf) and the total treated water quantity  crossing per unit cross sectional area very much depend on (i) the total effluent quantity per unit cross sectional area at the breakpoint
  and (b) the nature of the breakthrough curve obtained between
  and
and  (Fig. 3). Cx and Cb are the effluent concentrations corresponding to
  , and
, and  . The fixed zone length (δ) is a part of the bed when the carbofuran concentration is decreased from Cx to Cb.54
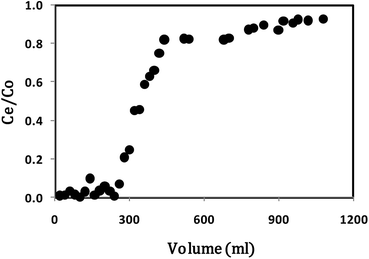
The breakthrough point was obtained after percolating 260 mL carbofuran solution (260 minutes after the column run started at the 1 mL min−1 flow rate). Similarly, the exhaustion point was obtained after percolating 1080 mL of carbofuran solution (1080 minutes after the column run started at 1 mL min−1 flow rate).
The primary adsorption zone (PAZ) establishment time (tx), PAZ downward movement time required to travel its own length in the fixed-bed (tδ), carbon bed depth (D) and time ratio  fractional capacity (f), PAZ length (δ), bed volume, percent saturation, empty bed contact time (EBCT), and biochar utilization rate were calculated using eqn (4)–(9),47,54
 | (4) |
 | (5) |
 | (6) |
 | (7) |
 | (8) |
 | (9) |
The biochar adsorption capacity was calculated by taking the total area between the influent and effluent to the breakthrough point divided by the biochar dose utilized in the fixed-bed development. Similarly, the column capacity was calculated by determining the total area to the point where the effluent plot meets the effluent, divided by the amount of biochar used in the study.47,54
The Empty Bed Contact Time (EBCT) model was used to determine the empty bed contact time (EBCT) and biochar usage.47,54 EBCT is the ratio of the empty bed volume to the flow rate. It is described as the total time when the carbofuran influent is in contact with the biochar bed in the column.47,54 The EBCT was calculated by using the eqn (10),
 | (10) |
 | (11) |
EBCT was determined using the bed depth (eqn (12)).
 | (12) |
The biochar usage rate was calculated using eqn (13).47,54
 | (13) |
3. Results and discussion
3.1 Biochar characterization
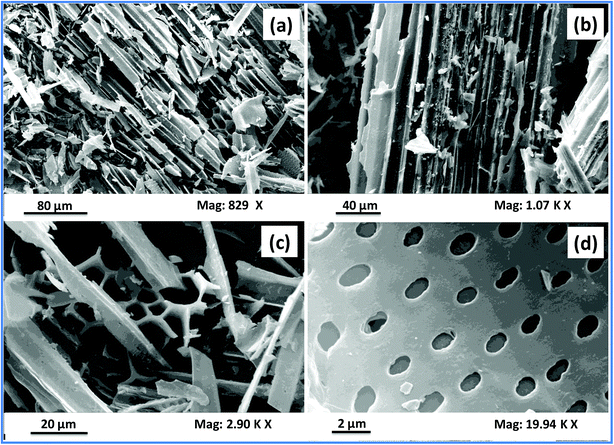
The surface morphology of a material is best described by investigating the SEM images of the material obtained at different magnifications. These images depict the shape and size of the pores and grooves present on the biochar surface. The SEM images of sugarcane bagasse biochar (SB500) are shown in Fig. 4(a–d). These images show an irregular amorphous surface with porous structures. The images [Fig. 4(a and b)] clearly show fibrous structures as well as some polygonal structures [Fig. 4(c)]. These structures may have originated due to the melting and fusion process of lignin and other small molecules including pectin and inorganic compounds. Similar observations have been reported for sugar cane straw- and pine wood-derived biochars.55,56 The surface area (SBET), pore volume and average pore width are 148.23 m2 g−1, 0.048 m3 g−1 and 2.11 nm, respectively. Biochar is quite stable in both acidic and basic solutions. The ultimate and proximate analysis results of the SB500 biochar are presented in Table 1.| Properties | Values |
|---|---|
| pH | 6.82 |
| pHpzc | 5.9 |
| Electrical conductivity (μS cm−1) | 33.3 |
| Ash content (%) | 4.7 |
| Moisture content (%) | 5.7 |
| Percentage yield | 25 |
| Carbon (%) | 74.9 |
| Hydrogen (%) | 2.3 |
| Oxygen (%) | 5.3 |
| Molar H/C | 0.37 |
| Molar O/C | 0.05 |
| BET surface area (m2 g−1) | 148.23 |
| Pore volume (cm3 g−1) | 0.048 |
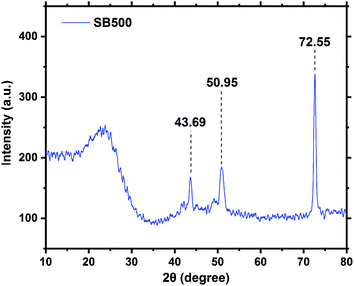
Powder XRD is an important characterization tool that usually provides vital information about the mineralogy and crystal structure of a material.57,58 The XRD pattern of SB500 is shown in Fig. 5. The SB500 diffractogram is characterized by three sharp peaks obtained at 43.69° (d = 2.071), 50.95° (d = 1.792 Å), and 72.55° (d = 1.301 Å). The peaks at 43.69° and 50.95° are attributed to calcite, whereas the peak at 72.55° is due to silica.59
FTIR also plays an important role in the identification of various aliphatic, olefinic and aromatic functional groups including alcohols, organic acids, lactones, phenolic compounds, olefins, ketones, and quinones.60 The FTIR spectra of unloaded and carbofuran-loaded SB500 were obtained in the range of 500–4000 cm−1 (Fig. 6). Carbofuran-loaded and unloaded SB500 spectra display various oxygen-containing (C![[double bond, length as m-dash]](https://www.rsc.org/images/entities/char_e001.gif) O, C–O, and –OH) and other (C–H and C
O, C–O, and –OH) and other (C–H and C![[double bond, length as m-dash]](https://www.rsc.org/images/entities/char_e001.gif) C) surface groups. Unloaded SB500 exhibited peaks at 1419.60 and 1458.75 cm−1, corresponding to aromatic ring modes,61 1558.54 cm−1 for alkene (C
C) surface groups. Unloaded SB500 exhibited peaks at 1419.60 and 1458.75 cm−1, corresponding to aromatic ring modes,61 1558.54 cm−1 for alkene (C![[double bond, length as m-dash]](https://www.rsc.org/images/entities/char_e001.gif) C) stretching,62 1772.57 cm−1 for C
C) stretching,62 1772.57 cm−1 for C![[double bond, length as m-dash]](https://www.rsc.org/images/entities/char_e001.gif) O stretching bands,63 2360.86 cm−1 due to carbon dioxide,64,65 2897.07 cm−1 for aliphatic C–H bond stretching,66–68 and 3651.39 cm−1 for non-H-bonded hydroxyl and phenolic O–H stretching (Fig. 6).69–71 After carbofuran adsorption, few new peaks appeared at 815.88, 1600.91, 1701.21, and 3649.31 cm−1. The peak at 815.88 cm−1 corresponds to the out-of-plane C–H deformation of aromatic ring.72,73 The peak at 1600.91 cm−1 corresponds to the C
O stretching bands,63 2360.86 cm−1 due to carbon dioxide,64,65 2897.07 cm−1 for aliphatic C–H bond stretching,66–68 and 3651.39 cm−1 for non-H-bonded hydroxyl and phenolic O–H stretching (Fig. 6).69–71 After carbofuran adsorption, few new peaks appeared at 815.88, 1600.91, 1701.21, and 3649.31 cm−1. The peak at 815.88 cm−1 corresponds to the out-of-plane C–H deformation of aromatic ring.72,73 The peak at 1600.91 cm−1 corresponds to the C![[double bond, length as m-dash]](https://www.rsc.org/images/entities/char_e001.gif) C bond in the ring structure.62 The peak at 1701.21 cm−1 could be due to the the amide C
C bond in the ring structure.62 The peak at 1701.21 cm−1 could be due to the the amide C![[double bond, length as m-dash]](https://www.rsc.org/images/entities/char_e001.gif) O stretching mode present in the carbofuran molecule (Fig. 6).62 The reason for the tiny shift in the hydroxyl bond peak from 3651.39 to 3649.31 cm−1 is possibly due to the carbofuran bonding on the SB500 surface.
O stretching mode present in the carbofuran molecule (Fig. 6).62 The reason for the tiny shift in the hydroxyl bond peak from 3651.39 to 3649.31 cm−1 is possibly due to the carbofuran bonding on the SB500 surface.
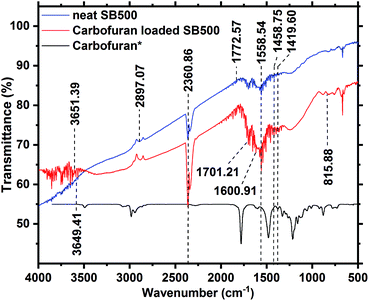 | ||
| Fig. 6 FTIR spectra of SB500 before and after carbofuran adsorption (carbofuran IR data adopted with permission from NIST Library53). | ||
3.2 Effect of pH on carbofuran removal and sorption mechanism
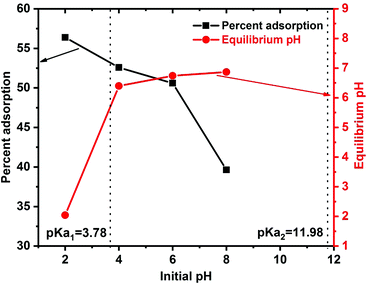
The surface functional groups on an adsorbent affect the overall adsorption process. These functional groups determine biochar's surface charge characteristics and provide various biochar–carbofuran interactions.74 The point of zero charge (pHpzc) measured for SB500 is 5.99 (Table 1). Thus, the biochar's surface is net negatively charged at pH > pHpzc and positively charged at pH < pHpzc. The solution pH also affects the speciation of carbofuran in the solution by protonation or deprotonation. The acid dissociation constant pKa1 of the protonated carbofuran is close to 3.78; thus, at acidic pH values < 3.78, protonated carbofuran is the predominant form. At a solution pH > 3.78 (pH > pKa1), the unprotonated (neutral) carbofuran dominates (Scheme 1).The carbofuran adsorption versus solution pH is shown in Fig. 7. Carbofuran removal decreased slightly from 56% to 51% with an increase in the initial solution pH from 2 to 6. This suggests that both the protonated and the neutral carbofuran forms can be adsorbed. In a strongly acidic medium, protonation occurs at the carbonyl oxygen of carbofuran's urethane functional group, generating a cationic species. This cation experiences both H-bonding interactions with the surface oxygen sites that are neutral and repulsive electrostatic forces from the biochar's net positive surface charge at pH values below the biochar's zero-point charge (∼6.0). Neutral carbofuran experiences H-bonding from pH 2 to 6. A further increase in the solution pH from 6.0 to 8.0 caused the carbofuran removal to decrease from 51% to 40% (Fig. 7). The equilibrium pH also increased with an increase in the solution pH except at pH 2. This decrease in the carbofuran removal from pH 6 to 8 might be related to the loss of acidic surface –OH groups as the surface is increasingly deprotonated above its pHZPC. Neutral carbofuran is a better H-bond acceptor rather than a H-bond donor. As the stronger surface H-bond donor sites (more acid –OH groups) are deprotonated, the net H-bonding perhaps becomes less attractive for carbofuran. The protonated carbofuran acts as a strong H-bond donor and H-bond acceptor and has two H-bond donor sites: the proton on its carbonyl carbon and the proton on nitrogen. The latter becomes a stronger H-bond donor due to resonance, causing an increased positive charge at nitrogen. The ether oxygen in the five-membered ring is still a H-bond acceptor. Thus, H-bonding contributes to the adsorption of protonated carbofuran even at pH < pHZPC where the surface has a net positive charge.
The deprotonation of carbofuran does not play a role in adsorption in the pH 2–9 range. Carbofuran is a very weak base, as indicated by its pKa2 value of 11.96 (Scheme 1). Even at pH 9.0, very little deprotonated carbofuran exists in the solution to play a role, and the biochar surface is now more negatively charged.
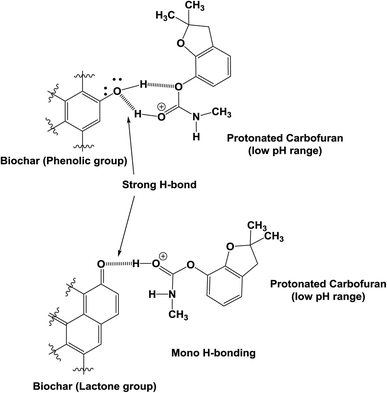
Both the physical and the chemical sorption mechanisms are possible between carbofuran and biochar.27 The oxygen-containing functional groups present on the biochar surface are evident in the FTIR spectrum of the starting biochar (Fig. 6). These oxygen-containing functional groups, such as phenolic, hydroxyl, ether, quinoid, lactone and possibly some carboxylic acid oxygens, of biochar can form H-bonds with carbofuran. A few sample representations of the H-bonding of the protonated and neutral carbofuran with biochar at different pH values are provided in Scheme 2.
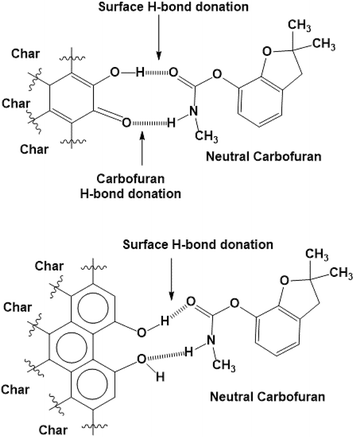
The surface –OH groups on biochar act as H-donors to carbofuran, as shown in Scheme 3. Moreover, the H-bond donation by the carbofuran N–H group to the biochar oxygen functionalities is shown.
However, at high pH, both the ionizable –OH functional groups of biochar are deprotonated and negatively charged. As pH increases, –OH groups present on biochar's surface deprotonate, forming sites that the –NH functional group of carbofuran can form H-bonds more strongly (Scheme 4).
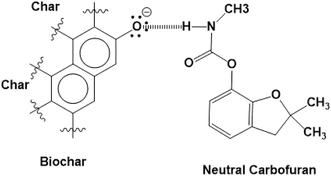 | ||
| Scheme 4 At high pH, –OH groups present on biochar's surface deprotonate, forming sites to which the –NH functional group of carbofuran can form H-bonds. | ||
Carbofuran sorption onto biochar through π–π electron donor–acceptor interactions can occur.28,29 Such π–π electron donor–acceptor interactions are well known for the sorption of organic contaminants onto carbonaceous activated carbons and biochars. In the acidic medium, the protonated carbofuran can interact with the electron rich regions of graphene-like surfaces of SB500, giving rise to strong π–π electron donor–acceptor interactions, as shown in Scheme 5, where the protonated carbofuran is the π-electron acceptor.29 Similar results were reported for carbofuran adsorption on activated carbon,30,75 and fertilizer and steel industry wastes.76 Moreover, similar trends were reported for atrazine and simazine removal using biochar.77
Carbofuran diffusion into the biochar pores also contributes to its sorption.29 The high BET surface area of SB500 due to the micro-, meso-, and macro-pores can greatly assist in carbofuran adsorption. Carbofuran easily diffuses into the biochar pores (Scheme 6). Thus, both physisorption and chemisorption interactions are possible during carbofuran sorption.
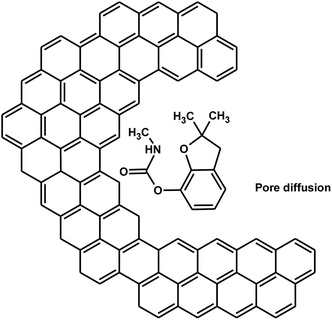 | ||
| Scheme 6 Carbofuran diffusion into biochar pores [benzene rings on the left side show the biochar's aromatic structure]. | ||
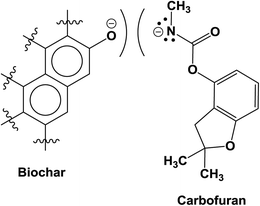
At strongly basic pH, both the surface groups of biochar are negative and carbofuran's N–H is removed to give an anion at the second pKa (pKa2 = 11.97), and only repulsions exist (Scheme 7).
3.3 Carbofuran removal kinetics
Carbofuran sorption kinetics was studied to determine the effect of equilibrium time on carbofuran removal at different adsorbate and adsorbent concentrations.Carbofuran adsorption dynamic data were modeled to the pseudo-first-order78 (eqn (SM1)†) and pseudo-second order79 (eqn (SM2)†) rate equations.
The first order rate equation did not fit to the sorption kinetic data (Tables SM1 and SM2†). The second order rate equation fit the data very well. The second order linear plots (t/qt versus t) are shown in Fig. SM3 and SM4.† The kinetic parameters and correlation coefficients R2 obtained from the second order rate plots at different adsorbent and adsorbate concentrations are given in Tables SM1 and SM2 (ESI†). Furthermore, the experimental qe values and the qe values obtained from the pseudo second order equation are in close agreement. Similar results were reported for 2,4-D and carbofuran adsorption on different adsorbents.76
3.4 Equilibrium sorption studies
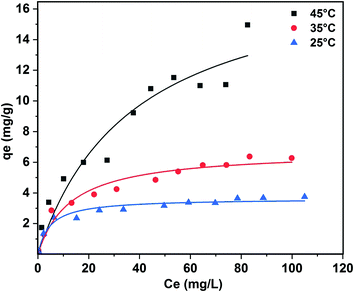
Equilibrium studies were carried out at 25, 35, and 45 °C in order to determine the temperature effect on carbofuran adsorption (Fig. SM5†). All the isotherms were concave and regular to the equilibrium concentration axis. Carbofuran removal increased with a decrease in the temperature. The carbofuran sorption equilibrium data were fitted to the non-linear Freundlich (eqn (SM3); Fig. SM6†), Langmuir (eqn (SM4);† Fig. 8), and Temkin (eqn (SM5); Fig. SM7†) equations. These models provide information on the adsorption capacity of biochar for carbofuran. The model parameters may also be useful in fixed-bed adsorber design.Freundlich, Langmuir, and Temkin isotherm parameters along with their correlation coefficients obtained for carbofuran adsorption on SB500 at 25, 35, and 45 °C are summarized in Table 2. The sorption data fit well to all the three models. Out of the three, Langmuir isotherm model best fitted to the data (R2 = ∼1.0) at 25, 35, and 45 °C. The better fitting of the Langmuir isotherm equation demonstrates the formation of a carbofuran monolayer on the SB500 surface. Similar results were reported for carbofuran adsorption on different adsorbents.74,76 The 1/n values obtained from the Freundlich equation range between 0 and 1, showing the increased heterogeneity in the sorption process with the increase in temperature. More is the heterogeneity of the surface, the closer are the 1/n values to zero.80,81
| Isotherm parameters | 25 °C | 35 °C | 45 °C |
|---|---|---|---|
| Freundlich isotherm | |||
| KF (mg g−1) | 1.150 | 1.240 | 1.350 |
| 1/n | 0.262 | 0.363 | 0.522 |
| R2 | 0.933 | 0.974 | 0.955 |
![[thin space (1/6-em)]](https://www.rsc.org/images/entities/char_2009.gif) |
|||
| Langmuir isotherm | |||
| Q0 (mg g−1) | 3.636 | 6.782 | 18.91 |
| B | 0.214 | 0.078 | 0.027 |
| R2 | 0.951 | 0.958 | 0.935 |
![[thin space (1/6-em)]](https://www.rsc.org/images/entities/char_2009.gif) |
|||
| Temkin isotherm | |||
| bTe (kJ mol−1) | 1801.48 | 1008.99 | 484.46 |
| aTe (L mg−1) | 4.769 | 2.287 | 1.512 |
| R2 | 0.980 | 0.955 | 0.853 |
3.5 Thermodynamic parameters
Thermodynamic parameters (ΔH°, ΔS°, and ΔG°) for carbofuran adsorption on SB500 were calculated using eqn (2) and (3) (Table 3). The negative ΔG° values show the carbofuran adsorption feasibility and spontaneous nature. Enthalpy change (ΔH°) and entropy change (ΔS°) were calculated from the slope and intercept, respectively, of the van't Hoff plots (ln![[thin space (1/6-em)]](https://www.rsc.org/images/entities/char_2009.gif) K versus 1/T). The positive ΔH° values indicate that carbofuran uptake on SB500 is endothermic. The positive ΔS° values show the carbofuran affinity towards SB500 and an increase in the randomness at the solid–liquid interface during carbofuran uptake. The positive ΔH° values were also recorded for carbofuran adsorption on banana stalks-activated carbon74 and for 2,4-D adsorption on date seeds-activated carbon.82
K versus 1/T). The positive ΔH° values indicate that carbofuran uptake on SB500 is endothermic. The positive ΔS° values show the carbofuran affinity towards SB500 and an increase in the randomness at the solid–liquid interface during carbofuran uptake. The positive ΔH° values were also recorded for carbofuran adsorption on banana stalks-activated carbon74 and for 2,4-D adsorption on date seeds-activated carbon.82
| −ΔG° (kJ mol−1) | ΔH° (kJ mol−1) | ΔS° (kJ mol−1 K−1) | ||
|---|---|---|---|---|
| 25 °C | 35 °C | 45 °C | ||
| 3.82 | 6.53 | 9.65 | 77.02 | 0.29 |
3.6 Fixed-bed adsorber design
The batch studies provide information about the adsorbent effectiveness in terms of maximum uptake per unit of sorbent, pH, and adsorbent particle size.83 The parameters derived from the batch studies are helpful in designing a fixed-bed that is more practical and applicable in establishing an adsorption process. The breakthrough curve expressed in terms of C/Co versus carbofuran volume passed through the column is shown in Fig. 9. The fixed-bed design parameters were calculated using eqn (4)–(13). These parameters are given in Table 4.| Parameters | Values |
|---|---|
| Co (mg mL−1) | 0.0046 |
| Cx (mg mL−1) | 0.0427 |
| Cb (mg mL−1) | 0.0028 |
| Vx (mg cm−2) | 0.3809 |
| Vb (mg cm−2) | 58.7465 |
| Fm (mg cm−2 min−1) | 0.054 |
| D (cm) | 13 |
| tx (min) | 1080 |
| tδ (min) | 1073 |
| tb (min) | 280 |
| F | 0.7390 |
| δ (cm) | 9.6296 |
| Percent saturation | 80.67 |
| Biochar usage rate (kg L−1) | 21.4286 |
| EBCT (min) | 40.82 |
| Breakthrough capacity (mg g−1) | 0.188 |
| Column capacity (mg g−1) | 0.30 |
Based on the fixed-bed design parameters obtained from this column run, it can be concluded that biochar requires a slow flow rate to ensure long residence or contact time. The use of more than one column in series can lead to better results.
3.7 Desorption studies
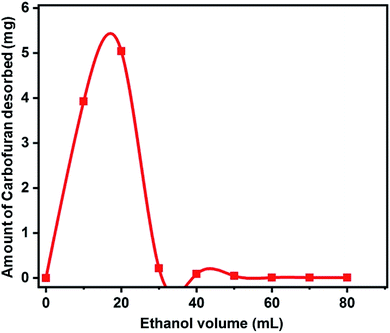
Desorption studies were carried out to recover carbofuran with simultaneous regeneration of the exhausted biochar. Ethanol was used as an eluent in 10 mL increments for carbofuran desorption. Almost 96% of total carbofuran was desorbed using 20 mL ethanol (Fig. 10).3.8 Comparative evaluation of the developed biochar vis-à-vis other adsorbents
Different adsorbents including agricultural by-products, industrial wastes, activated carbons (ACs), and biochars have been used for carbofuran removal (Table 5). In general, activated carbons show higher removal capacities compared to biochars and adsorbents. This may be due to the high surface area of the activated carbons. Furthermore, the sugarcane bagasse biochar shows comparable performance compared to other biochars applied for carbofuran removal (Table 5). The removal capacity per unit surface area of SB500 is also comparable to many adsorbents including activated carbons (Table 5).| Adsorbents | Temp (°C) | Conc. range (mg L−1) | Adsorption capacity (mg g−1) | Surface area (m2 g−1) | Adsorption capacity per surface area | Ref. |
|---|---|---|---|---|---|---|
| Sugarcane bagasse biochar (SB500) | 25 | 1–100 | 3.7 | 148 | 0.02 | This study |
| 35 | 6.8 | 0.04 | ||||
| 45 | 18.9 | 0.13 | ||||
| Rice husk biochar (RHBC300) | 30 | 5–100 | 30.73 | 69 | 0.45 | 27 |
| Rice husk biochar (RHBC500) | 30 | 48.75 | 170 | 0.29 | ||
| Rice husk biochar (RHBC700) | 30 | 132.87 | 237 | 0.56 | ||
| Rice husk biochar (RHBC700S) | 30 | 160.77 | 252 | 0.64 | ||
| Tea waste biochar (TWBC300) | 30 | 5–100 | 54.71 | 2.3 | 23.99 | 28 |
| Tea waste biochar (TWBC500) | 30 | 48.73 | 1.6 | 31.04 | ||
| Tea waste biochar (TWBC700) | 30 | 22.74 | 342 | 0.06 | ||
| Tea waste biochar (TWBC700) | 25 | 50 | 10.74 | 342 | 0.03 | 29 |
| Rice husk biochar (RHBC700) | 25 | 23.86 | 377 | 0.06 | ||
| Blast furnace dust | 25 | 22–110 | 13.0 | 13 | 1.00 | 76 |
| Blast furnace sludge | 25 | 23.0 | 28 | 0.80 | ||
| Activated carbon | 25 | 266.0 | 710 | 0.37 | ||
| Carbonaceous adsorbent | 25 | 208.3 | 380 | 0.29 | ||
| 45 | 150.2 | 380 | 0.39 | |||
| Granular activated carbon (GAC) | 30 | 50–225 | 96.1 | 732 | 0.13 | 84 |
| Banana stalk activated carbon | 30 | 25–250 | 156.3 | 981 | 0.16 | 85 |
| 40 | 161.3 | 0.16 | ||||
| 50 | 164.0 | 0.17 | ||||
| Date seed activated carbon | 30 | 25–250 | 137.0 | 880 | 0.15 | 26 |
| Commercial activated carbon | 30 | 25–250 | 97.1 | 620 | 0.50 | 75 |
| Palm fronds activated carbon | 30 | 25–250 | 164.0 | 1237 | 0.13 | 30 |
| Coconut frond activated carbon (CFAC) | 30 | 25–250 | 198.4 | 484 | 0.41 | 86 |
| 40 | 193.1 | 0.39 | ||||
| 50 | 205.0 | 0.42 |
4. Conclusions
Herein, slowly pyrolyzed biochar obtained from sugarcane bagasse (SB500) was successfully used for aqueous carbofuran remediation. The solution pH played an important role in carbofuran adsorption. The maximum adsorption was achieved at pH 2.0. The equilibrium sorption data were best fitted to the Langmuir equation. The maximum monolayer adsorption capacity of 19 mg g−1 was achieved at 45 °C. The carbofuran adsorption kinetics data were fitted best to the pseudo-second order rate equation. ΔG°, ΔH°, and ΔS° values were determined. Sugarcane bagasse biochar (SB500) was compared with other adsorbents used for carbofuran removal. Overall, the performance of SB500 was comparable to that of many adsorbents previously used for carbofuran remediation. The recovery of carbofuran with simultaneous SB500 regeneration was also successfully achieved. Thus, sustainable sugarcane bagasse biochar may be considered for water decontamination to replace the costly activated carbons and other commercially available adsorbents.Conflicts of interest
There are no conflicts to declare.Acknowledgements
Financial support [DST/TM/WTI/2K15/121(C) dated: 19.09.2016] in the project entitled “Removal and Recovery of Pharmaceuticals from water using sustainable magnetic and nonmagnetic biochars” from Department of Science and Technology, New Delhi, India is thankfully acknowledged. Financial support (No. INTISL/12/P-008) in the project entitled “Development of Rice and Tea Residues-Derived Bio-Chars as Effective Green Materials for Adsorptive Stabilization of Pesticides in Soil and Water Systems” is also thankfully acknowledged. Financial support [DST/IS-STAC/CO2-SR-129/12(G)] from Department of Science and Technology, New Delhi, India is thankfully acknowledged. Authors are also thankful to University Grant Commission (UGC), New Delhi, for providing the financial assistance under 21st Century Indo-US Research Initiative 2014 to Jawaharlal Nehru University, New Delhi and Mississippi State University, USA in the project “Clean Energy and Water Initiatives” [UGC No. F.194-1/2014(IC)]. One of the authors (V. V.) thankfully acknowledges University Grants Commission, New Delhi, India for the Research Fellowship. One of the authors (DM) also thanks Jawaharlal Nehru University for providing financial assistance under the Second phase of a University with Potential of Excellence (UPOEII) grant (ID 189). MP is thankful to CSIR for providing financial assistance under CSIR-SRF. DM is also acknowledging the funding support from DST PURSE, Government of India. Authors are thankful to Advance Instrumentation Research Facility (AIRF), Jawaharlal Nehru University, New Delhi for allowing us to use XRD, FTIR, and SEM facilities for biochar characterization.References
- P. Goel, Water pollution: causes, effects and control, New Age International Publishers, New Delhi, New Delhi, 2nd edn, 2006 Search PubMed.
- I. A. Shiklomanov and J. C. Rodda, World water resources at the beginning of the twenty-first century, Cambridge University Press, Cambridge, 2003 Search PubMed.
- W. H. Organization, Water pollution control: a guide to the use of water quality management principles, World Health Organization/United Nations Environment Programme, London, 1997 Search PubMed.
- J. Zolgharnein, A. Shahmoradi and J. Ghasemi, Clean: Soil, Air, Water, 2011, 39, 1105–1119 CAS.
- N. L. Devi and P. Raha, Bulletin of Environmental and Scientific Research, 2013, 2, 9–14 Search PubMed.
- A. Agrawal, R. S. Pandey and B. Sharma, J. Water Resour. Prot., 2010, 2, 432 CrossRef CAS.
- S. Donovan, M. Taggart and N. Richards, in Carbofuran and Wildlife Poisoning: Global Perspectives and Forensic Approaches, ed. N. Richards, UK, John Wiley & Sons, Inc, 2012, ch. 1, pp. 1–18 Search PubMed.
- P. Plangklang and A. Reungsang, Process Biochem., 2010, 45, 230–238 CrossRef CAS.
- E. Hodgson, R. M. Roe and N. Motoyama, Reviews in pesticide toxicology, USA, 1991 Search PubMed.
- D. M. Trotter, R. A. Kent and M. P. Wong, Crit. Rev. Environ. Sci. Technol., 1991, 21, 137–176 CAS.
- J. Massoulie and S. Bon, Annu. Rev. Neurosci., 1982, 5, 57–106 CrossRef CAS PubMed.
- P. Ott, Biochim. Biophys. Acta, Biomembr., 1985, 822, 375–392 CrossRef CAS.
- T. R. Fukuto, Environ. Health Perspect., 1990, 87, 245–254 CrossRef CAS PubMed.
- USEPA, National Primary Drinking Water Regulations, https://www.epa.gov/ground-water-and-drinking-water/national-primary-drinking-water-regulations#one Search PubMed.
- R. C. Gupta, J. Toxicol. Environ. Health, Part A, 1994, 43, 383–418 CAS.
- M. E. DeLorenzo, G. I. Scott and P. E. Ross, Environ. Toxicol. Chem., 2001, 20, 84–98 CrossRef CAS PubMed.
- D. Tenenbaum, Environ. Health Perspect., 2008, 116, A425 Search PubMed.
- M. Mahalakshmi, B. Arabindoo, M. Palanichamy and V. Murugesan, J. Hazard. Mater., 2007, 143, 240–245 CrossRef CAS PubMed.
- L.-A. Lu, Y.-S. Ma, M. Kumar and J.-G. Lin, Sustainable Environ. Res., 2010, 20, 293–297 CAS.
- W. Kuo, Y. Chiang and L. Lai, J. Environ. Sci. Health, Part B, 2006, 41, 937–948 CrossRef CAS PubMed.
- Y.-S. Ma, C.-F. Sung and J.-G. Lin, J. Hazard. Mater., 2010, 178, 320–325 CrossRef CAS PubMed.
- F. J. Benitez, J. L. Acero and F. J. Real, J. Hazard. Mater., 2002, 89, 51–65 CrossRef.
- E. Enjarlis, S. Bismo, S. Slamet and R. W. Soemantojo, 14th Regional Symposium of Chemical Engineering, Chemical Engineering Department, Gadjah Mada University, Yogyakarta, Indonesia, 2007, ISBN 978-979-16978-0-4 Search PubMed.
- I. Hua and U. Pfalzer-Thompson, Water Res., 2001, 35, 1445–1452 CrossRef CAS PubMed.
- M. Z. Bueno, L. A. Coral, M. L. Sens and F. R. Lapolli, Eng. Sanit. Ambiental, 2016, 21, 447–458 CrossRef.
- J. Salman, V. Njoku and B. Hameed, Chem. Eng. J., 2011, 173, 361–368 CrossRef CAS.
- S. Mayakaduwa, I. Herath, Y. S. Ok, D. Mohan and M. Vithanage, Environ. Sci. Pollut. Res., 2017, 24, 22755–22763 CrossRef CAS PubMed.
- S. Mayakaduwa, M. Vithanage, A. Karunarathna, D. Mohan and Y. S. Ok, Chem. Speciation Bioavailability, 2016, 28, 110–118 CrossRef CAS.
- M. Vithanage, S. Mayakaduwa, I. Herath, Y. S. Ok and D. Mohan, Chemosphere, 2016, 150, 781–789 CrossRef CAS PubMed.
- J. M. Salman, Journal of Chemistry, 2013, 2013, 1–5 Search PubMed.
- D. Kołodyńska, R. Wnętrzak, J. Leahy, M. Hayes, W. Kwapiński and Z. Hubicki, Chem. Eng. J., 2012, 197, 295–305 CrossRef.
- D. Mohan, A. Sarswat, Y. S. Ok and C. U. Pittman Jr, Bioresour. Technol., 2014, 160, 191–202 CrossRef CAS PubMed.
- M. Patel, R. Kumar, K. Kishor, T. Mlsna, C. U. Pittman Jr and D. Mohan, Chem. Rev., 2019, 119, 3510–3673 CrossRef CAS PubMed.
- M. Ahmad, A. U. Rajapaksha, J. E. Lim, M. Zhang, N. Bolan, D. Mohan, M. Vithanage, S. S. Lee and Y. S. Ok, Chemosphere, 2014, 99, 19–33 CrossRef CAS PubMed.
- D. Mohan, C. U. Pittman Jr and P. H. Steele, Energy Fuels, 2006, 20, 848–889 CrossRef CAS.
- D. Mohan, C. U. Pittman Jr, M. Bricka, F. Smith, B. Yancey, J. Mohammad, P. H. Steele, M. F. Alexandre-Franco, V. Gómez-Serrano and H. Gong, J. Colloid Interface Sci., 2007, 310, 57–73 CrossRef CAS PubMed.
- D. Mohan, R. Sharma, V. K. Singh, P. Steele and C. U. Pittman Jr, Ind. Eng. Chem. Res., 2012, 51, 900–914 CrossRef CAS.
- N. B. Dewage, A. S. Liyanage, C. U. Pittman Jr, D. Mohan and T. Mlsna, Bioresour. Technol., 2018, 263, 258–265 CrossRef PubMed.
- N. B. Dewage, A. S. Liyanage, Q. Smith, C. U. Pittman Jr, F. Perez, E. B. Hassan, D. Mohan and T. Mlsna, Chemosphere, 2019, 225, 943–953 CrossRef.
- A. G. Karunanayake, O. AdeleTodd, M. Crowley, L. Ricchetti, C. U. Pittman Jr, R. Anderson, D. Mohan and T. Mlsna, Chem. Eng. J., 2018, 331, 480–491 CrossRef CAS.
- N. B. Dewage, R. E. Fowler, C. U. Pittman Jr, D. Mohan and T. Mlsna, RSC Adv., 2018, 8, 25368–25377 RSC.
- M. Essandoh, D. Wolgemuth, C. U. Pittman Jr, D. Mohan and T. Mlsna, Chemosphere, 2017, 174, 49–57 CrossRef CAS PubMed.
- A. A. Oladipo, A. O. Ifebajo and R. Vaziri, Green Adsorbents for Pollutant Removal, 2018, pp. 327–351 Search PubMed.
- M. Gazi, A. A. Oladipo and K. A. Azalok, Sep. Sci. Technol., 2018, 53, 1124–1131 CrossRef CAS.
- C. Peiris, S. R. Gunatilake, T. E. Mlsna, D. Mohan and M. Vithanage, Bioresour. Technol., 2017, 246, 150–159 CrossRef CAS PubMed.
- A. A. Oladipo and A. O. Ifebajo, J. Environ. Manage., 2018, 209, 9–16 CrossRef CAS PubMed.
- A. Sarswat and D. Mohan, RSC Adv., 2016, 6, 85390–85410 RSC.
- D. Mohan, K. Abhishek, A. Sarswat, M. Patel, P. Singh and C. U. Pittman Jr, RSC Adv., 2018, 8, 508–520 RSC.
- MNRE, Ministry of New and Renewable Energy, 2009, https://mnre.gov.in/biomass-powercogen Search PubMed.
- AGRICOOP, Agriculture Statistics at a glance 2010, Directorate of Economics and Statistics, Ministry of Agriculture, Govt. of India, http://agricoop.nic.in/Agristatistics.htm Search PubMed.
- M. Hiloidhari, D. Das and D. C. Baruah, Renewable Sustainable Energy Rev., 2014, 32, 504–512 CrossRef.
- V. Gupta, I. Ali and D. Mohan, J. Colloid Interface Sci., 2003, 265, 257–264 CrossRef CAS PubMed.
- NIST Chemistry WebBook, NIST Standard Reference Database Number 69, ed. P. J. Linstrom and W. G. Mallard, National Institute of Standards and Technology, Gaithersburg MD, 20899, retrieved August 2, 2019, DOI:10.18434/T4D303.
- R. Sharma, A. Sarswat, C. U. Pittman Jr and D. Mohan, RSC Adv., 2017, 7, 8606–8624 RSC.
- L. C. Melo, A. R. Coscione, C. A. Abreu, A. P. Puga and O. A. Camargo, BioResources, 2013, 8, 4992–5004 CrossRef.
- Z. Liu, F.-S. Zhang and J. Wu, Fuel, 2010, 89, 510–514 CrossRef CAS.
- M. Ertaş and M. H. Alma, J. Anal. Appl. Pyrolysis, 2010, 88, 22–29 CrossRef.
- K. H. Kim, J.-Y. Kim, T.-S. Cho and J. W. Choi, Bioresour. Technol., 2012, 118, 158–162 CrossRef CAS PubMed.
- D. Govindarajan and G. Jayalakshmi, Adv. Appl. Sci. Res., 2011, 2, 544–549 CAS.
- K. Jindo, H. Mizumoto, Y. Sawada, M. A. Sanchez-Monedero and T. Sonoki, Biogeosciences, 2014, 11, 6613–6621 CrossRef.
- S. Y. Oh, D. I. Yoo, Y. Shin, H. C. Kim, H. Y. Kim, Y. S. Chung, W. H. Park and J. H. Youk, Carbohydr. Res., 2005, 340, 2376–2391 CrossRef CAS PubMed.
- B. Chen and Z. Chen, Chemosphere, 2009, 76, 127–133 CrossRef CAS PubMed.
- R. Sharma, J. Wooten, V. Baliga and M. Hajaligol, Fuel, 2001, 80, 1825–1836 CrossRef CAS.
- R. Panda, M. Hsieh, R. Chung and T. Chin, J. Phys. Chem. Solids, 2003, 64, 193–199 CrossRef CAS.
- S. Mozia, M. Tomaszewska and A. W. Morawski, Water Res., 2005, 39, 501–509 CrossRef CAS PubMed.
- M. I. Schnitzer, C. M. Monreal, G. A. Facey and P. B. Fransham, J. Environ. Sci. Health, Part B, 2007, 42, 71–77 CrossRef CAS PubMed.
- M. Tatzber, M. Stemmer, H. Spiegel, C. Katzlberger, G. Haberhauer, A. Mentler and M. H. Gerzabek, J. Plant Nutr. Soil Sci., 2007, 170, 522–529 CrossRef CAS.
- A. K. Sarmah, P. Srinivasan, R. J. Smernik, M. Manley-Harris, M. J. Antal, A. Downie and L. van Zwieten, Soil Res., 2010, 48, 648–658 CrossRef CAS.
- X. Chen, G. Chen, L. Chen, Y. Chen, J. Lehmann, M. B. McBride and A. G. Hay, Bioresour. Technol., 2011, 102, 8877–8884 CrossRef CAS PubMed.
- J.-H. Yuan, R.-K. Xu and H. Zhang, Bioresour. Technol., 2011, 102, 3488–3497 CrossRef CAS PubMed.
- B. B. Uzun, E. Apaydin-Varol, F. Ateş, N. Özbay and A. E. Pütün, Fuel, 2010, 89, 176–184 CrossRef CAS.
- G. Haberhauer and M. Gerzabek, Vib. Spectrosc., 1999, 19, 413–417 CrossRef CAS.
- W.-K. Kim, T. Shim, Y.-S. Kim, S. Hyun, C. Ryu, Y.-K. Park and J. Jung, Bioresour. Technol., 2013, 138, 266–270 CrossRef CAS PubMed.
- J. Salman and B. Hameed, J. Hazard. Mater., 2010, 175, 133–137 CrossRef CAS PubMed.
- J. Salman, F. Abd and A. Muhammed, Int. J. Chem. Sci., 2011, 9, 557–564 CAS.
- V. K. Gupta, I. Ali and V. K. Saini, J. Colloid Interface Sci., 2006, 299, 556–563 CrossRef CAS PubMed.
- W. Zheng, M. Guo, T. Chow, D. N. Bennett and N. Rajagopalan, J. Hazard. Mater., 2010, 181, 121–126 CrossRef CAS PubMed.
- S. K. Lagergren, Sven. Vetenskapsakad. Handingarl., 1898, 24, 1–39 Search PubMed.
- Y.-S. Ho and G. McKay, Process Biochem., 1999, 34, 451–465 CrossRef CAS.
- K. Y. Foo and B. H. Hameed, Chem. Eng. J., 2010, 156, 2–10 CrossRef CAS.
- G. McKay, Use of Adsorbents for the Removal of Pollutants from Wastewater, CRC Press, 1995 Search PubMed.
- J. M. Salman and K. A. Al-Saad, Int. J. Chem. Sci., 2012, 10, 677–690 CAS.
- K. Low and C. Lee, Bioresour. Technol., 1991, 38, 1–6 CrossRef CAS.
- J. Salman and B. Hameed, Desalination, 2010, 256, 129–135 CrossRef CAS.
- J. Salman and B. Hameed, J. Hazard. Mater., 2010, 176, 814–819 CrossRef CAS PubMed.
- V. Njoku, M. A. Islam, M. Asif and B. Hameed, J. Anal. Appl. Pyrolysis, 2014, 110, 172–180 CrossRef CAS.
Footnote |
| † Electronic supplementary information (ESI) available. See DOI: 10.1039/c9ra01628g |
| This journal is © The Royal Society of Chemistry 2019 |

