
 Open Access Article
 This Open Access Article is licensed under a Creative Commons Attribution-Non Commercial 3.0 Unported Licence
Direct 3D printing of a graphene oxide hydrogel for fabrication of a high areal specific capacitance microsupercapacitor†
Xiawei Yun‡
a,
Bingchuan Lu‡bcd,
Zhiyuan Xionga,
Bo Jiabcd,
Bo Tanga,
Henan Maoa,
Ting Zhang *bcd and
Xiaogong Wang*a
*bcd and
Xiaogong Wang*a
aDepartment of Chemical Engineering, Laboratory of Advanced Materials (MOE), Tsinghua University, Beijing 100084, P. R. China. E-mail: wxg-dce@mail.tsinghua.edu.cn
bBiomanufacturing Center, Department of Mechanical Engineering, Tsinghua University, Beijing 100084, P. R. China. E-mail: t-zhang@mail.tsinghua.edu.cn
cBiomanufacturing and Rapid Forming Technology Key Laboratory of Beijing, Beijing 100084, P. R. China
dBiomanufacturing and Engineering Living Systems, Innovation International Talents Base (111 Base), Beijing, P. R. China
First published on 17th September 2019
Abstract
In this work, we demonstrate that a graphene oxide (GO) hydrogel with unique rheological properties, such as high storage modulus, shear-thinning nature and fast viscosity recovery, is highly suitable as an ink for three dimensional (3D) printing. The results show that the GO ink has the characteristics of both gel and viscous liquid, where the gel–liquid transition depends on the shear rate and shear strain amplitude. In the extrusion and printing process, the ink shows significant shear thinning and rapid viscosity recovery after cessation of shearing, which are desirable for 3D printing through direct ink writing (DIW). A suitable scanning speed and extrusion speed were determined to construct a precise 3D structure. After the reduction, the RGO electrode with hierarchical porous structures is stable, of higher precision, and loaded with more of the effective materials per unit area. The 3D printed micro-supercapacitors (MSCs) with interdigitated architecture exhibit a high areal specific capacitance of 101 mF cm−2 at a current density of 0.5 mA cm−2 and 111 mF cm−2 at a scan rate of 10 mV s−1, which are superior compared with most of the reported MSCs of carbon-based materials.
1. Introduction
The rapid development of microscale electronic devices, such as micro-electromechanical systems, biomedical sensors, wireless sensors, and actuator drives, has created an urgent demand for micro-power sources and small-scale energy storage units.1–3 Microsupercapacitors (MSCs), a new type of micro/nanoscale electrochemical energy storage device, have demonstrated wide applications in integrated microelectronic applications due to their high power density, excellent rate capability, and ultra-long cycle life.4–9 Various patterning approaches, such as sputtering, electrochemical deposition, ink-jet printing, spray deposition, photolithography, and laser irradiation-assisted processing, have been used to fabricate in-plane MSCs.3,4 However, because the electrodes fabricated by these methods can only have a limited thickness, which cannot encompass enough active materials to provide sufficient interfacial areas for energy storage, the prepared planar MSCs show relatively low areal capacitances (such as 80 μF cm−2 to 30 mF cm−2).1,8 To improve the areal capacitance, active material has to be loaded with a significantly increased amount for per unit area of the electrode.4 Three-dimensional (3D) printing is a versatile approach for many applications,3 which can be employed to fabricate the thicker MSC electrodes by increasing the printed layers in low cost. As one typical type of the 3D printing technique, direct ink writing (DIW) is most commonly used because of its simple printing mechanism, low-budget fabrication process and wide adaptability to different types of materials.10,11 For the fabrication of MSCs through DIW, it is of crucial importance to find a suitable material with optimized rheological properties for use as the ink.As a paradigmatic two-dimensional (2D) carbonaceous material, graphene and its derivatives exhibit great prospects for constructing macroscopic 3D aerogels or frameworks due to its high surface area, extraordinary mechanical properties, and the super electrical/thermal conductivity.12–14 In recent years, graphene oxide (GO) as a graphene derivative has been intensively investigated owing to its fascinating properties stemmed from the honeycomb carbon framework with various functional groups and great feasibility for scalable production.15–18 GO single-layered nanosheets are typically obtained from complete exfoliation of graphite oxide through chemical methods.17 Although nonpolar regions of GO sheets are hydrophobic, the oxygenated regions with the structural defects/vacancies show hydrophilicity due to the organic functional groups.18 Therefore, GO sheets obtained from oxidation and exfoliation of graphite can be well dispersed in aqueous media. Depending on the factors such as degree of oxidation of the sheets, concentration, pH and salt concentration, the GO suspensions can exist as viscoelastic liquid, soft solid, liquid crystal, gel and glass.19,20 Under proper conditions, a GO suspension can be processed by different methods. Macro-assembled materials with 3D structures have been fabricated from GO and used in active electrode,21,22 lithium batteries,23 and supercapacitors.24,25 The porous morphologies of the 3D materials can provide sufficient interfacial areas and pathways to facilitate adsorption and transport of ions.26–28 On the other hand, most of those materials obtained from the studies exist in bulk form, which limits the feasibility of their application in micro-electrodes.8 Therefore, the accurate fabrication of micro-scale architecture from GO suspensions is required for the construction of micro-devices such as MSCs.
Although DIW has been widely utilized to build 3D structure from various soft matter inks,29 a dilute GO suspension usually fails to be a candidate for DIW because of its liquid behaviour (low viscosity, low yield stress and low storage modulus) and low solid containing (generally less than 2 wt%). To improve the rheological behaviour of GO suspensions for processing, most of the reported methods introduced accessory additives such as polymers, inorganic nanoparticles in a high content.30–32 Nevertheless, these additives brought tedious etching post-processes and reduced the electrical conductivity of the electrodes, which increase the complexity of fabrication and weaken the performance of the target devices.30–32 Besides adjusting the rheological properties of the GO inks, researchers have also developed several strategies to improve the printing accuracy of the devices through DIW. For example, a freeze-casting method was employed to print a GO aqueous solution without any additive, but it required complex processes and specific printing environment.33 Despite these progresses in printing GO inks through DIW, there still lacks fundamental understanding about how rheological properties of GO inks can affect the DIW process, the shape and accuracy of the obtained objects, and how to optimize 3D printing process to fabricate high quality MSCs.
In this study, we explored the method to fabricate MSC electrode by direct 3D printing of a highly concentrated GO suspension without any additive, which can contain more effective material and be printed at room temperature. The rheological properties of the ink were studied by dynamic frequency sweep and steady shear sweep with a rotational rheometer. Rotational recovery measurement was also performed to characterize the viscosity recovery behaviour. By studying the rheological behaviour of the GO suspensions with different concentrations, it was found that the concentrated GO suspensions are highly suitable for DIW owing to the gel–liquid transition and shear thinning behaviour. Moreover, the viscosity of the inks can quickly recover the original value after cessation of shearing, which is beneficial to maintain the printed structure with high accuracy. In order to meet the requirements of printability, high precision and loading with more material for per unit area, the optimized processing conditions were found by 3D printing tests. The direct 3D printing is demonstrated to be able to produce electrodes for the all-solid-state MSCs. The reduced graphene oxide (RGO) electrodes were finally obtained after being reduced with hydrazine hydrate steam in a hydrothermal reactor. To facilitate the discussion, the RGO electrode with interdigitated architecture is referred to as 3DHG and the corresponding MSCs as 3DHG-MSCs in the following part, where 3DHG specifies the electrode obtained by 3D printing from a GO hydrogel. The fabricated 3DHG-MSCs exhibit a desirable areal specific capacitance, higher than most of the carbon-based materials for all-solid-state MSCs reported until now.
2. Experimental
2.1 Preparation of GO suspensions
Graphene oxide (GO) was prepared by the oxidation of natural graphite powder according to the modified Hummers' method described in our previous reports.34,35 The calibrated concentration of the obtained GO suspension was 12 mg mL−1. Then, the as-prepared GO suspension was concentrated by ultracentrifugation at 15![[thin space (1/6-em)]](https://www.rsc.org/images/entities/char_2009.gif) 000 rpm for 0.5 h, 15000 rpm for 1 h, 15000 rpm for 2 h, 18000 rpm for 2 h, 20000 rpm for 2 h, and 20000 rpm for 4 h, respectively. After decanting the supernatant, the highly concentrated GO suspensions were obtained, which had the concentrations of 17.5, 21.5, 25.5, 31.5, 40.0 and 50.0 mg mL−1, respectively. Under steady condition, the suspensions formed hydrogel spontaneously.
000 rpm for 0.5 h, 15000 rpm for 1 h, 15000 rpm for 2 h, 18000 rpm for 2 h, 20000 rpm for 2 h, and 20000 rpm for 4 h, respectively. After decanting the supernatant, the highly concentrated GO suspensions were obtained, which had the concentrations of 17.5, 21.5, 25.5, 31.5, 40.0 and 50.0 mg mL−1, respectively. Under steady condition, the suspensions formed hydrogel spontaneously.
2.2 Rheological measurements
In the rheological measurements, the data were obtained on an Anton Paar MCR rotational rheometer (MCR 502) with controlled-rate mode. A plate–plate geometry (25 mm diameter and 0.5 mm gap) was used for the measurements on this instrument. For the aqueous GO suspensions, the exposed surfaces of the samples were covered by a low molecular weight silicone oil to prevent the evaporation of the water and measurements were performed at 20.00 ± 0.03 °C. Dynamic frequency sweeps were conducted at a constant strain of 0.1% within the linear viscoelastic region (LVR) to investigate the dynamic responses of the samples. Steady shear sweeps were used to investigate the flow properties of the material by recording the shear stress (τ) and viscosity (η) at increasing shear rates (![[small gamma, Greek, dot above]](https://www.rsc.org/images/entities/i_char_e0a2.gif) ). Rotational recovery measurements were performed to characterize the viscosity recovery behaviour by applying a low shear rate of 0.1 s−1 for 300 s, followed by a high shear rate at 1000 s−1 for 20 s, and finally a low shear rate of 0.1 s−1 for 300 s.
). Rotational recovery measurements were performed to characterize the viscosity recovery behaviour by applying a low shear rate of 0.1 s−1 for 300 s, followed by a high shear rate at 1000 s−1 for 20 s, and finally a low shear rate of 0.1 s−1 for 300 s.
2.3 Fabrication of 3D printed electrodes
A hydrogel 3D printer (Cell Assembler II), which was developed at Department of Mechanical Engineering, Tsinghua University,36 was used to fabricate the MSC electrodes from GO suspensions. The 3D printing parameters were determined by the rheological tests, extrusion experiments and printing experiments. First, the optimized concentration of GO suspensions and the size of the nozzle were decided by the rheological tests and the extrusion experiments. The GO hydrogel with concentrations of 17.5, 21.5, 25.5, 31.5, 40.0 and 50.0 mg mL−1 were extruded though dispensing needles, whose size are 27G, 30G and 32G with an extrusion speed of 0.1–0.8 μL s−1. The shapes of the extruded filaments were microscopically observed and evaluated to get a suitable concentration of the GO suspension and size of nozzle for the printing experiments.The suitable conditions, i.e., the GO suspension with a concentration of 40.0 mg mL−1 and the nozzle with a size of 32G, were chosen to conduct the 3D printing experiments. Extrusion speeds of 0.1, 0.2, 0.4, 0.6, 0.8 μL s−1 and scanning speeds of 1, 2, 4, 6, 8 mm s−1 were combined into 25 printing schemes. GO filaments were extruded from the nozzle and deposited on the platform, and the photo-images were taken with a microscope immediately after printing. We selected 20 isometric measuring points from each micrograph to estimate the diameters of the filaments, and then the resulting data were calculated and plotted using Origin software. The effects of the nozzle scanning speed and extrusion speed on the diameter and uniformity of the formed filaments were determined, and then the optimized printing conditions were obtained.
For a typical fabrication with the 3D printing, current collectors of Cr/Au (thickness of 70 nm/130 nm) were sputtered on a clean glass slide with a gap of 5 mm. The GO suspension (40.0 mg mL−1) was then carefully pipetted into a 1 mL syringe without bubbles. A 32G dispensing needle was mounted on the syringe to be the nozzle of the printing system and then the syringe was vertically mounted on the syringe pump in the printer. The 3D GO capacitor structure was fabricated by forced extrusion and printing in a layer-by-layer fashion on a glass plate with the gold collectors. The microsupercapacitor had three pairs of the electrodes. The length of each electrode was 5 mm and the spacing of the ipsilateral electrodes was 2.4 mm. The jump height of the nozzle between two sequent layers was 0.25 mm, which means the thickness of each layer was 0.25 mm. The electrodes consisted of 5 layers of the filaments, with a total height of 1.25 mm. When the fabrication process was completed, the GO structures were immediately placed in a refrigerator at −80 °C for 2 h. After they were sufficiently solidified, the GO capacitor electrodes were freeze-dried for 12 h. Finally, the reduced graphene oxide (RGO) electrodes were obtained after being reduced with hydrazine hydrate steam in a hydrothermal reactor at 100 °C for 5 h.
2.4 Assembly of MSCs
The 3DHG electrodes were packaged with a frame of silicone rubber (Dow Corning, 3145 RTV), which were cured at room temperature for 24 h. The PVA/H3PO4 gel electrolyte was prepared by dissolving 1 g of poly(vinyl alcohol) (PVA, Mw = 89000–98000, Sigma-Aldrich) into 10 mL of deionized water at 90 °C under stirring. After the mixture became clear, it was cooled to the room temperature and then 1 g of phosphoric acid was added under stirring. The gel electrolyte was casted onto frame of silicone rubber using a syringe. Vacuum treatment was carried out for 30 min to improve the infiltration of the electrolyte into the 3D printed RGO electrodes. After the excess water was removed in air under ambient conditions overnight, the in-plane 3DHG-MSC was obtain.
2.5 Electrochemical measurements
All electrochemical measurements, including the cyclic voltammetry (CV), galvanostatic charge–discharge (GCD) tests and electrochemical impedance spectroscopy (EIS), were carried out on an electrochemical workstation (CHI 660E, CH Instruments Inc.). The CV and GCD tests for a single device were conducted under the electrochemical window of 0–1 V with different scanning rates. The EIS measurement was carried out in the frequency range from 105 to 0.01 Hz at the amplitude of 5 mV. The total capacitance (Cdevice) of MSCs was calculated from their CV and GCD curves according to the eqn (1) and (2),
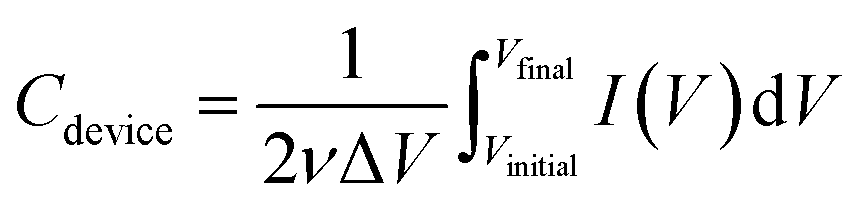 | (1) |
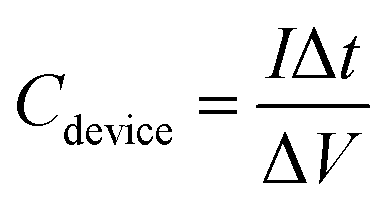 | (2) |
The specific capacitance of MSCs was calculated by the following equations,
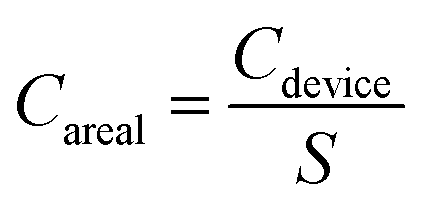 | (3) |
 | (4) |
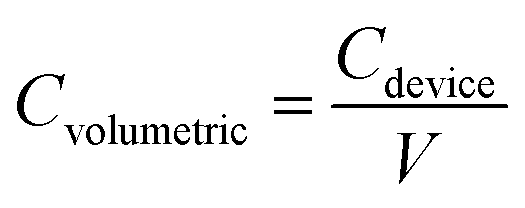 | (5) |
2.6 Instrument and characterization
An X-ray photoelectron spectrometer (XPS, ESCALAB250Xi) with a monochromatized Al Kα X-ray source (1486.6 eV) was used for XPS measurements. X-ray diffraction (XRD) patterns were collected on a Bruker D8 Advance X-ray diffractometer with Cu Kα radiation (1.5406 Å). Raman spectra were acquired on a Renishaw 1000 microspectrometer using an excitation wavelength of 514.5 nm. Atomic force microscopy (AFM) was performed on a Shimadzu SPM-9500 in the tapping mode. Morphologies and structures of the GO sheets and 3D printed electrodes were observed by a field-emission scanning electron microscope (SEM, Zeiss Merlin) at 5.0 kV. An optical microscope (Olympus IX81) with a CCD apparatus was used for direct observation. The cyclic voltammetry (CV) technique was carried out to determine the electrical conductivity of the 3DHG electrodes at a scan rate of 100 mV s−1 in the potential window from −0.4 V to 0.4 V.3. Results and discussion
The 3DHG-MSC was fabricated through the process schematically illustrated in Fig. 1a. Fig. 1b shows detailed components of the device and the specific structure dimension of the design can be seen in Fig. S1 (ESI†) for detail. The preparation and properties of the GO inks are presented in Section 3.1. As the accuracy and stability of structures obtained from DIW are critical to warrant the performance of the target device,37,38 the rheological properties of the GO inks and their influences on the stability of printed architecture are discussed in 3.2. The 3D printing with the GO inks was performed in a layer-by-layer manner on a gilt glass substrate spaced 5 mm apart to form a 3D interdigitated architectures. The actual process and optimized parameters for printing MSC electrodes from GO inks are presented in Section 3.3. Fig. 1c displays the typical morphology of the unreduced GO electrodes with a 3D interdigitated architecture via DIW. Following the freeze-drying and in situ chemical reduction, the RGO electrodes with the hierarchical porous structure were obtained with the interdigitated geometry. The 3DHG-MSC was finally assembled by adding H3PO4/PVA gel electrolyte in a RTV silicone rubber packaging frame and drying. RTV silicone rubber was used as the packing material for the device, which is highly resistant to impact, temperature sudden change and chemical corrosion. It is also known to have no effect on the performance of the device.38 The structure and performances of 3DHG-MSCs are given in Sections 3.4 and 3.5, which show that the 3D printing approach enables the fabrication of MSCs with the thicker multilayer structure. Typically, the 3DHG electrodes with 5 printed layers and 3 pairs of the fingers, each about 5 mm in length, were feasibly fabricated. Fig. 1d shows the optical micrograph of the 3DHG electrode, where the printed electrodes are uniform with a width of about 600 μm. Owing to the desirable structure produced by the 3D printing process, the fabricated 3DHG-MSCs exhibit the high areal specific capacitance. The characterization of the GO inks, its rheological properties and the processing parameter control of 3D printing as well as the performance of 3DHG-MSCs are presented below.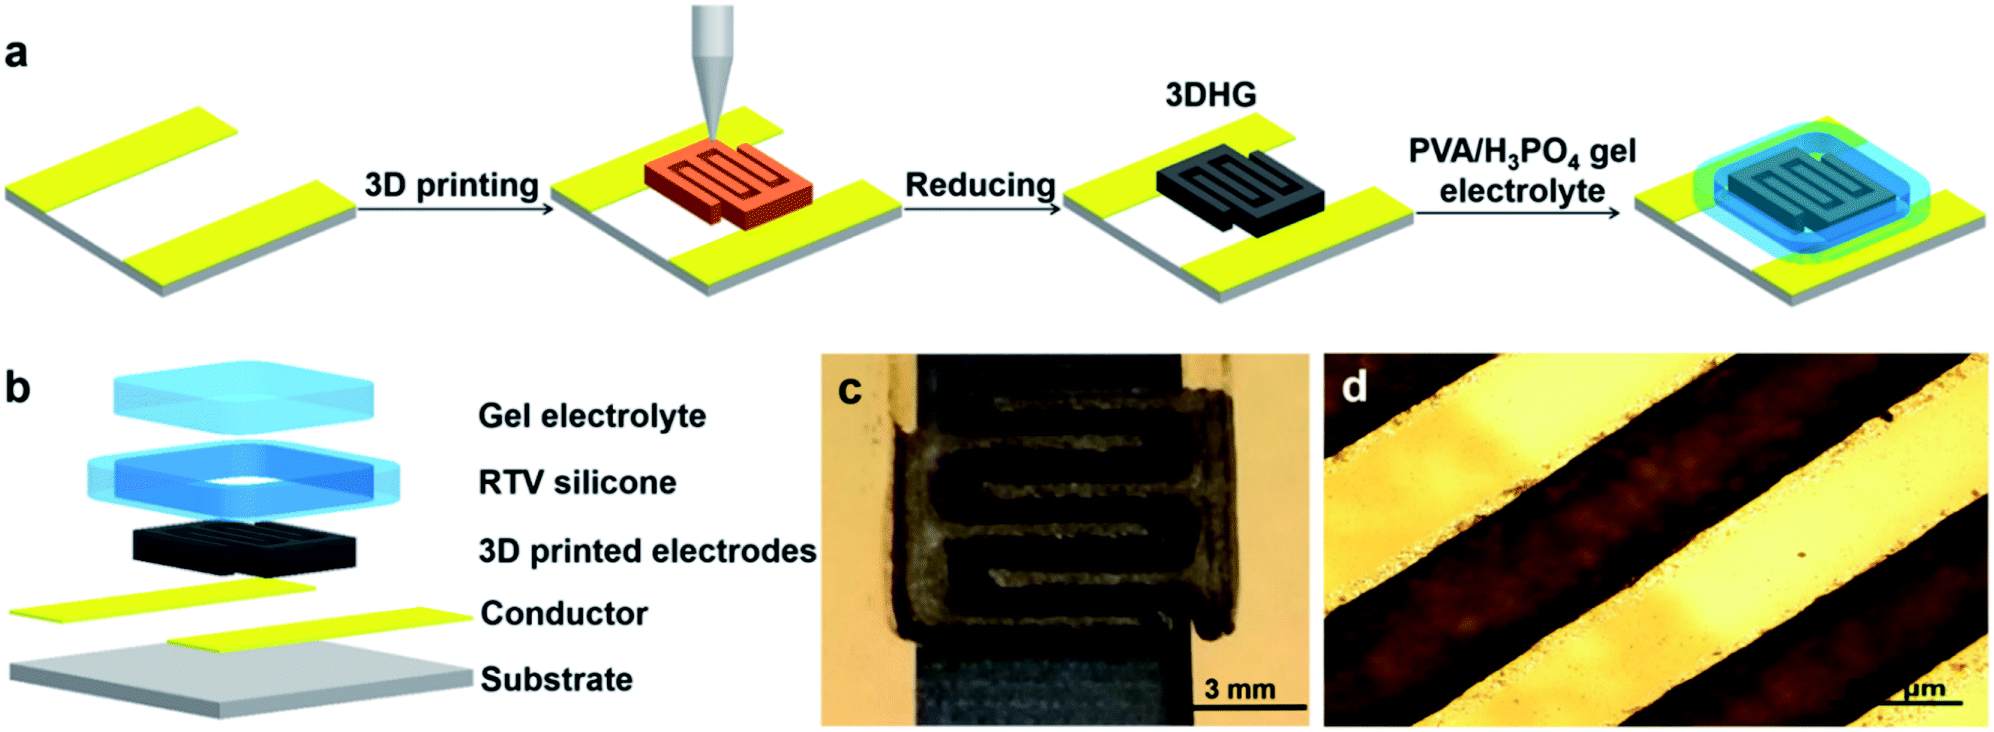 | ||
| Fig. 1 (a) Schematic illustration of the fabrication process of 3DHG-MSCs, (b) structural decomposition diagram of 3DHG-MSCs, (c) optical image of the 3D interdigitated architecture composed of three-pair fingers with 5 printed layers, (d) optical microscopic image of 3DHG electrode. | ||
3.1 GO/RGO characterization and ink preparation
Graphene oxide (GO) was prepared by the oxidation of natural graphite powder according to the modified Hummers' method, as described in our previous report.34,35 The SEM and AFM characterizations of GO sheets are shown in Fig. 2a and b. The plane sizes range from hundreds of nanometers to dozen micrometers. An average thickness of 0.94 nm, obtained from the statistics of 100 sheets, indicates the presence of monolayer and few-layer sheets at the same time. The reduced graphene oxide (RGO) sheets obtained from GO under hydrazine vapour reduction were the building blocks of the 3DHG electrodes, which were analysed together with GO. The chemical structure of GO and RGO were characterized by Raman spectroscopy. As shown in Fig. 2c, the two typical peaks located at 1349 and 1588 cm−1 belong to the D and G bands of the graphene materials. The intensity ratio of the D band to G band in the Raman spectrum is inversely proportional to in-plane crystalline size in graphite-based systems.39 The result shows that the value of I(D)/I(G) increases from 0.96 to 1.29 after the chemical reduction. As the 2D lattice structures obtained from reduction have more defects, the observed I(D)/I(G) increase indicates the recovery of the conjugated structure of graphene after the reduction.40 The surface chemical composition of the 3DHG was also analysed by XPS. The survey spectra and C1s spectra of GO and RGO for the 3DHG electrodes are shown in Fig. 2d and e, respectively. The C1s XPS spectrum of GO can be deconvoluted into four sub-peaks. The four peaks centred at 284.9, 287.2, 288.6, 289.2 eV are associated with C–C, C–O, C![[double bond, length as m-dash]](https://www.rsc.org/images/entities/char_e001.gif) O and O–CO, respectively, which indicate the high oxidation degree of GO samples. The C1s spectrum of RGO shows the much weaker peak intensities for the oxygen-containing groups. The C/O atomic ratios increase from 2.00 to 10.45 after the chemical reduction, indicating considerable deoxygenation after the reaction. Fig. 2f shows the XRD curves obtained for GO, RGO and graphite. The XRD profile of RGO shows a strong diffraction peak at 25.12°, corresponding to a d-spacing of 3.53 Å. This d value is much smaller than that of GO (8.12 Å), while slightly larger than that of natural graphite (3.35 Å). It indicates the presence of π–π stacking between RGO sheets and also the existence of residual oxygenated functional groups increasing the d-spacing.41
O and O–CO, respectively, which indicate the high oxidation degree of GO samples. The C1s spectrum of RGO shows the much weaker peak intensities for the oxygen-containing groups. The C/O atomic ratios increase from 2.00 to 10.45 after the chemical reduction, indicating considerable deoxygenation after the reaction. Fig. 2f shows the XRD curves obtained for GO, RGO and graphite. The XRD profile of RGO shows a strong diffraction peak at 25.12°, corresponding to a d-spacing of 3.53 Å. This d value is much smaller than that of GO (8.12 Å), while slightly larger than that of natural graphite (3.35 Å). It indicates the presence of π–π stacking between RGO sheets and also the existence of residual oxygenated functional groups increasing the d-spacing.41
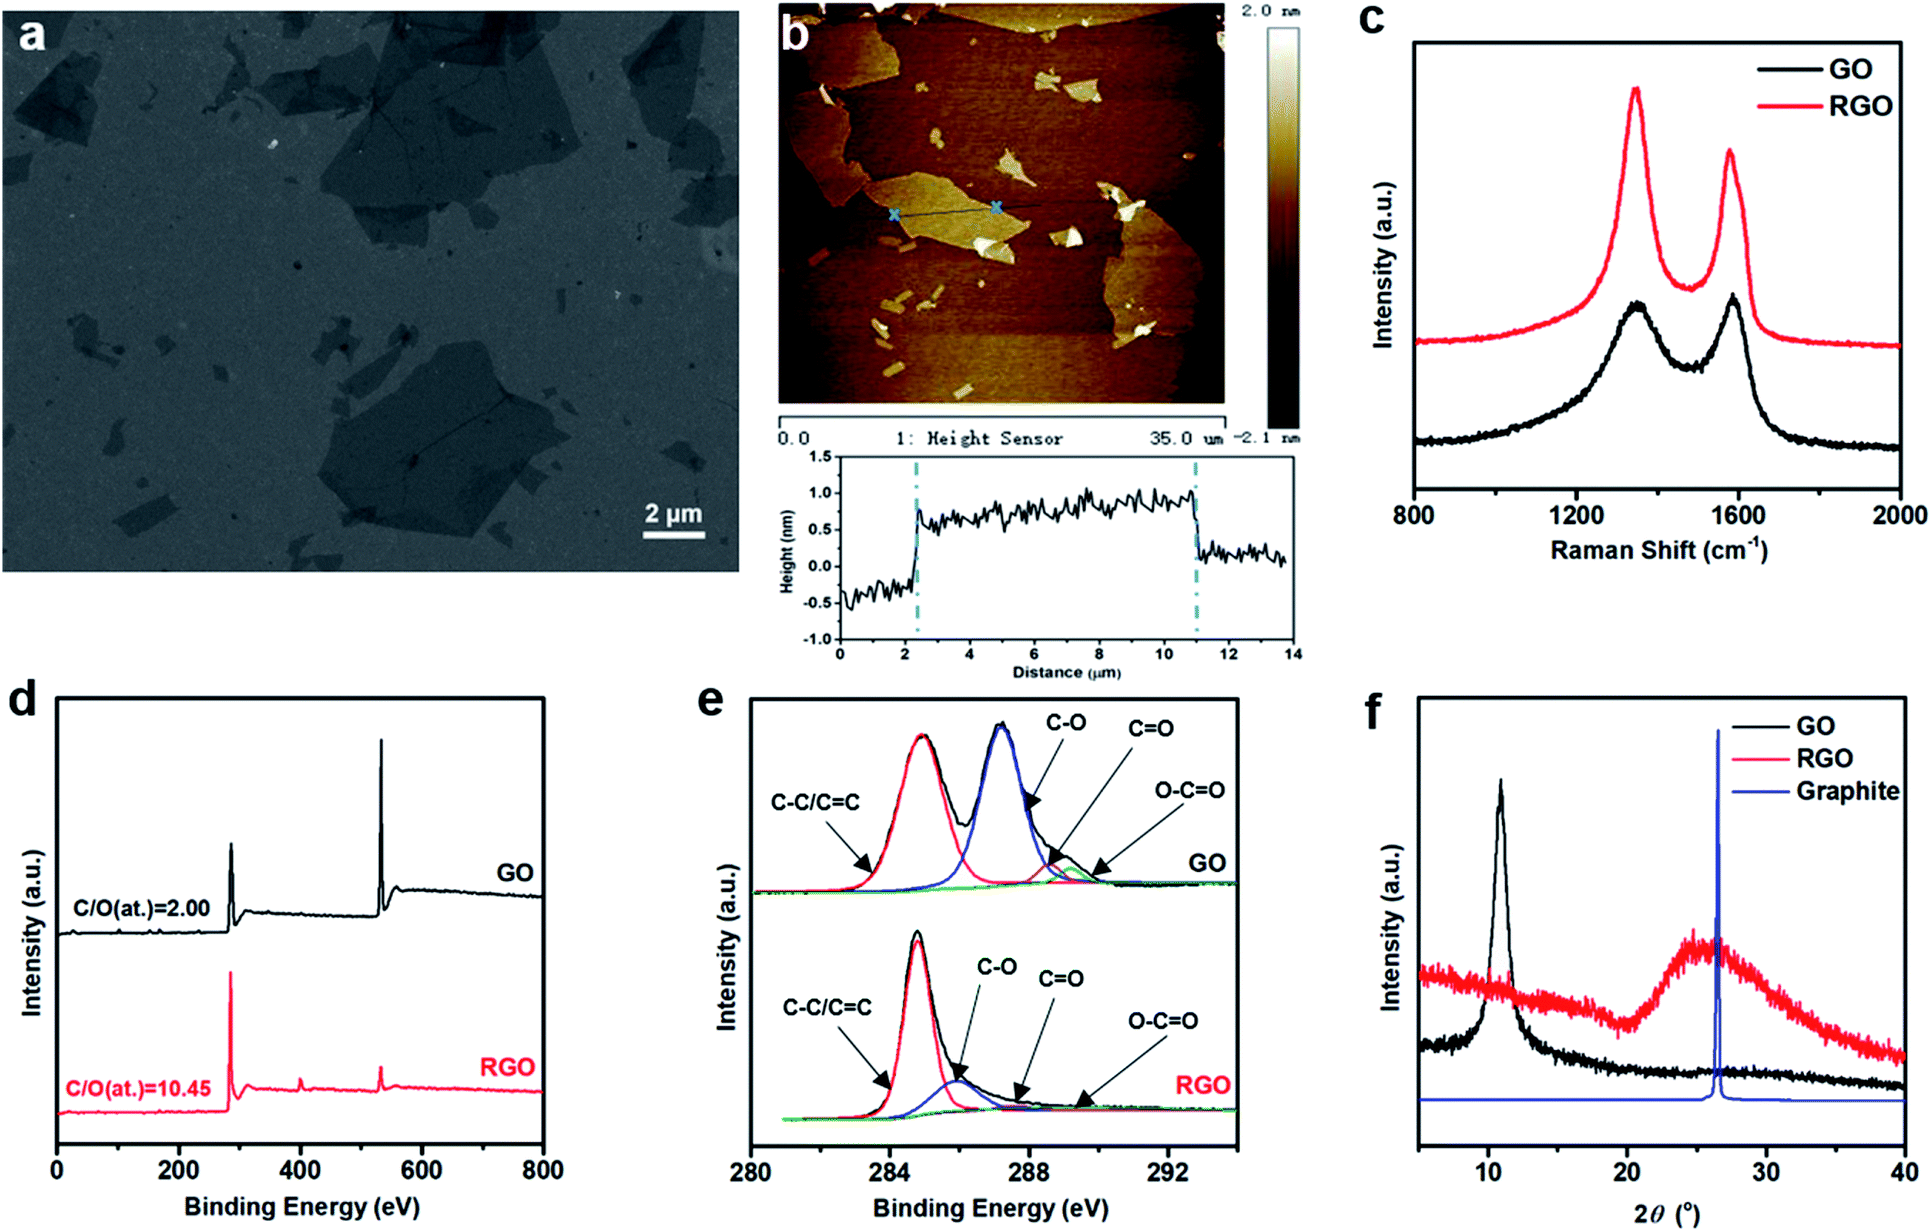 | ||
| Fig. 2 (a) SEM image of the GO sheets, (b) AFM image of the GO sheets, (c) Raman spectra of GO and RGO used for the 3DHG electrode, (d) XPS survey spectrum, (e) C1s XPS spectra, (f) XRD curves of GO, RGO and graphite. | ||
The GO suspensions for 3D printing were obtained by centrifuging the initial GO suspension (12 mg mL−1) with the proper speed and time. To investigate the influence of the suspension concentration on the rheological and 3D printing properties, a series of GO suspensions with the different concentrations, 17.5, 21.5, 25.5, 31.5, 40.0, and 50.0 mg mL−1, was obtained by the different centrifugal rotational speeds and centrifugal time periods as described in the Experimental. These concentrations corresponded to the volume fractions of 0.0133, 0.0164, 0.0194, 0.0240, 0.0306, and 0.0383, respectively. Generally, when concentration of a GO suspension increases, GO sheets with ultralarge aspect ratio will start to form an interconnected network.19,20 Therefore, above a critical concentration, the GO suspension will spontaneously transform into a hydrogel through the physical crosslinkings.42,43 The sol–gel transition is accompanied by loss of the flow ability under gravity, which can be simply demonstrated by test tube inversion experiment.20 The test tube inversion experiment indicated that even for the lowest concentration used here, the GO suspension could form a hydrogel as shown in Fig. S2 (in ESI†), which is consistent with the previous studies.20,42 To fully understand the true nature and processing ability of the hydrogels, the rheological properties of the suspensions were measured by a rotational rheometer as discussed below.
3.2 Rheological properties of the GO suspensions
Fig. 3a gives the dynamic moduli of the GO hydrogels obtained from the strain amplitude sweep measurements to probe the strength of the network of the hydrogels under the oscillatory shear. The strain amplitude γ is varied in the range from 0.01% to 1000% at a frequency of 1 s−1. As shown in the figure, both the storage modulus (G′) and the loss modulus (G′′) of the suspension for each concentration decrease above a critical strain amplitude. This critical value indicates the onset of strain-thinning and the limit of linear viscoelasticity.44 Above this critical strain, the crosslinking structure of the gel breaks down and the values of the dynamic moduli become highly strain sensitive. Although both G′ and G′′ decrease with the strain amplitude increase, G′ shows a more significant decline compared with that of G′′. The crossover of G′ and G′′ corresponds to the gel–liquid transition tending to occur at the high strain.45 For the GO suspensions used in this study, the gel–liquid transition occurs at the strain amplitude around 100%, which shows no obvious dependence on the concentration. Fig. 3b and c show the dynamic frequency sweep in the linear viscoelastic region (LVR) for the rheological measurements. The values of the storage modulus (G′) are always larger than those of the loss modulus (G′′) in LVR. The typical value of the former is an order of magnitude larger than the latter at the corresponding concentration, which indicates that in the linear viscoelastic region, the suspensions behave as the viscoelastic gels or soft glassy materials (SGM).20 Both of G′ and G′′ show a significant increase with the increasing concentration. On one hand, these higher values are favourable for the maintenance of the printed structure, which is required for printing multi-layer 3D architectures. On the other hand, whether such suspensions are feasible for 3D printing need to be clarified by other rheological measurements. The yield stress (the minimum stress needed for the hydrogel to flow), shear rate-dependent viscosity, and recovery of the viscosity to the original value after the shearing flow were then investigated for this purpose. | ||
| Fig. 3 (a) Oscillatory shear measurements on the GO suspensions conducted at a constant frequency of 1 s−1 with the increasing strain amplitude, (b) the storage moduli (G′), (c) the loss moduli (G′′) of the GO suspensions under frequency sweep at a fixed strain of 0.1%. | ||
Fig. 4a shows the steady shear flow curves of the GO suspensions with different concentrations. The GO suspensions behave as a non-Newtonian fluid, showing the shear stress increase with the shear rate for the shear rate () larger than 1 s−1. The rheological behaviour of the GO suspensions upon shearing follows the Herschel–Bulkley equation,46 which can fit data well over a wide range of the shear rate. According to this equation, the relationship between stress (τ) and shear rate () is described by,
|
τ = τ0 + Kn
| (6) |
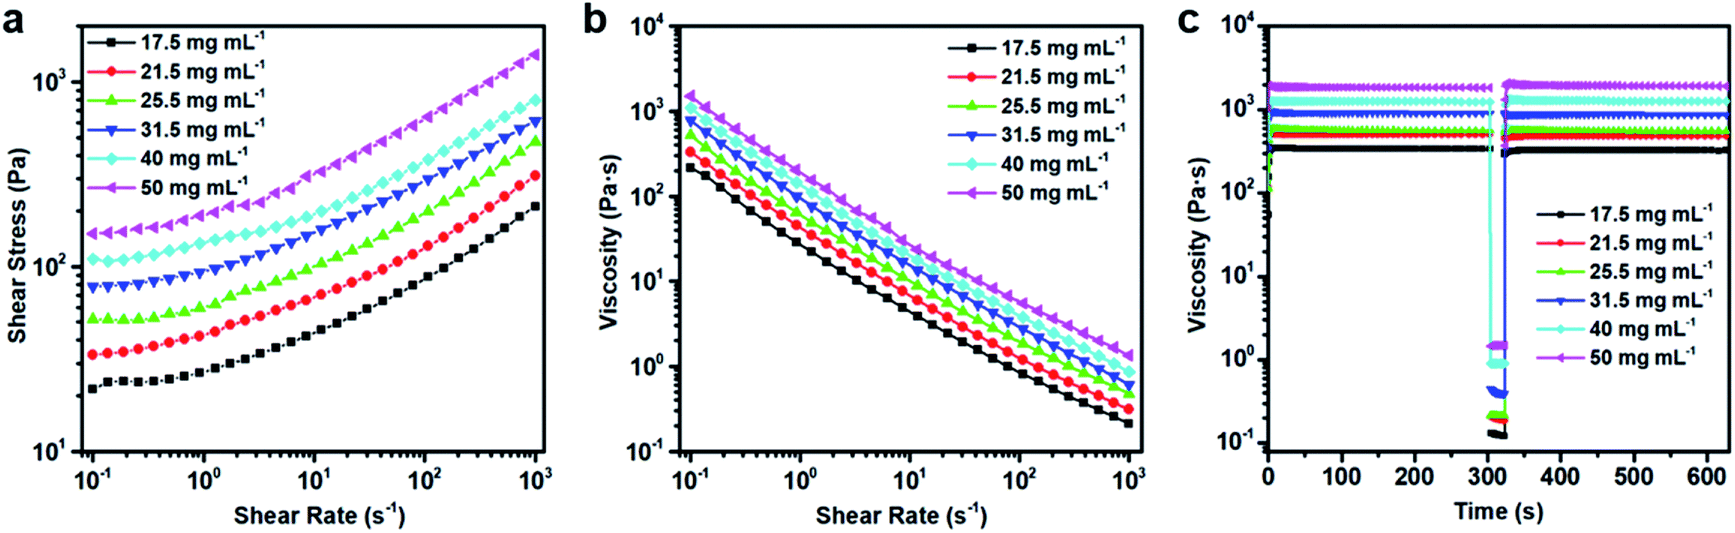 | ||
| Fig. 4 Rheological properties of GO suspensions with the concentrations of 17.5, 21.5, 25.5, 31.5, 40.0, 50.0 mg mL−1, (a) the steady shear flow curves, (b) the viscosity curves, (c) viscosity recovery from a procedure described in the text. | ||
To mimic the shear conditions during the printing, the suspensions were then subjected to a low shear rate of 0.1 s−1 to simulate at-rest conditions prior to extrusion, as the rheometer cannot measure viscosity at true zero-shear. Subsequently, a shear rate of 1000 s−1 was applied to the samples for 20 s to simulate the shear state in the needle tip during extrusion, which will be discussed in Section 3.3 for detail. And finally, a low shear rate of 0.1 s−1 was again applied to measure the recovery of the viscosity. As demonstrated in Fig. 4c, the GO suspensions have high viscosities at the near-zero shear rate and the values increase with the GO concentration at the same shear rate. When the shear rate of 1000 s−1 is applied, the viscosities of the suspensions decrease more than 3 orders, which are consistent with the result given in Fig. 4b. On the other hand, the viscosities of GO suspensions rapidly recover from the low values at the high shear rate (1000 s−1) to the original high values at the near-zero shear rate. It indicates that after extrusion, the GO inks have good stability to maintain the 3D printed structures.
The above rheological measurements indicate that as the shear strain amplitude or the shear rate increases, the gel structure formed by jamming and dispersive attractive interactions breaks down. In this state, GO nanosheets become oriented in the flowed liquid,44 which causes G′ < G′′ and lowers the viscosity of the suspensions significantly. This reversible network structure from the physical interaction with the shear-thinning nature is highly suitable for DIW. On the one hand, the suspensions are printable as a viscous liquid under the shearing force during the extrusion. On the other hand, the quick recovery of the gel properties, such as G′ > G′′ and the high viscosity after cessation of shearing, is desirable to afford the stability of the printed structures for the multi-layer 3D printing. Although the higher the GO ink concentration, the better the stability of the printed structure, a suspension with a too high viscosity can cause the plug in the needle. Therefore, it is necessary to investigate the optimized conditions of the 3D printing with a specific 3D printing instrument through the actual processing process.
3.3 3D printing investigation
The suspensions of the monolayer GO sheets discussed above were tested as the inks for 3D printing. The controllability and stability of the 3D structure printing process depend on the smoothness of the ink extrusion through the needle. For the piston extrusion technique selected in this study, unstable extrusion tends to cause stress accumulation in the material and leads to inaccuracies and uncontrollability of the process, especially for the highly viscous inks. Microfilaments are the basic building blocks of the 3D structure, so the extrusion stability and precision of microfilaments were investigated first to control the structure formation. Following a typical procedure, the extrusion stability was analysed by monitoring the microfilament morphology during the extrusion. Microfilament diameter as a key parameter was used to characterize its extrusion stability and precision, where the oversized diameter is unfavourable to the construction of high-resolution structures.Fig. 5 shows the extrusion morphologies the GO suspensions with the different concentrations for three typical nozzle sizes. The continuous uniform microfilament flowing through the nozzle indicates that the extrusion with the good stability. For the other cases, such as the micro-droplet dropping, intermittent microfilament dropping, and continuous non-uniform microfilament flowing, no good quality microfilaments can be obtained through the extrusion. As shown in the figure, the GO suspensions with the concentrations of 17.5 and 21.5 mg mL−1 are difficult to form uniform microfilament; and as the concentration increases, the extrusion quality is significantly improved. In addition, as the nozzle series number becomes larger (the inner diameter decreases), the diameter of the filament decreases to form the thinner ones from the 3D printing. The 3D printability of the GO suspension is attributed to the gel–liquid transition and shear thinning induced by the sheer stress as revealed by rheological study discussed above. The alignment of the GO sheets in the flow direction can significantly reduce the viscosity over time and cause the stable extrusion through the nozzle. The GO suspensions with the high concentration can maintain the printed structures due to the quick recovery of its gel characteristics after cessation of shearing, which is favourable for printing multi-layer structures with the high accuracy.
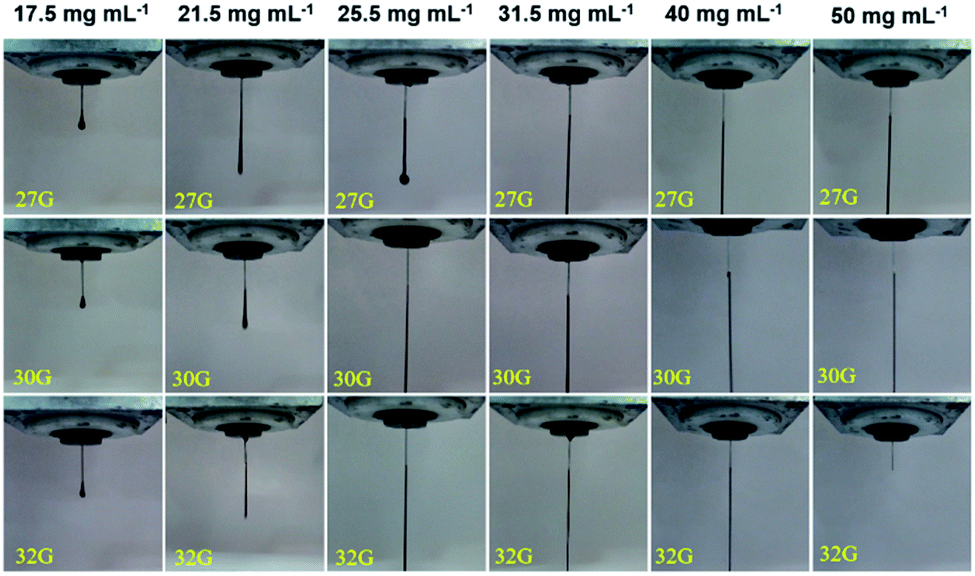 | ||
| Fig. 5 Extrusion experiment results of the GO suspensions with the different concentrations (17.5, 21.5, 25.5, 31.5, 40.0, 50.0 mg mL−1) for three different nozzle sizes (27G, 30G, 32G). | ||
The above rheological study indicates that the GO suspension with the higher concentration has the higher values of the elastic modulus, yield stress and viscosity (Fig. 3 and 4). The higher values of these parameters are beneficial to maintain the printed structure, which are required for printing multi-layer 3D architectures. On the other hand, the higher yield stress and viscosity of the GO suspensions could cause the plug in the needle. Therefore, the concentration suitable for the 3D printing should be selected by considering a compromise between the factors. For 3D printing through 32G nozzle, which has the smallest inner diameter, the concentration of 50.0 mg mL−1 is too higher to form continuous uniform microfilament (Fig. 5). Based on the extrusion morphology observation, the concentration of 40 mg mL−1 was adopted as the representative condition to perform the subsequent studies.
As shown in Fig. 6a, the microfilaments were stacked on the substrate after extrusion from the nozzle. The ideal geometry of the microfilaments should be a standard cylinder, but due to the gravity, the microfilaments usually show certain morphological changes such as flattening and radial deformation, depending on the rheological properties. Generally, the cross section of the microfilaments is treated as an ellipse, whose long axis is taken as the diameter (D) and short axis as the height (h) of the printed filament. The balance of the total material in the 3D printing process is given by,
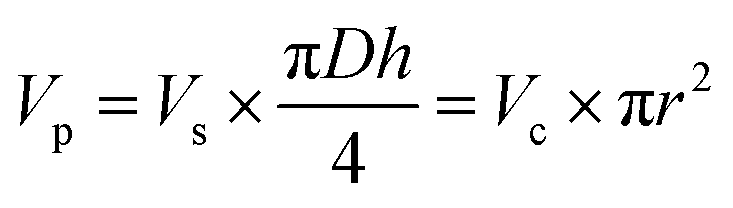 | (7) |
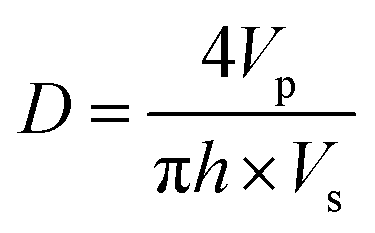 | (8) |
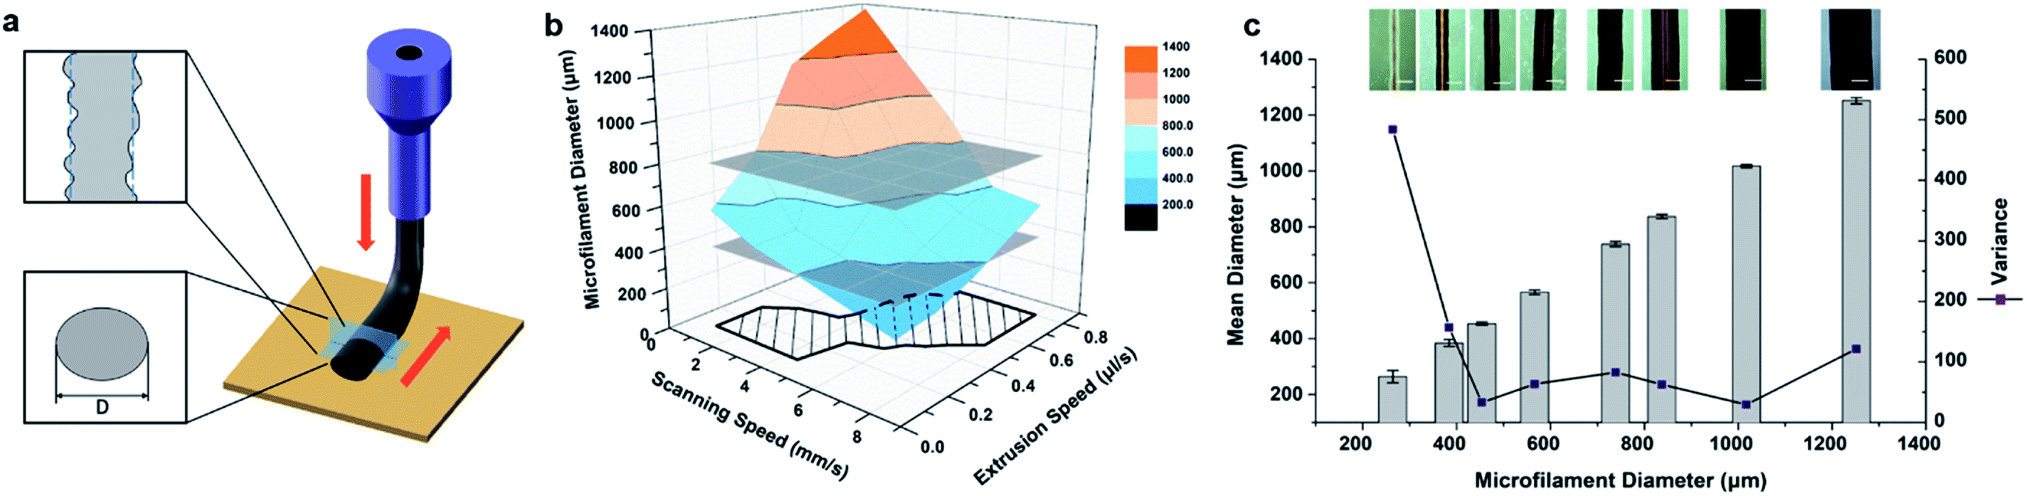 | ||
| Fig. 6 3D printing results of the highly concentrated GO suspensions, (a) morphological changes of the microfilaments after being deposited on the substrate with the flattening and radial deformation; (b) average diameter of microfilaments at different extrusion speeds and scanning speeds (GO concentration of 40 mg mL−1, nozzle size of 32G), shaded area on the plane spanned by the scanning speed and extrusion speed coordinates represents the optimal printing parameter interval; (c) variation in the variance of the diameter data as a function of the microfilament diameter. | ||
Fig. 6b shows the average microfilament diameters as a function of extrusion speed (Vp) and scanning speed (Vs), obtained for each set of printing parameters. As shown by the top-view of the microfilaments (Fig. 6c), the actual sizes of the microfilaments show random variations in the radial direction. Therefore, certain measurement points were selected for each microfilament during the data acquisition. The average value of the microfilament diameter ![[D with combining macron]](https://www.rsc.org/images/entities/i_char_0044_0304.gif) and the variance S2 were then calculated. The larger S2 value, corresponding to the higher dispersity of the diameter, means the microfilament extrusion stability is less satisfied. The result shows that the microfilament diameters vary in the range from 250 to 1350 μm depending on the processing conditions (Fig. 6b). As show in the figure, while the extrusion speed remains constant, the increasing scanning speed results in the decrease of the microfilament diameter. On the other hand, the increasing extrusion speed results in the increase of the microfilament diameter while the scanning speed remains constant. The results are consistent with the calculation with eqn (8). The average diameter and the variance of 8 pieces of the typical microfilaments are shown in Fig. 6c. The average diameters vary in the range from 250 μm to 1200 μm. The variance significantly decreases as the diameter increases in the range of 250–400 μm, which means the printing stability and precision are obviously improved with the diameter in this range. With the diameter further increase, the variance tends to be stable at the low level.
and the variance S2 were then calculated. The larger S2 value, corresponding to the higher dispersity of the diameter, means the microfilament extrusion stability is less satisfied. The result shows that the microfilament diameters vary in the range from 250 to 1350 μm depending on the processing conditions (Fig. 6b). As show in the figure, while the extrusion speed remains constant, the increasing scanning speed results in the decrease of the microfilament diameter. On the other hand, the increasing extrusion speed results in the increase of the microfilament diameter while the scanning speed remains constant. The results are consistent with the calculation with eqn (8). The average diameter and the variance of 8 pieces of the typical microfilaments are shown in Fig. 6c. The average diameters vary in the range from 250 μm to 1200 μm. The variance significantly decreases as the diameter increases in the range of 250–400 μm, which means the printing stability and precision are obviously improved with the diameter in this range. With the diameter further increase, the variance tends to be stable at the low level.
This observation indicates that a larger scanning speed/extrusion speed ratio, corresponding to the small microfilament diameter below 400 μm, will result in uneven distribution of the extruded material and therefore lowering the stability of the microfilament. When the diameters of microfilament diameters are larger than 400 μm, the printing stability becomes better and this condition can meet the requirement for the structural printing with the high size uniformity. On the other hand, due to the need to control the construction for a precise structure, the thicker microfilaments are not conducive to a certain impact on the structural printing-accuracy, so microfilament with diameters over 800 μm are also unsuitable for structural printing. Considering the two limiting conditions, the optimal diameter range of the microfilament was adopted to be 400–800 μm. The extrusion of the GO suspension in this interval is stable, and the high-precision three-dimensional structure can be constructed. As shown in Fig. 6b, the microfilament diameter interval of 400–800 μm corresponds to the optimal region for selecting the extrusion speed (Vp) and scanning speed (Vs) by projecting the diameter interval on the Vp and Vs plane. The scanning speed and extrusion speed in this region are suitable for the construction of precise 3D structures. With these conditions, the good quality GO electrodes were obtained by the 3D printing.
The combination of the good printability of the GO inks and stability of the printed structures can be attributed to their unique rheological properties. During the printing process, the shear rate can be estimated by the following equation,47
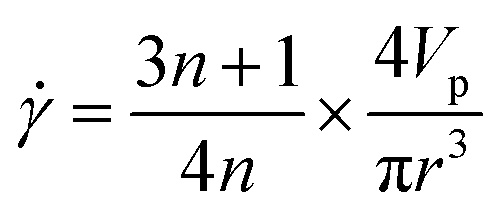 | (9) |
3.4 Morphology and microscopic structure of 3DHG electrodes
The morphology and microscopic structures of the 3DHG electrodes fabricated by the 3D printing were characterized by SEM. Fig. 7a and b show the top-view images of the electrodes with 5 printed layers. The width of a finger electrode is around 600 μm and space between two finger electrodes is 600 μm, which are very close to the sizes of the pre-designed pattern. The internal macro/mesoporous structure of the 3DHG electrodes, which was formed by sublimation of water vapour in the freezing dry process, can be clearly seen in Fig. 7c. Moreover, Fig. 7d, e and f demonstrate the representative cross-section view images of the electrodes with 2, 5, and 8 layers, respectively. As shown in the images, the thickness of each layer is uniform, which proves the stability of the printing process.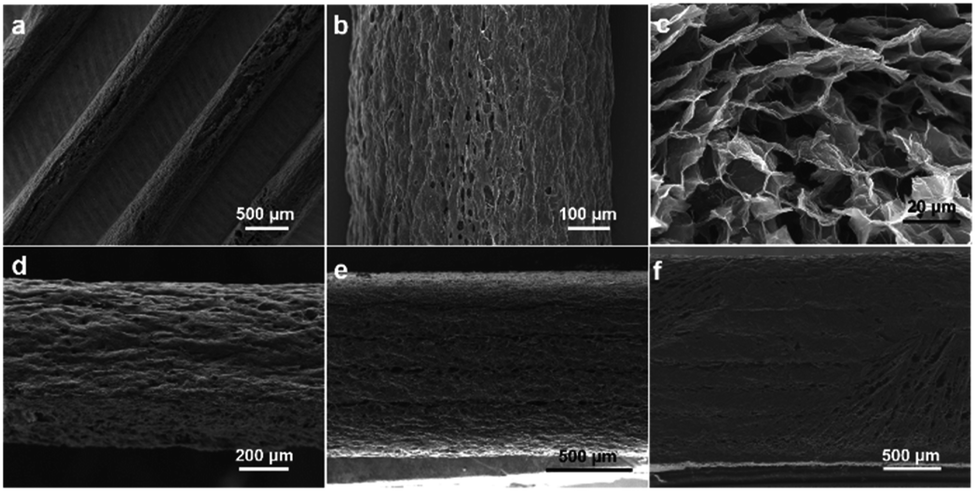 | ||
| Fig. 7 SEM images of the 3DHG electrodes obtained by the 3D printing, (a) the top view of the electrode with 5 printed layers, (b) the magnified top-view image, (c) the internal macro/mesoporous structure of the electrode, (d)–(f) the cross-section images of the printed electrodes with 2 layers (d), 5 layers (e), 8 layers (f), respectively. | ||
Fig. 8 gives the relationship between the number of layers and the electrode thickness. It shows that the average thickness of each electrode layer is 248 μm, which is very close to the pre-designed jumping height of 250 μm. This can be attributed to the printing stability and precision of the highly concentrated GO suspension under optimized processing conditions. Li et al. have studied the relationship between the areal capacitance (Careal) and the number of layers, and found that as the number of layers increased, Careal was doubled at the beginning; but further increasing the number of printed layers, the ability to double the capacitance was substantially impaired.8 The reason is that the more layers the MSC electrode has, the lower the efficiency of electronic transmission will be, due to the increased transmission distance of ions in the medium. As this point was not the focus of the current study, we chose a moderate number of 5 layers to study the device performances, which are presented below.
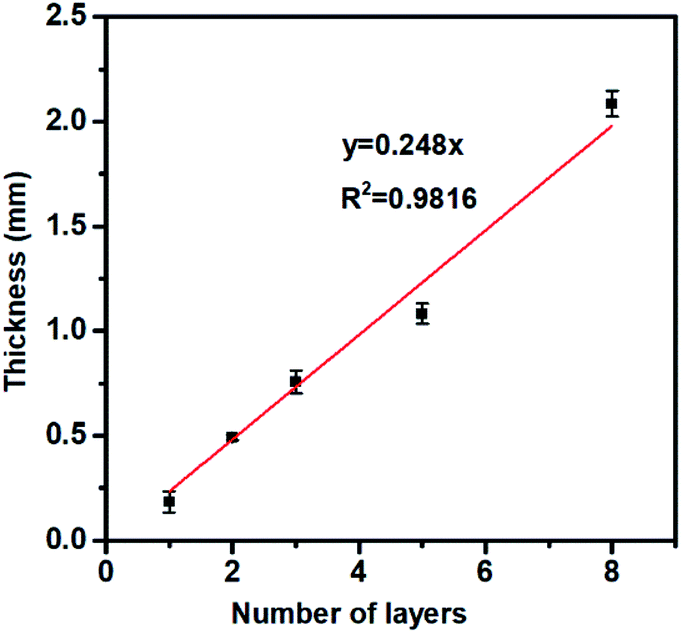 | ||
| Fig. 8 The relationship between of the thickness of the GO electrode and number of the 3D printing layers. | ||
3.5 Electrochemical performances of 3DHG-MSCs
The electrochemical performances of the 3DHG-MSCs, assembled with the RGO electrodes of 5 printed layers and gel electrolyte, were evaluated by using the CV scan, GCD measurement and EIS measurements. The CV curves of our 3DHG-MSC under the different scan rates of 5, 10, 20, 30 and 50 mV s−1 are shown in Fig. 9a. The nearly rectangular shapes at the scan rates ranging from 5 to 50 mV s−1 indicated the ideal electrochemical double-layer capacitive (EDLC) behaviour. Further increasing the scan rate to 100 mV s−1, the CV curves gradually distorted from the ideal rectangular shape (Fig. S3 in ESI†). The Careal values were measured to be 111.1, 73.4 and 49.3 mF cm−2 at the scan rates of 10, 50 and 100 mV s−1 in the tested voltage window (0–1 V), respectively (Fig. S4 in ESI†). The scan rate of 100 V s−1 or even 1000 V s−1 can be reached for the applications of MSCs.48,49 Meanwhile, MSCs have recently been used to supply energy for many small-sized devices, such as microsensors or other microelectronic devices, where energy storage density is identically important. To improve the energetic performances while keeping a low footprint, more active material has to be loaded per unit area of electrode.4 MSCs have also been designed and developed to have 3D electrode architectures.8,50,51 The specific capacitance of these MSCs could exceed 50 mF cm−2, but their scan rate is usually less than 100 mV s−1.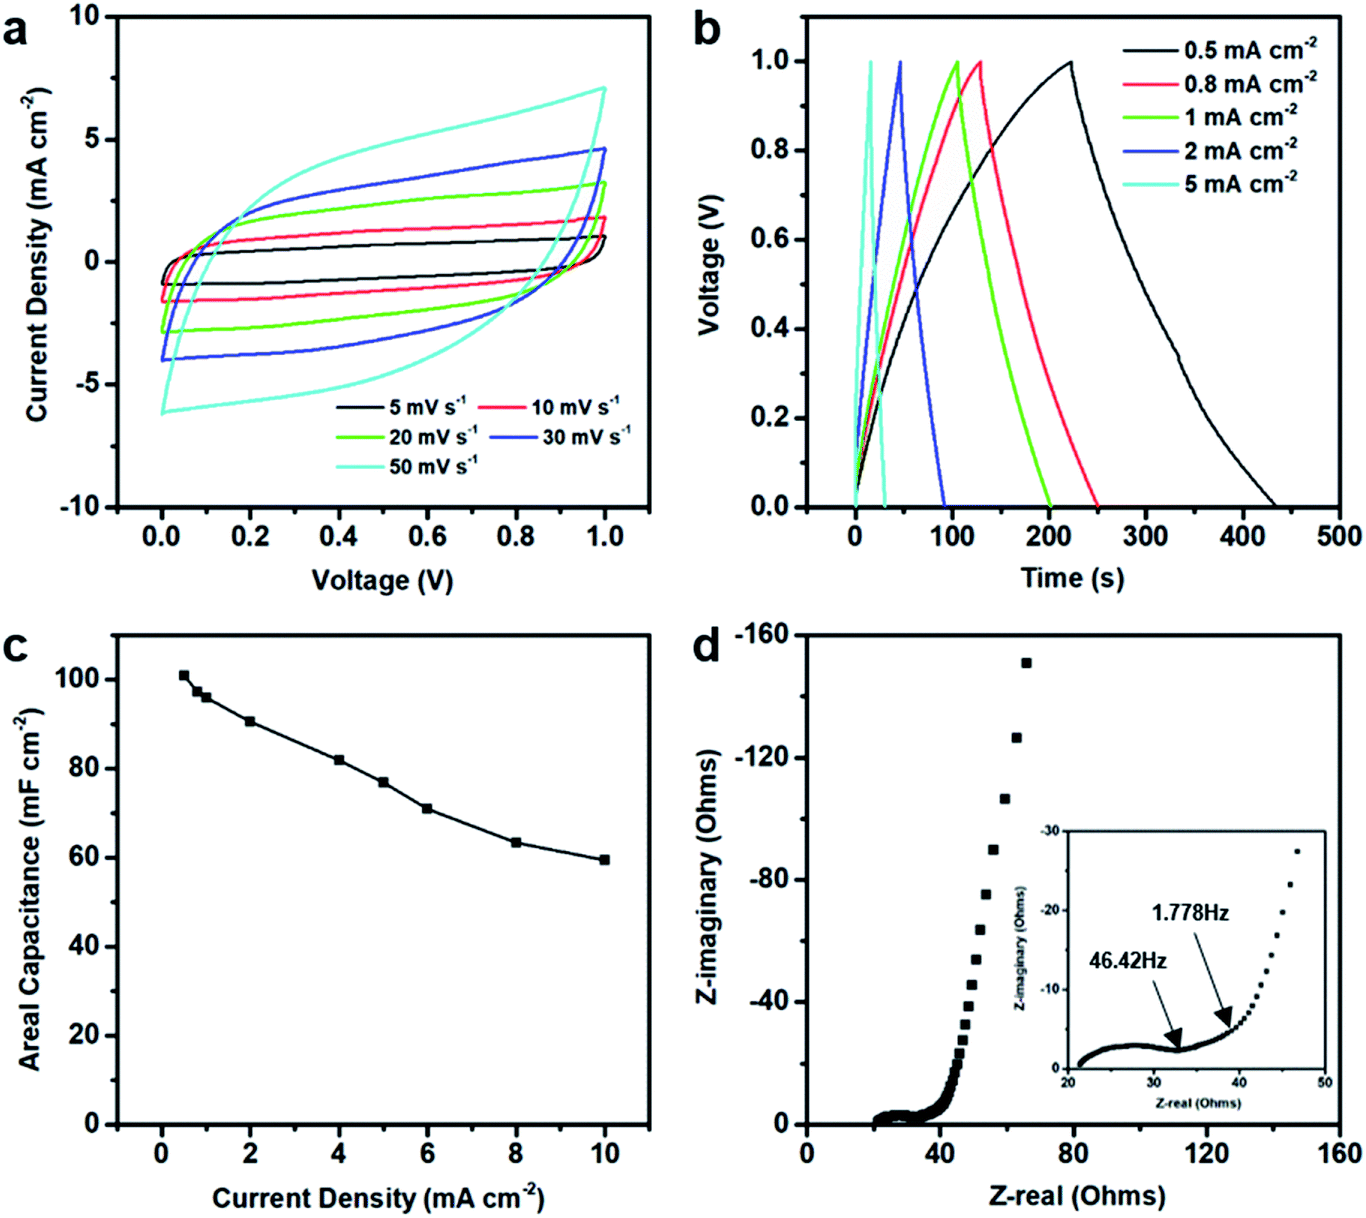 | ||
| Fig. 9 Electrochemical performance of the 3DHG-MSCs with 5 printed layers, (a) CV curves at the scan rates of 5, 10, 20, 30 and 50 mV s−1, (b) GCD curves at the current densities of 0.5, 0.8, 1, 2 and 5 mA cm−2, (c) areal specific capacitances calculated from GCD curves as a function of the current density, (d) Nyquist plots. | ||
Fig. 9b shows the quasi-isosceles triangular GCD curves at the different current densities of 0.5, 0.8, 1, 2, 5 mA cm−2. A small voltage drop (0.2 V) at the high discharge current density (5 mA cm−2) indicates a low internal resistance of the 3DHG-MSC, which is highly desirable for the energy storage devices.52–54 The Careal values calculated from the GCD curves are shown in Fig. 9c. The Careal values of the 3DHG-MSC are 101.0 mF cm−2 at the current density of 0.5 mA cm−2, and 76.8 mF cm−2 at the current density of 5 mA cm−2, respectively. There is about 60% retention even at the high current density of 10 mA cm−2. The maximal Careal values, calculated from both CV curves and GCD curves as shown above, are higher than most reported values of all-solid-state graphene MSCs (Table S2 in ESI†).8,34,55–58 The Careal values are higher than those of the other 3D printed graphene MSCs with the interdigitated architecture or sandwich structure, where most of those MSC were obtained by the laser-irradiation assisted methods. The maximal Careal value of this study is 5 times higher than the value of a planar MSC printed through micro-extrusion process.58 This is because the highly concentrated GO suspension as the ink used here warrants a large mass loading of the active material in per unit area. In addition, multiple layers and the internal macro/mesoporous structure of the 3DHG electrodes make more pathways for ion permeation in the graphene networks. Our 3DHG-MSCs with about 5 mg cm−2 graphene loading have a Cmass value of 20.2 F g−1 at 0.1 A g−1 (Fig. S5 in ESI†), which is higher than other 3D printed graphene MSCs with interdigitated architecture.8 The Cvolumetric of the 3DHG-MSC is 0.81 F cm−3 at a current density of 4 mA cm−3 (Fig. S6 in ESI†), which is close to that of the 3D printed graphene supercapacitor with a sandwich structure.54 However, although the Careal value is hundreds of times higher than that of the thin-film graphene MSCs, the Cvolumetric is much lower than that of the latter.49,59,60 This is due to the macroporous structure in the 3D electrodes occupying too much of the volumes of the electrodes than the thin-film electrodes. Several papers have reported that this limitation can be overcome by designing composite inks or functionalized graphene scaffolds loaded with pseudo-capacitive materials.44,61,62
The EIS measurement was implemented to further understand the resistance and capacitive behaviour of the in-plane microsupercapacitors. Fig. 9d shows the Nyquist plot of the 3DHG-MSC. The internal cell resistance estimated from the x-intercept of the Nyquist plot is only 21.38 Ω, indicating the relatively high electrical conductivity (90 S m−1) of the 3DHG electrode. The high-/middle-frequency regions exhibit a quasi-semicircle and a 45° Warburg region. A small diameter semicircle and the relatively short Warburg region (from 1.778 to 46.42 Hz) for the 3DHG-MSC display the low charge-transfer resistance and relatively fast ion diffusion in the open-pore graphene network. In the low frequency region, the plot is a steep straight line, indicating an excellent capacitive behaviour.
Above results suggest that there is a comparatively low charge transfer resistance and relatively efficient electrolyte transport channels within the interdigitated electrodes of 3DHG-MSCs. The high areal performance is attributed to the ink with the high concentration, which results in the electrodes with a large mass loading of the active material per unit area. Meanwhile, the internal macro/mesoporous structure obtained for the GO hydrogel is also play an important role, which is in line with the previous observations.63–65 Fig. S7 (in ESI†) shows that the 3DHG-MSC retains 94.5% of its initial capacitance after 10000 charge/discharge cycles. The coulombic efficiency after 10000 cycles is around 98%, which further confirm their ideal EDLC behaviour.
4. Conclusion
In summary, we prepared a 3D hierarchical porous RGO MSC via direct 3D printing by using the highly concentrated GO suspensions as the inks, which is proved to have advantages of no additive, more effective use of the substances, and printing at room temperature. It was found that the inks have the rheological characteristics of gel and viscous liquid, where the gel–liquid transition depends on the shear rate and shear strain amplitude. In the extrusion and printing process, the inks show the significant shear thinning and rapid viscosity recovery, which are all desire for DIW. Moreover, the inks have the relatively high storage modulus and yield stress as the concentration increases, which can ensure the stability of the printed structure for multi-layer printing. The optimal concentration range of the GO suspensions and proper needle size were determined from the 3D printing, based on the comprehensive study of the feasibility for 3D printing, structure precision, and optimizing electrode function. Through the investigation on the smoothness of the extrusion, controllability and stability of the actual printing process, the appropriate scanning speed and extrusion speed region were determined to construct the precise 3D structure. The obtained 3D printed RGO MSCs with interdigitated architecture exhibited the high areal specific capacitance owing to more effective materials loading per unit area and the hierarchical porous structures of the RGO electrodes. The fabricated all-solid-state 3D MSCs achieved a high areal specific capacitance of 101 mF cm−2 at a current density of 0.5 mA cm−2, and the capacitance of 111 mF cm−2 at a scan rate of 10 mV s−1, which are higher than most of the all-solid-state MSCs using carbon-based materials reported until now. The desirable rheological properties of the highly concentrated GO suspension and optimized processing parameters of 3D printing are critically important to contribute to the feasible fabrication and excellent performance of the energy storage devices.Conflicts of interest
There are no conflicts of interest to declare.Acknowledgements
This work was supported by the NSFC under project 51773108, 51233002 and 31771108. The authors thank PhD candidate Xinghao Li for assistance with gold-plated processing. The authors also thank Dr Li Wei for assistance and helpful discussions.Notes and references
- M. Beidaghi and Y. Gogotsi, Energy Environ. Sci., 2014, 7, 867–884 RSC.
- J. Ren, L. Li, C. Chen, X. Chen, Z. Cai, L. Qiu, X. Zhu and H. Peng, Adv. Mater., 2013, 25, 1155–1159 CrossRef CAS PubMed.
- K. Sun, T. S. Wei, B. Y. Ahn, J. Y. Seo, S. J. Dillon and J. A. Lewis, Adv. Mater., 2013, 25, 4539–4543 CrossRef CAS PubMed.
- N. A. Kyeremateng, T. Brousse and D. Pech, Nat. Nanotechnol., 2017, 12, 7–15 CrossRef CAS PubMed.
- C. Zhao, Y. Liu, S. Beirne, J. Razal and J. Chen, Adv. Mater. Technol., 2018, 3, 1800028 CrossRef.
- H. Zhang, Y. Cao, M. O. L. Chee, P. Dong, M. Ye and J. Shen, Nanoscale, 2019, 11, 5807–5821 RSC.
- Z. S. Wu, X. Feng and H. M. Cheng, Natl. Sci. Rev., 2013, 1, 277–292 CrossRef.
- W. Li, Y. Li, M. Su, B. An, J. Liu, D. Su, L. Li, F. Li and Y. Song, J. Mater. Chem. A, 2017, 5, 16281–16288 RSC.
- M. F. El-Kady, V. Strong, S. Dubin and R. B. Kaner, Science, 2012, 335, 1326–1330 CrossRef CAS PubMed.
- T. J. Ober, D. Foresti and J. A. Lewis, Proc. Natl. Acad. Sci. U. S. A., 2015, 112, 12293–12298 CrossRef CAS PubMed.
- K. Fu, Y. Wang, C. Yan, Y. Yao, Y. Chen, J. Dai, S. Lavey, Y. Wang, J. Wan, T. Li, Z. Wang, Y. Xu and L. Hu, Adv. Mater., 2016, 28, 2587–2594 CrossRef CAS PubMed.
- A. K. Geim, Science, 2009, 324, 1530–1534 CrossRef CAS PubMed.
- Y. Yao, K. K. Fu, C. Yan, J. Dai, Y. Chen, Y. Wang, B. Zhang, E. Hitz and L. Hu, ACS Nano, 2016, 10, 5272–5279 CrossRef CAS PubMed.
- Y. Jiang, Z. Xu, T. Huang, Y. Liu, F. Guo, J. Xi, W. Gao and C. Gao, Adv. Funct. Mater., 2018, 28, 1707024 CrossRef.
- S. Stankovich, D. A. Dikin, G. H. B. Dommett, K. M. Kohlhaas, E. J. Zimney, E. A. Stach, R. D. Piner, S. B. Nguyen and R. S. Ruoff, Nature, 2006, 442, 282–286 CrossRef CAS PubMed.
- D. A. Dikin, S. Stankovich, E. J. Zimney, R. D. Piner, G. H. B. Dommett, G. Evmenenko, S. B. Nguyen and R. S. Ruoff, Nature, 2007, 448, 457–460 CrossRef CAS PubMed.
- G. Eda and M. Chhowalla, Adv. Mater., 2010, 22, 2392–2415 CrossRef CAS PubMed.
- C. Cheng and D. Li, Adv. Mater., 2013, 25, 13–30 CrossRef CAS PubMed.
- S. Naficy, R. Jalili, S. H. Aboutalebi, R. A. Gorkin III, K. Konstantinov, P. C. Innis, G. M. Spinks, P. Poulinc and G. G. Wallace, Mater. Horiz., 2014, 1, 326–331 RSC.
- B. Konkena and S. Vasudevan, J. Phys. Chem. C, 2014, 118, 21706–21713 CrossRef CAS.
- K. Shehzad, Y. Xu, C. Gao and X. Duan, Chem. Soc. Rev., 2016, 45, 5541–5588 RSC.
- B. Mendoza-Sánchez and Y. Gogotsi, Adv. Mater., 2016, 28, 6104–6135 CrossRef PubMed.
- W. Wei, S. Yang, H. Zhou, I. Lieberwirth, X. Feng and K. Müllen, Adv. Mater., 2013, 25, 2909–2914 CrossRef CAS PubMed.
- D. Yu, K. Goh, H. Wang, L. Wei, W. Jiang, Q. Zhang, L. Dai and Y. Chen, Nat. Nanotechnol., 2014, 9, 555–562 CrossRef CAS PubMed.
- X. Cao, Z. Yin and H. Zhang, Energy Environ. Sci., 2014, 7, 1850–1865 RSC.
- R. Raccichini, A. Varzi, S. Passerini and B. Scrosati, Nat. Mater., 2015, 14, 271–279 CrossRef CAS PubMed.
- Z. Niu, L. Liu, L. Zhang, Q. Shao, W. Zhou, X. Chen and S. Xie, Adv. Mater., 2014, 26, 3681–3687 CrossRef CAS PubMed.
- B. G. Choi, M. H. Yang, W. H. Hong, J. W. Choi and S. H. Yun, ACS Nano, 2012, 6, 4020–4028 CrossRef CAS PubMed.
- R. L. Truby and J. A. Lewis, Nature, 2016, 540, 371–378 CrossRef CAS PubMed.
- A. E. Jakus, E. B. Secor, A. L. Rutz, S. W. Jordan, M. C. Hersam and R. N. Shah, ACS Nano, 2015, 9, 4636–4648 CrossRef CAS PubMed.
- C. Zhu, T. Y. Han, E. B. Duoss, A. M. Golobic, J. D. Kuntz, C. M. Spadaccini and M. A. Worsley, Nat. Commun., 2015, 6, 6962 CrossRef CAS PubMed.
- E. Garcia-Tunon, S. Barg, J. Franco, R. Bell, S. Eslava, E. D'Elia, R. C. Maher, F. Guitian and E. Saiz, Adv. Mater., 2015, 27, 1688–1693 CrossRef CAS PubMed.
- Q. Zhang, F. Zhang, S. P. Medarametla, H. Li, C. Zhou and D. Lin, Small, 2016, 12, 1702–1708 CrossRef CAS PubMed.
- X. W. Yun, Z. Y. Xiong, L. Tu, L. Bai and X. G. Wang, Carbon, 2017, 125, 308–317 CrossRef CAS.
- Z. Y. Xiong, X. W. Yun, B. Tang and X. G. Wang, Carbon, 2016, 107, 548–556 CrossRef CAS.
- S. J. Li, Z. Xiong, X. H. Wang, Y. N. Yan, H. X. Liu and R. J. Zhang, J. Bioact. Compat. Polym., 2009, 24, 249–256 CrossRef CAS.
- J. A. Lewis, Adv. Funct. Mater., 2006, 16, 2193–2204 CrossRef CAS.
- A. Ambrosi and M. Pumera, Chem. Soc. Rev., 2016, 45, 2740–2755 RSC.
- K. N. Kudin, B. Ozbas, H. C. Schniepp, R. K. Prud'homme, I. A. Aksay and R. Car, Nano Lett., 2008, 8, 36–41 CrossRef CAS PubMed.
- F. Tuinstra and J. L. Koenig, J. Chem. Phys., 1970, 53, 1126–1130 CrossRef CAS.
- A. V. Murugan, T. Muraliganth and A. Manthiram, Chem. Mater., 2009, 21, 5004–5006 CrossRef CAS.
- Z. Y. Xiong, X. W. Yun, L. Qiu, Y. Y. Sun, B. Tang, Z. J. He, J. Xiao, D. Chung, T. W. Ng, R. Zhang, X. G. Wang and D. Li, Adv. Mater., 2019, 31, 1804434 CrossRef PubMed.
- P. Kumar, U. N. Maiti, K. E. Lee and S. O. Kim, Carbon, 2014, 80, 453–461 CrossRef CAS.
- K. S. Vasu, R. Krishnaswamy, S. Sampath and A. K. Sood, Soft Matter, 2013, 9, 5874–5882 RSC.
- C. Vallés, R. J. Young, D. J. Lomax and I. A. Kinloch, J. Mater. Sci., 2014, 49, 6311–6320 CrossRef.
- X. Huang and M. H. García, J. Fluid Mech., 1998, 374, 305–333 CrossRef.
- C. W. Peak, J. Stein, K. A. Gold and A. K. Gaharwar, Langmuir, 2018, 34, 917–925 CrossRef CAS PubMed.
- D. Pech, M. Brunet, H. Durou, P. Huang, V. Mochalin, Y. Gogotsi, P. Taberna and P. Simon, Nat. Nanotechnol., 2010, 5, 651–654 CrossRef CAS PubMed.
- Z. S. Wu, K. Parvez, X. Feng and K. Müllen, Nat. Commun., 2013, 4, 2487–2494 CrossRef PubMed.
- J. Pu, X. Wang, T. Zhang, S. Li, J. Liu and K. Komvopoulos, Nanotechnology, 2015, 27, 045701 CrossRef PubMed.
- K. Shen, J. Ding and S. Yang, Adv. Energy Mater., 2018, 8, 1800408 CrossRef.
- J. Hu, Z. Kang, F. Li and X. Huang, Carbon, 2014, 67, 221–229 CrossRef CAS.
- Y. Zhu, S. Murali, M. D. Stoller, K. J. Ganesh, W. Cai, P. J. Ferreira, A. Pirkle, R. M. Wallace, K. A. Cychosz, M. Thommes, D. Su, E. A. Stach and R. S. Ruoff, Science, 2011, 332, 1537–1541 CrossRef CAS PubMed.
- T. Y. Kim, G. Jung, S. Yoo, K. S. Suh and R. S. Ruoff, ACS Nano, 2013, 7, 6899–6905 CrossRef CAS PubMed.
- C. Zhu, T. Liu, F. Qian, T. Y. Han, E. B. Duoss, J. D. Kuntz, C. M. Spadaccini, M. A. Worsley and Y. Li, Nano Lett., 2016, 16, 3448–3456 CrossRef CAS PubMed.
- J. B. In, B. Hsia, J.-H. Yoo, S. Hyun, C. Carraro, R. Maboudian and C. P. Grigoropoulos, Carbon, 2015, 83, 144–151 CrossRef CAS.
- M. Wu, Y. Li, B. Yao, J. Chen, C. Li and G. Shi, J. Mater. Chem. A, 2016, 4, 16213–16218 RSC.
- G. Sun, J. An, C. K. Chua, H. Pang, J. Zhang and P. Chen, Electrochem. Commun., 2015, 51, 33–36 CrossRef CAS.
- Z.-K. Wu, Z. Lin, L. Li, B. Song, K.-S. Moon, S.-L. Bai and C. Wong, Nano Energy, 2014, 10, 222–228 CrossRef CAS.
- M. F. El-Kady and R. B. Kaner, Nat. Commun., 2013, 4, 1475 CrossRef PubMed.
- L. Li, J. Zhang, Z. Peng, Y. Li, C. Gao, Y. Ji, R. Ye, N. D. Kim, Q. Zhong, Y. Yang, H. Fei, G. Ruan and J. M. Tour, Adv. Mater., 2016, 28, 838–845 CrossRef CAS PubMed.
- Z. S. Wu, K. Parvez, S. Li, S. Yang, Z. Liu, S. Liu, X. Feng and K. Müllen, Adv. Mater., 2015, 27, 4054–4061 CrossRef CAS PubMed.
- D. W. Wang, F. Li, M. Liu, G. Q. Lu and H. M. Cheng, Angew. Chem., Int. Ed. Engl., 2008, 47, 373–376 CrossRef CAS PubMed.
- Z. Y. Xiong, C. L. Liao and X. G. Wang, J. Mater. Chem. A, 2014, 2, 19141–19144 RSC.
- Z. Y. Xiong, C. L. Liao, W. H. Han and X. G. Wang, Adv. Mater., 2015, 27, 4469–4475 CrossRef CAS PubMed.
Footnotes |
| † Electronic supplementary information (ESI) available. See DOI: 10.1039/c9ra04882k |
| ‡ Both authors contributed equally to this work. |
| This journal is © The Royal Society of Chemistry 2019 |