
 Open Access Article
 This Open Access Article is licensed under a Creative Commons Attribution-Non Commercial 3.0 Unported Licence
Core–shell architecture based on bio-sourced porous carbon: the shape formation mechanism at the solid/liquid interface layer†
Anfar Zakaria *abc,
Jada Amanebc and
El Alem Noureddinea
*abc,
Jada Amanebc and
El Alem Noureddinea
aMaterials and Environment Laboratory, Ibn Zohr University, Agadir, 8000, Morocco. E-mail: Zakaria.anfar@uha.fr; Tel: +21255530757
bMulhouse Materials Science Institute – CNRS, University Haute Alsace, F-68100, Mulhouse, France
cUniversity of Strasbourg, Strasbourg, F-67081, France
First published on 15th August 2019
Abstract
The overall goal of this work was to activate agri-food wastes by microbial action, which makes it possible to produce bio-digestate and energy (methane). The resulting bio-digestate could be transformed to porous carbon (PC), which was used for the preparation of core–shell particles with alginate (bio-polymer) and a calcium ion layer. Furthermore, surface charge measurements showed electrostatic attractions occurring between the alginate, calcium (Ca2+) ions and the PC, hence leading to the formation of core (PC)–shell (alginate–calcium ions) particles. However, in the absence of calcium ions, no electrostatic attractions were observed between the PC and the alginate. In the dried state (using scanning electronic microscopy analysis (SEM)) and in the hydrate state (using numerical microscopy), the designed core–shell architecture was confirmed. Transmission electron microscopy (TEM) shows that the PC particles were graphitic and porous. In addition, both Raman spectroscopy (RS) and X-ray photoelectron spectroscopy (XPS) showed the presence of several chemical functions, in particular hydroxyl (–O–H) and carboxylic groups (–COO–H). In aqueous media, the results showed that the PC was negatively charged and its surface charge and particle size were found to be very sensitive to the variation in pH. Finally, the core–shell particles were used as an adsorbent for the removal of methylene blue (MB), crystal violet (CV) and congo red (CR) molecules from wastewater. The overall data indicated efficient dye removal, without the occurrence of the solid/liquid separation problem.
1. Introduction
Over the last few years, human activities have allowed the increase in toxic industrial effluents, irrespective of their sources. These contaminants result in various diseases and disorders in the ecosystem,1–3 as they are easily accumulated in living organisms and dispersed into aquatic systems. As an example, in Morocco, agri-food industries are a major consumer of water and the largest producers of pollution, and this is characterized by their higher COD and microorganism content.4 Therefore, it is necessary to remove these contaminants in order to prevent hazardous health effects in human beings. Many techniques including adsorption and anaerobic digestion have been used to degrade these pollutants.5–18 However, these techniques are generally limited when applied separately, requiring coupling and/or hybrid processes.5To better understand the complexity of agri-food waste treatment based on single techniques, the anaerobic digestion process (AD) was taken as an example. In the AD process, the degradation of agri-food wastes to bio-methane (75%) was performed using microorganisms under certain temperature and pressure conditions, and this technique was highly recommended for these types of waste in terms of energy production.4 Nevertheless, the resulting bio-digestate remains the big problem of the AD process. In fact, the production of methane gas from agri-food wastes does not mean that the problem has been solved, but unexpectedly, the bio-product could also be toxic to the environmental media. Recently, researchers around the world have found ways to reduce this problem by converting the digestate into carbonaceous materials (e.g. Biochar, activated carbon and char).19–22 Indeed, they considered that the physicochemical properties of the bio-digestate could become suitable for the preparation of functional carbonaceous materials after microbial action using the AD process. Then, these carbonaceous materials were used for environmental remediation (in most cases the carbonaceous materials have been used as adsorbents).23 In fact, adsorption using porous materials is crucial for applications relating to the environment due to their large specific surface area and physicochemical properties.24
The two main problems related to carbonaceous materials produced by digestate are their regeneration and the solid/liquid phase separation. So, the objective of the present work was to use the raw bio-digestate of agri-food organic waste to produce porous carbon, which was then used as a basic matrix to prepare core–shell particles based on the bio-polymer alginate and Ca2+ ions. These core–shell particles finally allowed both problems relating to material regeneration and phase separation to be solved.
During the preparation and utilization of the prepared core–shell particles, several chemical interactions occurred between several functional groups of the various components (carbon, alginate and Ca2+) that are involved. The study of these interactions will be fruitful for a good understanding of the solid/liquid surface reactions, and for elucidating the core–shell mechanism formation as well as the mechanism of the removal of the pollutants from wastewater, especially as very few articles in the literature deal with these interactions in more detail. For these reasons, powerful surface characterizations and interface techniques were used.
The experimental section of the present work began by the preparation of the PC from the bio-digestate derived from agri-food organic waste. Then, the physicochemical, structural and morphological properties of this material were evaluated on two levels: in the hydrated and dried states. After determining these properties, the PC was then used to prepare core–shell particles with the use of alginate and calcium. The procedure used is described and the mechanism of formation of the particles is discussed based on the characterization techniques in the dispersed medium. Finally, the efficiencies of the final particles to eliminate toxic pollutants and to solve the problem of the solid/liquid phase separation have been evaluated and discussed.
2. Experimental section
2.1. Chemical reagents and preparation of aqueous solutions
The reagents used in this work were: NaOH (Sigma-Aldrich, >95%), HCl (Sigma-Aldrich, >37%), methylene blue (Sigma-Aldrich, dye content >82%), H2SO4 (Sigma-Aldrich, 99.99%), alginate (Sigma-Aldrich, primary grade), distilled water (laboratory grade), CaCl2 (Sigma-Aldrich, >99%), and cethyltrimethyl ammonium chloride (CTACl) (Sigma-Aldrich, 25 wt% in H2O). The aqueous dispersions used in this work were prepared and placed in glass vials and kept for potential use. The PC solution (0.12 g L−1) was prepared using 6 mg of PC mixed with 50 mL of distilled water and then ultrasonicated for 10 min. Adjustment of the pH was performed by adding small amounts of NaOH (0.1 M) and HCl (0.1 M) aqueous solutions. The alginate solution (1 g L−1) was elaborated using 1 g of alginate mixed with 1 L of distilled water and then stirred for 6 h. CaCl2 (0.1 M) and CTACl solutions (6.25 × 10⁻⁴ M) were prepared from dilution of 1 M stock solutions.2.2. Preparation of PC
The experimental protocol that was followed to prepare the PC can be counted in several stages. Initially, four agri-food organic waste materials were methanized in a mesophilic system at 38 ± 1 °C for 72 h, followed by 13 days of stabilization. Then, the residue (bio-digestate) was dried at 100 °C for 24 hours and washed with tap water several times. After this, the filtrate was chemically activated using sulfuric acid, H2SO4 (pH = 2), with 12 hours of stirring. The final product was filtered, washed with water and ethanol, and finally dried at 100 °C for 24 hours. In the last step (thermal activation), the filtrate was placed in a furnace at a heating rate of 5 °C min−1 under nitrogen for 3 h. In the present work, eight treatment temperatures ranging from 200 to 600 °C were investigated. The optimum temperature was chosen to be at 350 °C. Indeed, in both temperature treatments at 200 and 250 °C, a small amount of leaching of the PC was observed during the adsorption of methylene blue (MB) as a model. For the temperature treatment performed at 300 °C, the prepared material was thermally stable and the removal of MB reached a maximum value of 100% with an initial concentration of 50 mg L−1 (Fig. 1).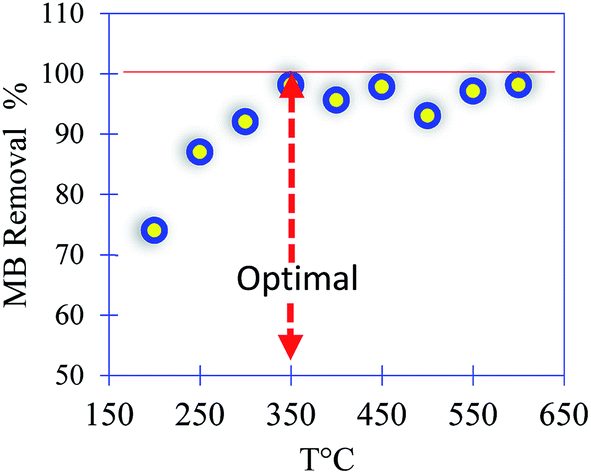 | ||
| Fig. 1 MB removal efficiency versus the temperature of treatment of the PC. | ||
2.3. Design of the core (PC)–shell (alginate–calcium) particles: PC@alginate
The core (PC)–shell (alginate–calcium) particles used in this work were prepared as follows: 1 g of alginate powder was dissolved in 100 mL of distilled water with 6 hours of stirring, then, 1 g of PC was added and the mixture was stirred for 2 hours followed by 30 min of sonication (Sonimasse 150 TS, 20 kHz, sonicating power output of 160 W). In addition, a solution of CaCl2 with a known concentration was placed in a crystallizer and kept under low stirring (30 rpm). The preparation of PC@alginate was ensured by mixing both solutions using a pump with a speed of 20 mL h−1. Indeed, when each droplet of the PC@alginate solution was brought into contact with the Ca2+ ions, a capsule membrane was instantly formed with the carboxylic groups of the alginate, and the PC was immobilized inside. Finally, the capsules were washed with distilled water and stored in aqueous medium (Fig. 2). The core–shell particles were labelled as PC@alginate.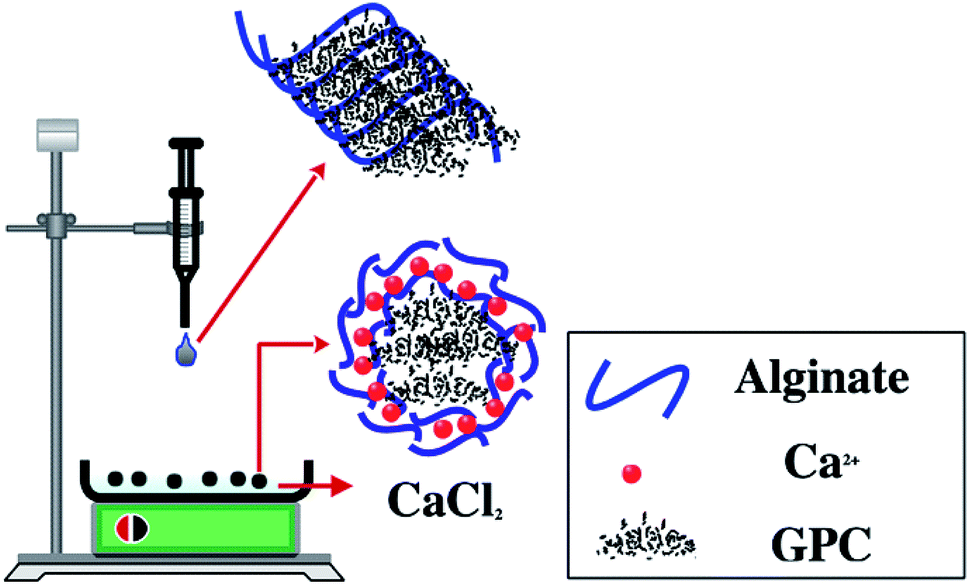 | ||
| Fig. 2 Experimental protocol for (carbonaceous) core–shell (alginate–calcium ions) particle preparation. | ||
2.4. Solid/liquid interface characterization
The curve representing the surface potential variation as a function of the amount of the cethyltrimethyl ammonium chloride (CTACl) surfactant added, mainly shows the interaction that occurs between the negatively charged PC surface sites and the positively charged CTACl head groups. The resulting titration curve of the PC by the CTACl surfactant finally reflects the surface electrical properties of the PC. The Müteck PCD 02 apparatus was used for monitoring the titration curve of the PC by the CTACl surfactant. This apparatus allowing the PC surface potential measurements, contained a cylindrical chamber and a piston made of poly(tetrafluoroethylene).25 Thus, 10 mL of the PC aqueous suspension (0.12 g L−1, dispersed under ultrasound for 10 min) was first placed in the space (0.5 mm) between the cylindrical chamber wall and the piston. Thereafter, at each minute, a given amount of the aqueous CTACl solution was added and the potential was measured between the two electrodes placed inside the cylindrical chamber. Since the PCD 02 apparatus allows measurements of relative potential values, to avoid data disparity, the obtained surface potential was then normalized to its maximum magnitude. The measurements of the particle sizes of the PC in aqueous dispersion as a function of pH variation were performed by Dynamic Light Scattering (DLS), using Coulter Model N4S (Coultronics) apparatus that operates with a 4 mW helium–neon laser (wavelength = 632.8 nm) and an optical system that detects at a 90° angle the light scattered by the sample, as described elsewhere.26,27 The measurements of the PC zeta potentials were carried out at ambient temperature with a Zetaphoremeter II model Z3000 purchased from SEPHY, as described elsewhere.252.5. Characterization techniques in the dried state
Transmission Electron Microscopy (TEM) analyzes were done using a Philips CM 200, operating at an accelerating voltage of 20–200 kV and with a magnification ranging from ×10![[thin space (1/6-em)]](https://www.rsc.org/images/entities/char_2009.gif) 000 to ×200000. The PC was analyzed using a scanning electron microscope FEI, Model Quanta 400. The equipment used to perform the various Raman analyzes was a spectrometer Horiba model LabRAM BX40, using a CCD detector, a laser line of 532 nm and a 100× objective lens with a laser power of 1.6 mW. Moreover, X-ray Photoelectron Spectroscopy (XPS) was carried out using a Thermo Fisher Scientific ESCALAB 250Xi X-ray photoelectron spectroscopy system equipped with an Al Kα X-ray source = 1486.7 eV to study the surface chemical compositions of the synthesized PC samples. Confocal microscopy (Axio Imager M2 LSM 700 ordered by the ZEN 2012 software) was used to confirm the designed core–shell adsorbent. X-ray diffraction patterns were collected on a PANalytical MPD X'Pert Pro diffractometer, operating with Cu Kα radiation (Kα = 0.15418 nm), equipped with an X'Celerator real-time multiple strip detector (active length = 2.12° 2θ). The powder patterns were collected at 295 K in the range 5° < 2θ < 90°, with step = 0.017° 2θ, and time/step = 220 s.
000 to ×200000. The PC was analyzed using a scanning electron microscope FEI, Model Quanta 400. The equipment used to perform the various Raman analyzes was a spectrometer Horiba model LabRAM BX40, using a CCD detector, a laser line of 532 nm and a 100× objective lens with a laser power of 1.6 mW. Moreover, X-ray Photoelectron Spectroscopy (XPS) was carried out using a Thermo Fisher Scientific ESCALAB 250Xi X-ray photoelectron spectroscopy system equipped with an Al Kα X-ray source = 1486.7 eV to study the surface chemical compositions of the synthesized PC samples. Confocal microscopy (Axio Imager M2 LSM 700 ordered by the ZEN 2012 software) was used to confirm the designed core–shell adsorbent. X-ray diffraction patterns were collected on a PANalytical MPD X'Pert Pro diffractometer, operating with Cu Kα radiation (Kα = 0.15418 nm), equipped with an X'Celerator real-time multiple strip detector (active length = 2.12° 2θ). The powder patterns were collected at 295 K in the range 5° < 2θ < 90°, with step = 0.017° 2θ, and time/step = 220 s.
2.6. MB molecule removal experiments
The removal tests of dyes molecules from aqueous solution using the PC@alginate particles were conducted using a batch system. The effects of pH on the adsorption of dyes onto PC@alginate were investigated using 40 mL (10 mg L−1) at different pHs (3–12). The pH of the solution was adjusted by adding small amounts of HCl (0.1 M) and NaOH (0.1 M) aqueous solutions to various PC@alginate dispersions. The effects of the initial dye concentration (5–40 mg L−1) were evaluated using 25 mg of PC@alginate and 40 mL aqueous solution of the dyes. Finally, the mixture was easily separated using a previously cleaned spatula, and the equilibrium concentration of MB was analyzed by a UV-vis spectrophotometer. The removal efficiency and adsorption capacity at equilibrium were calculated as follows:
 | (1) |
 | (2) |
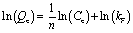
In order to investigate the adsorbent reusability, eight cycles of adsorption–desorption were carried out using 25 mg of PC@alginate loaded with dyes, with 20 mL of HCl (0.1 M) and NaOH (0.1 M) with 30 min of agitation. To fit the isotherm data, Langmuir and Freundlich equations were used (eqn (3) and (4)).2,28–31
 | (3) |
 | (4) |
3. Results and discussion
3.1. Characterization of prepared material in the dried state
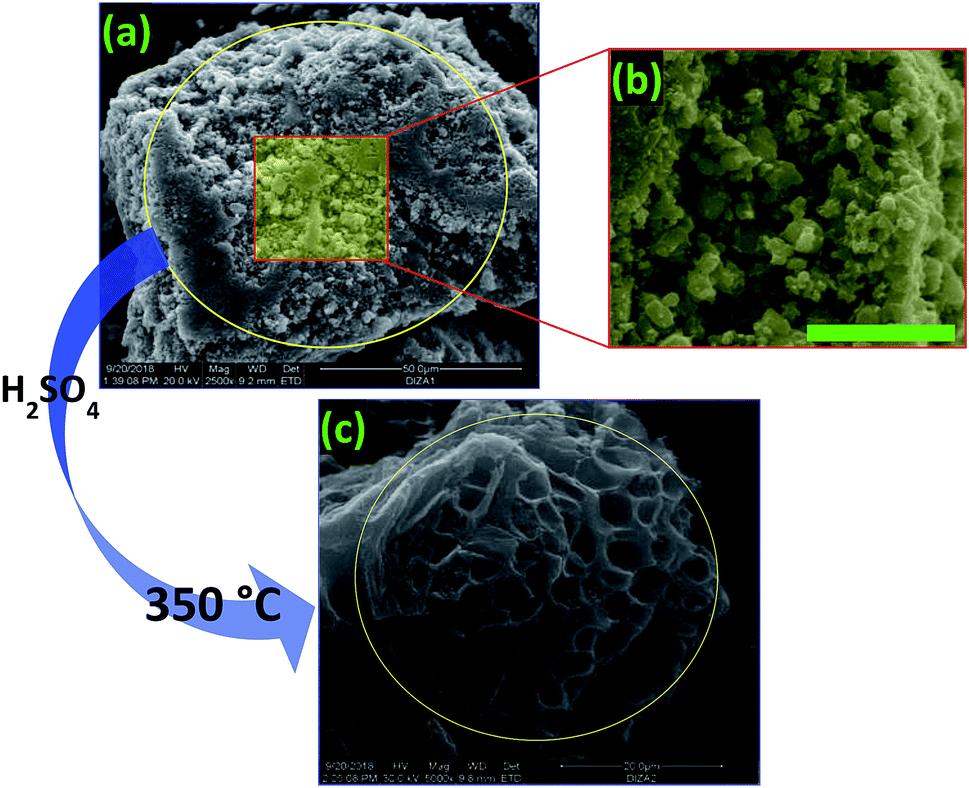 | ||
| Fig. 3 (a) and (b) SEM images of the raw digestate, and (c) an SEM image of the prepared PC. | ||
Micrographs of typical areas of PC at 20 nm are shown in Fig. 4a and b. As can be observed in these figures, the PC has a disordered microporous structure, and is made up of arranged curved graphene layers.32,33 Furthermore, numerous graphene sheets with different dimensions and shapes are clearly observed, that are at 5 Å spacings, which allow the creation of micropores.33,34 However, the PC exhibits a much lower packing density of carbon sheets in some regions (more compact structure) and not in others.35 Finally, we can see in Fig. 4a and b that the TEM images confirm the amorphous structure of our material, with graphite layers being observed as is already reported in some works.36 From Fig. 4c, we can observe the characteristic planes of amorphous carbon around 20–25 2θ and the region of 40–45 2θ degree.37,38 The XRD analysis shows an amorphous phase of the PC adsorbent by the presence of characteristic peaks of graphite (around 26 2θ) and activated carbon, and this confirms the chemical carbonaceous structure of our prepared sample.
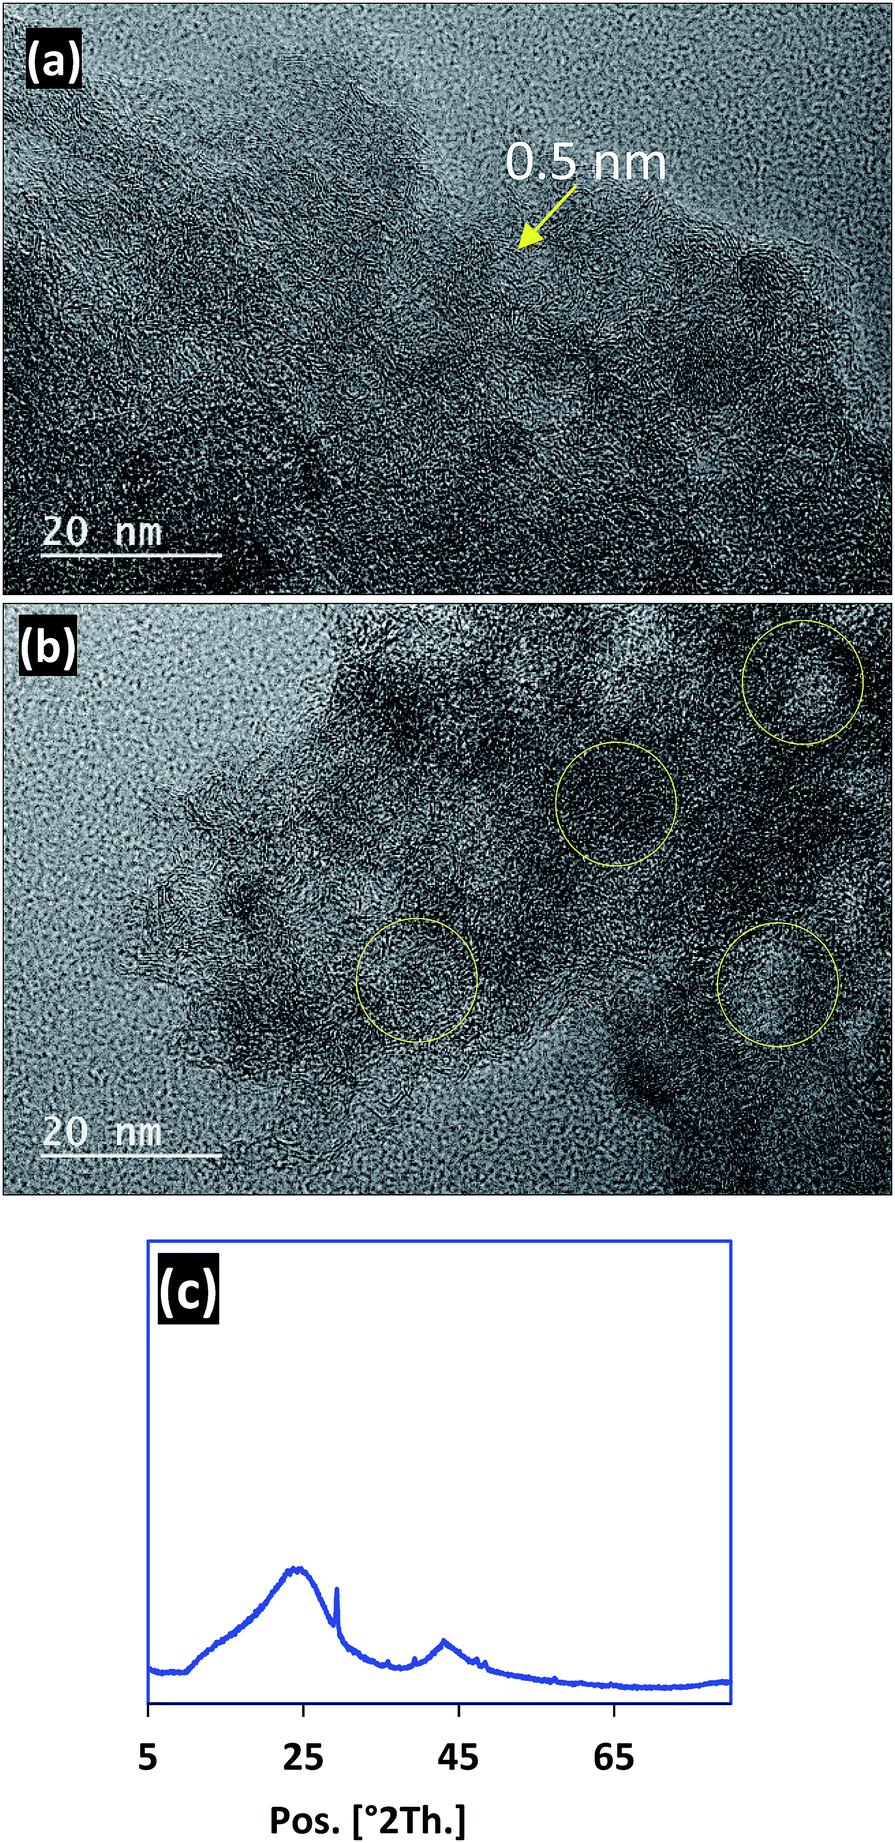 | ||
| Fig. 4 (a) and (b) TEM images of the prepared PC and (c) the XRD spectrum of the prepared PC. | ||
![[double bond, length as m-dash]](https://www.rsc.org/images/entities/char_e001.gif) O bonds. The sp2-bonded carbon atoms were detected at 284.99 eV, C–OH broad peaks were confirmed at 286.2 eV and CO bonds were observed at 288.45 eV.2,29,39 The deconvolution of the O1s band shows three crests at 530, 532 and 533 eV, which can be attributed to the O atoms in phenolic and ether compounds, the carbonyl oxygen atom in anhydrides and lactones, and the oxygen atom in carboxylic acid groups, respectively.40,41 Nevertheless, impurities were detected in the PC structure related to the starting biomass and the reagents used for the preparation of the PC.
O bonds. The sp2-bonded carbon atoms were detected at 284.99 eV, C–OH broad peaks were confirmed at 286.2 eV and CO bonds were observed at 288.45 eV.2,29,39 The deconvolution of the O1s band shows three crests at 530, 532 and 533 eV, which can be attributed to the O atoms in phenolic and ether compounds, the carbonyl oxygen atom in anhydrides and lactones, and the oxygen atom in carboxylic acid groups, respectively.40,41 Nevertheless, impurities were detected in the PC structure related to the starting biomass and the reagents used for the preparation of the PC.
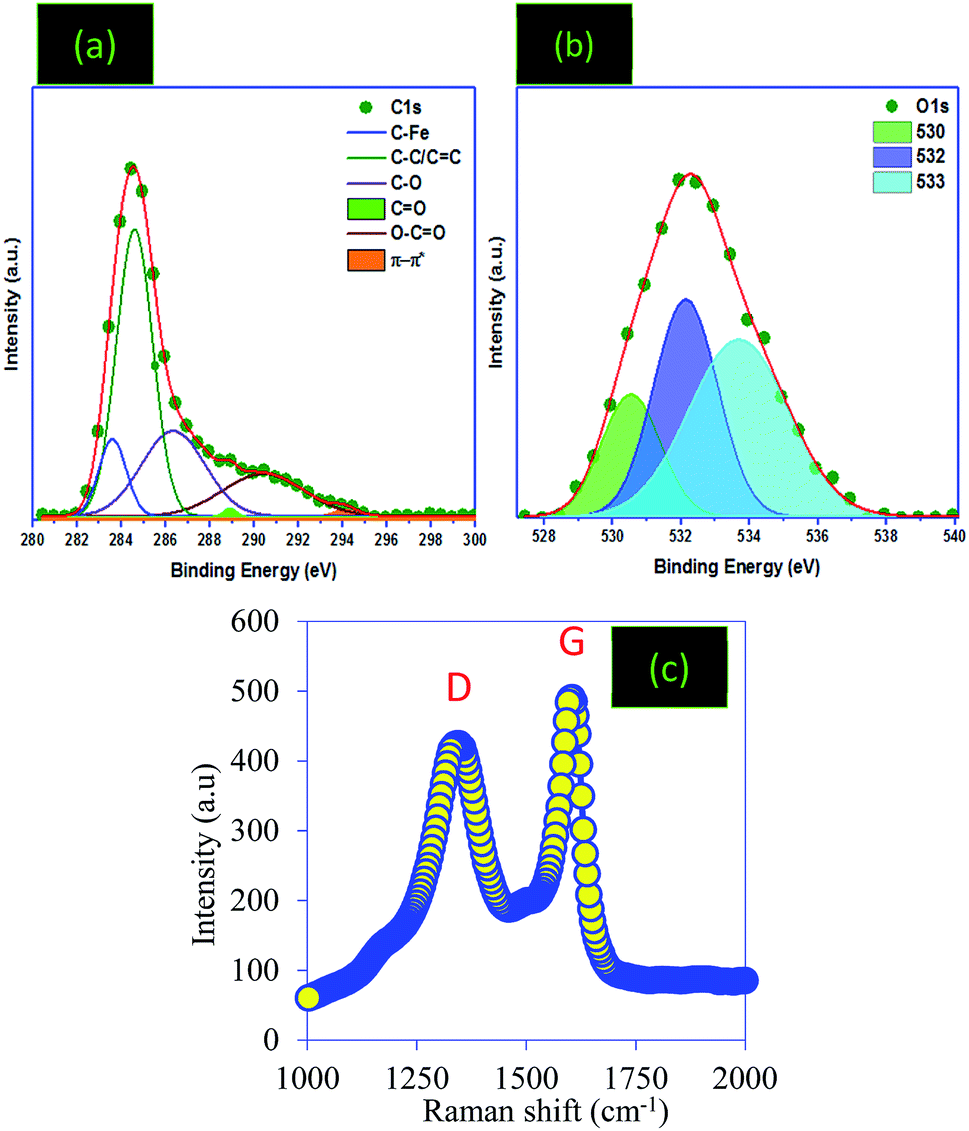 | ||
| Fig. 5 (a) and (b) XPS and (c) Raman analysis of the PC material. | ||
As a tool to investigate the functionalization and graphitization of the surface of the PC, Raman analysis was used (Fig. 5d). The results showed that the PC sample presents two broad bands at 1355.22 and 1604.89 cm−1, noted D (disorders) and G (graphitic), respectively.2 The G band is related to the stretching vibrations of sp2 carbon atoms in the long carbon chains in graphite or the carbon ring. The D band, however, is assigned to the defection of the crystalline structure and disorder arrangement, which gives low symmetry and defects.42,43 In addition, the relative intensity between IG/ID was used to calculate the average crystallite size “La”, which shows the structural disorder degree and hence informs us about the size of the graphitic domains of the prepared PC.44,45 The same results have been found in reported works aimed at the preparation of carbon materials.46,47
3.2. Characterization of prepared material in the hydrate state
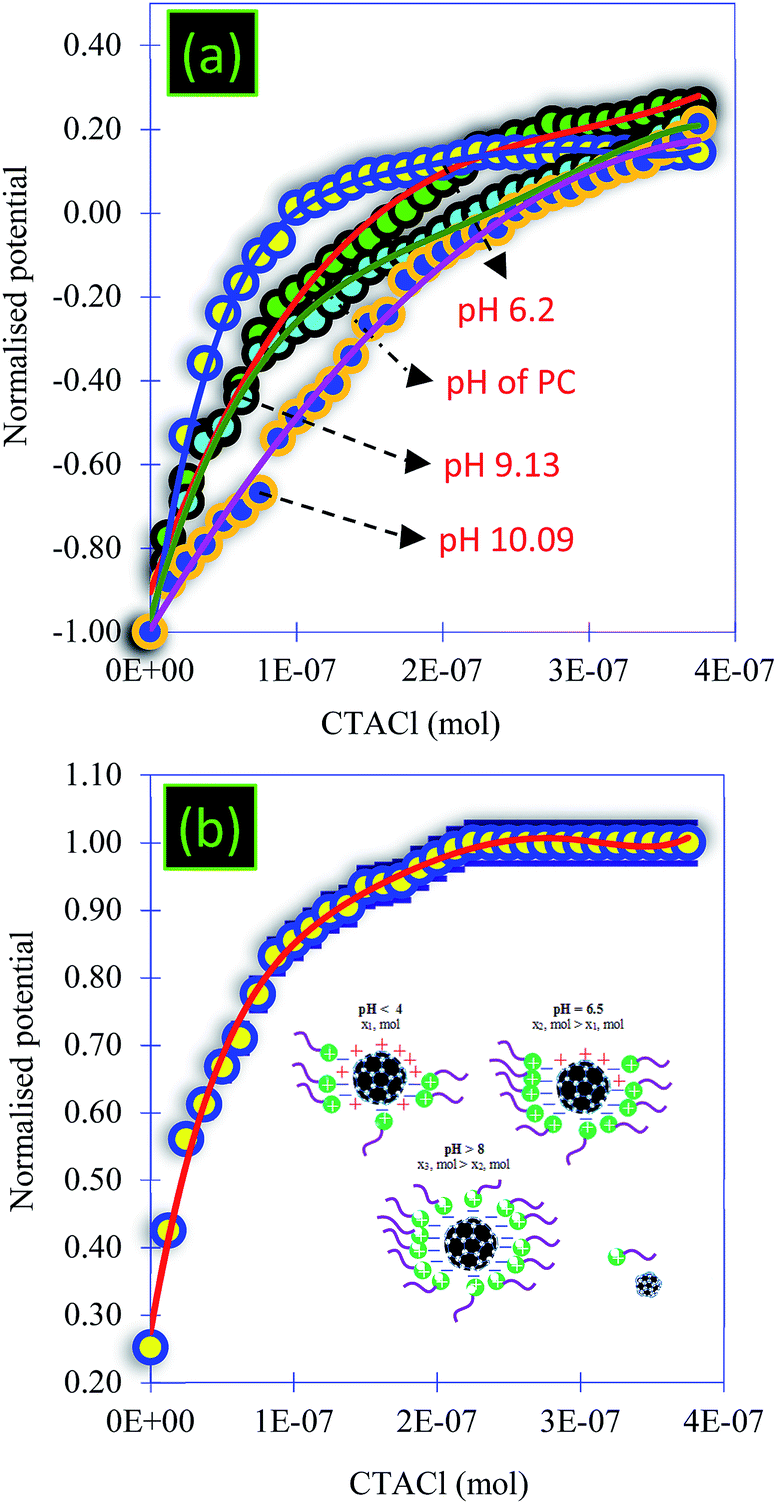 | ||
| Fig. 6 (a) Titration of the PC solution at different pHs using CTACl (6.25 × 10⁻⁴ M) and (b) titration of the PC solution at acidic pH using CTACl (6.25 × 10⁻⁴ M). | ||
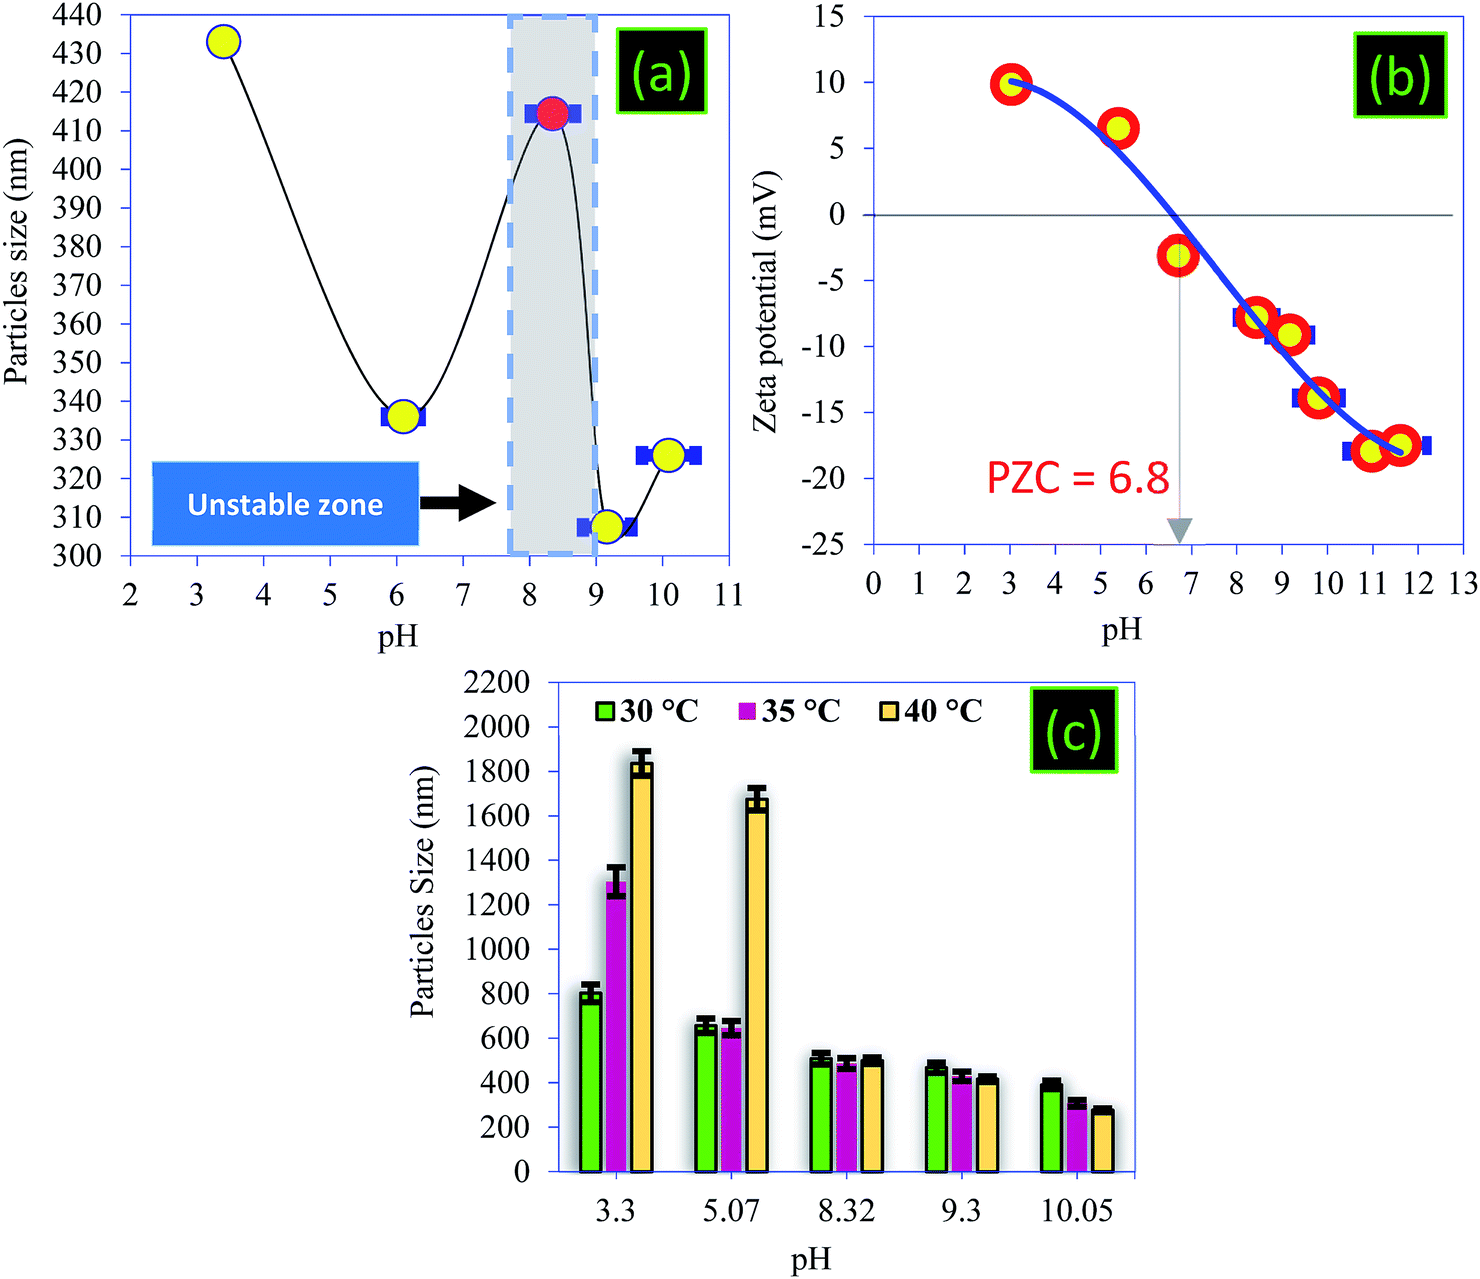 | ||
| Fig. 7 (a) Particle mean size as a function of pH, (b) zeta potential of the PC, and (c) particle mean size as a function of temperature. | ||
Note that the PZC is an important parameter for characterizing the pH of a solid surface and ensuring colloidal stability.48,49 By definition, the PZC refers to the pH value at which the magnitude of the negative and the positive surface charges are equal. In this work, the surface charge of the PC was characterized using zeta-potential measurements as a function of pH in the range of pH 3–11 (Fig. 7b). As shown in Fig. 7b, the isoelectric points were located at pH 6.9, indicating that the surface charge of the PC has a positively charged surface below this value, while it has a negatively charged surface above it. The PC carbon powder showed positive zeta-potential values below about pH 3, indicating the coexistence of positively charged groups at the surface of the particles with less negatively charged oxygen groups (–COOH and –OH), and this coincides with other work.50,51 As we have already shown by surface charge detector measurements, the PZC confirmed that the surface of PC at the natural pH was negatively charged due to the introduction of oxygen-containing functional groups. We note that the variation in the electrical surface potential of the PC particles as a function of pH can be useful for the control of the desorption and the regeneration of PC.48
The variation in the size of the particles with the temperature was studied and the temperature control was provided by a thermocouple immersed in the measuring cell (Fig. 7c). The influence of temperature on the particle size of PC can be summarized in two main points:
• When the pH < PZC, an increase in temperature favors an increase in particle size, and this increase is very high where the pH < 3.
• When the pH > PZC, an increase in temperature favors a decrease in particle size up to a value equal to 276 nm, recorded at 40 °C.
The peak observed at 20 °C (Fig. 7a) gradually disappears when the temperature increases. Indeed, the sizes become larger in acidic medium, which prevents the influence of this unstable zone on the particle size. These results show that the highest yields of removal of BM and CV dyes will be recorded at alkaline pH and at higher temperatures, which is not the case in acidic conditions. As a result, the particle size decreases, resulting in an increase of the surface area of the PC.
3.3. Chemical mechanism of the formation of the core–shell particles
Despite the high performance of PC to remove pollutants (due to a developed porous structure and the presence of surface functions), the problem of separation of both liquid and solid phases is still apparent. To solve this problem, PC has been used as a matrix for preparing core–shell particles that are used to remove toxic dyes from aqueous solutions. Before running the adsorption experiments using core–shell particles, the formation process of these particles was investigated using the measurements of the surface charges (Fig. 8 and 9). Thus, the chemical mechanism of core–shell particle formation has been studied following successive titrations: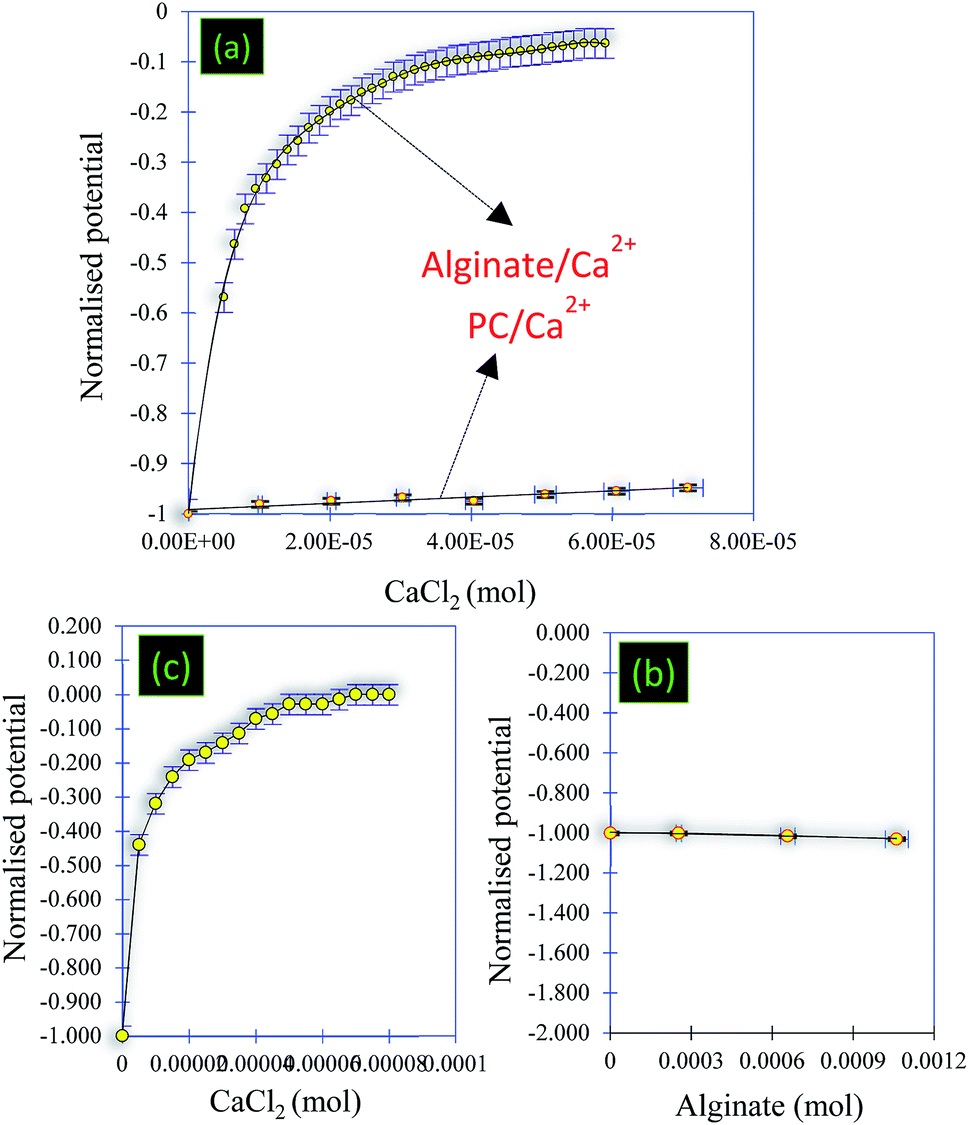 | ||
| Fig. 8 (a) Titration of the PC solution (0.12 g L−1) using CaCl2 (0.1 M) and titration of the alginate solution (1 g L−1) using CaCl2 (0.1 M). (b) Titration of the PC solution (pH = 8.4) (0.12 g L−1) using alginate (1 g L−1) and (c) titration of the PC@alginate mixture using CaCl2 (0.1 M). | ||
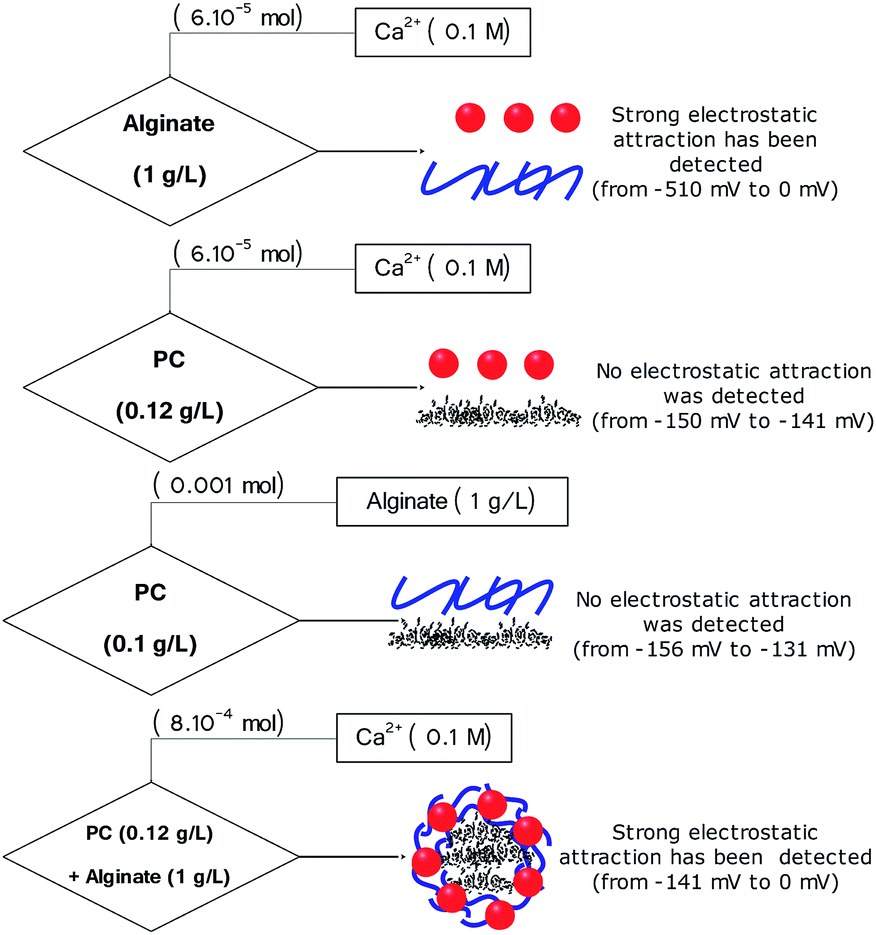 | ||
| Fig. 9 Chemical mechanism of core–shell particle formation. | ||
• Titration 1 (Fig. 8a): titration of alginate solution (1 g L−1) with CaCl2 (0.1 M). This titration showed a strong electrostatic interaction occurring between the Ca2+ ions and the carboxylic groups of the alginate. Indeed, the reaction at the beginning started with a potential equal to −510 mV and, after the addition of 6 × 10⁻⁷ mol of Ca2+, the surface potential decreased to 0 mV (Fig. 8a and 9).
• Titration 2 (Fig. 8a): titration of the PC solution (0.12 g L−1) at pH = 8.4 by CaCl2 (0.1 M). The main objective of this titration was to verify that the surface of the PC reacts weakly with the Ca2+ molecules. The analysis of Fig. 8a shows a weak interaction occurring between the PC and the Ca2+ ions after the addition of the same amount of CaCl2 as in titration 1. The comparison between titrations 1 and 2 (Fig. 8a) allowed an exponential curve to be seen in the case of alginate/Ca2+ and the opposite for the PC/Ca2+ system. Indeed, in both cases we started with a normalized potential (ISP) equal to −1 and after the addition of 6 × 10⁻⁷ mol of Ca2+, the saturation plateau (ISP = 0 mV) was detected in the case of the alginate/Ca2+ system, whilst in the PC/Ca2+ system, a plateau of the ISP around 0.9 mV was reached following the addition of large amounts of CaCl2.
• Titration 3 (Fig. 8b): titration of the PC solution (0.12 g L−1) at pH = 8.4 with alginate (1 g L−1). This experiment showed that the surface of the PC does not interact with that of alginate. At the beginning of the reaction, the surface of the PC indicates a negative potential equal to −156 mV, which remains constant after the addition of the alginate molecules (Fig. 8b and 9). The repulsive forces between the two negatively charged surfaces explained these results. Fig. 8b confirms these results and shows a linear form of the ISP variation as a function of the amount of alginate added.
• Titration 4 (Fig. 8c): titration of a mixed solution of PC (0.12 g L−1) and alginate (1 g L−1) with CaCl2 (0.1 M). Fig. 8c shows a strong electrostatic interaction (probably between Ca2+ and alginate) and the surface charge saturation is held after the addition of 8 × 10⁻⁵ mol CaCl2 (0.1 M).
In addition, Fig. 9 shows the performed titrations used in this work to describe the mechanism of core–shell particle formation. As a conclusion, the surface charge measurements showed electrostatic attraction and/or repulsion forces occurring between the alginate ions, the calcium ions (Ca2+) and the PC, thus leading to the formation of core(carbon)–shell (alginate–calcium ions) particles. However, in the absence of calcium ions, no electrostatic attraction was observed between the PC and the alginate. In addition, the form of the core–shell particles was confirmed by numerical microscopy and the dimensions have been calculated (Fig. S2†).
3.4. PC surface charge interaction with MB, CV and CR
PC surface charge interactions with different dyes were investigated and CTACl was used as a reference. From Fig. 10, we can conclude that the CR molecule was weakly interfaced with PC compared with MB and CV. The number of moles of CR necessary to saturate the surface of the PC was equal 2.5 × 10⁻¹⁰ mol and, in the case of MB and CV, this value was higher by 60 and 100 times, respectively. These results can be explained by the characteristic surface of PC, which is more sensitive to cationic dyes than to anionic dyes. In addition, this analysis showed that the CV dye was adsorbed more than the MB dye on the surface of the PC by 0.6 times. This difference in the number of moles can be explained by the tail of the MB molecule, as well as the functional groups of CV, which can be more attractive with the –COO–H and –OH groups of PC, especially with the N–H and SO3− groups. This analysis allows the characteristic interactions between the molecules and the surface of the PC to be seen. These results, and those of the characterizations, confirm that the mechanism of adsorption refers to the formation of hydrogen bonding and the electrostatic attraction of the dyes with C–O groups. In addition, the fixation of the pollutant molecule inside the adsorbent pores of PC plays a very important role in the dye adsorption mechanism.2,52–54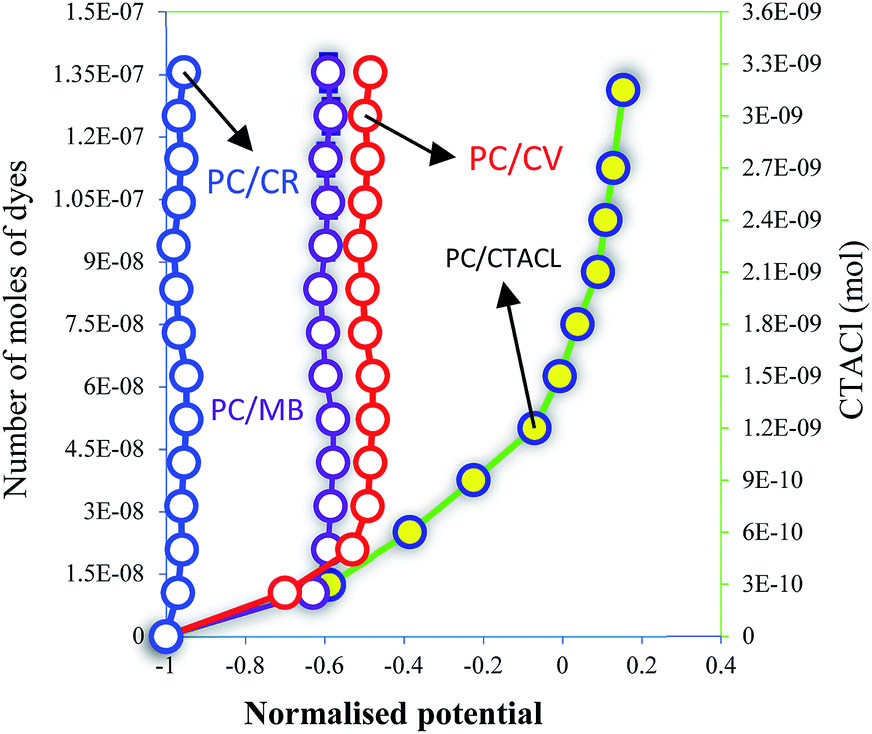 | ||
| Fig. 10 PC surface charge interactions with MB, CV and CR. | ||
3.5. Adsorption studies
The effect of pH on the MB solution was carried out under the following conditions: 25 mg of adsorbent mass, a contact time of adsorbent–adsorbate of 100 min, 40 mL of dye solutions, and an initial dye concentration of 10 mg L−1 at room temperature.Fig. S3a† shows the curve of the removal efficiency measured at different pHs. It can be seen that the pH of the solution has a critical impact on dye removal. Therefore, when the pH of the solution was very acidic, the removal of MB and CV was very low, whereas it was the opposite when the pH of the cationic dye solution was higher than 8. In fact, the availability of negative active sites in PC and the high surface area at this range of pH explained the higher adsorption capacity of these dyes compared to that of CR.
These results are in agreement with those cited in the above sections and are summarized as the following:
• From Fig. 7a, we demonstrated that the carboxylic and phenolic groups were charged negatively, which leads to a repulsion of the electrical forces between PC particles and avoids agglomeration, which allowed the recording of the lowest values of PC particle sizes (307 nm).
• From Fig. 6a, the titration of the PC solution at different pHs using CTACl (6.25 × 10⁻⁴ M) showed that the values of the equivalent point increase as the pH increases. Therefore, a high amount of carboxylic and hydroxyl functionalization groups characterized the surface of the PC and a variation in the pH allowed the modification of the charge of these groups, which favored more electrostatic attractions with MB and CV.
• From Fig. 7b, in alkaline pH (pH > pHPZC), the surface of the PC@alginate was negatively charged, which is in favor of the electrostatic attraction forces that occur between the PC and the cationic dyes.55
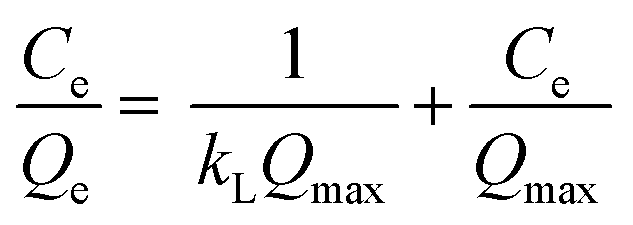
The adsorption isotherms of MB, CV and CR onto PC@alginate have been calculated using both Langmuir and Freundlich models.56–60 The overall data indicate efficient dye removal in the case of MB and CV (>96%), without the occurrence of the solid/liquid separation problem. As a result of the adsorption isotherms (Fig. S3b† and Table 1), the correlation coefficients showed a good fit in the case of the Langmuir model and the values of RL showed a favorable adsorption, indicating the achievement of a homogeneously adsorbed monolayer of MB, CV and CR onto PC@alginate.
| Dye | Langmuir | |||
|---|---|---|---|---|
| Qmax (mg g−1) | kL (L mg−1) | R2 | RL | |
| MB | 25.906 | 1.550 | 0.9978 | 0.11–0.01 |
| CV | 30.959 | 1.318 | 0.9930 | 0.13–0.01 |
| CR | 9.0334 | 0.422 | 0.9888 | 0.32–0.05 |
| Dye | Freundlich | |||
|---|---|---|---|---|
| kF (mg1−n Ln g−1) | n | R2 | kF (mg1−n Ln g−1) | |
| MB | 8.545 | 2.758 | 0.3613 | 8.545 |
| CV | 7.252 | 1.910 | 0.4299 | 7.252 |
| CR | 1.549 | 1.822 | 0.8858 | 1.549 |
The reusability and the recovery ability of the adsorbents were considered as crucial economic factors when assessing the cost-effectiveness of the treatment process.61,62 The results of regeneration revealed that the core–shell particles showed high reusability efficiencies. Indeed, the regeneration test successfully eluted 91.28% (for MB) and 92.74% (for CV) of the dyes loaded onto PC@alginate after 5 cycles of sorption–desorption (Fig. 11a). In the case of CR, the reusability efficiencies decreased by 5.93 after 5 cycles using NaOH (0.1 M) (Fig. 11a). In all case systems (MB, CV and CR adsorption), a total recovery of the adsorbent particles was observed (Fig. 11b).
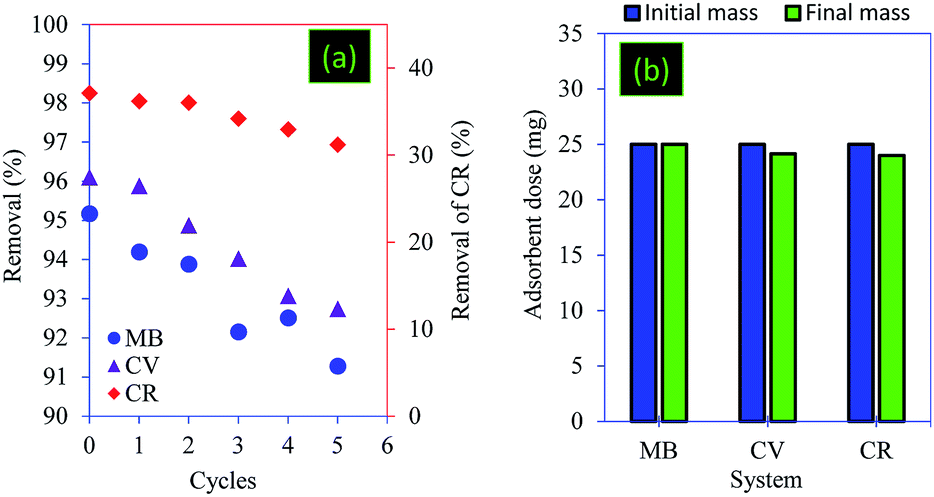 | ||
| Fig. 11 (a) Reusability and (b) recovery ability of the PC@alginate particles. | ||
4. Conclusions
In this work, agri-food organic waste has been transformed into core–shell particles. These particles allow for the elimination of toxic dyes as well as solve the problem relating to the separation of liquid and solid phases after the adsorption process. The main results of the work are:• The bio-digestate has been transformed into PC with a large specific surface area.
• The characterization of PC shows the structure of activated carbon with the presence of carboxylic and hydroxyl groups.
• In a dispersed medium, the PC sample was very sensitive to the variation in pH. Indeed, the pH variation makes it possible to reduce the particle size and to increase the electrostatic attraction with the PC. These results were confirmed using characterization techniques in aqueous medium and the surfactant molecule CTACl as a probe. The particle size of PC was very sensitive to temperature variation and the sizes are very small when the medium becomes basic at higher temperatures.
• The mechanism of formation of the core–shell is well evidenced using several titrations and the final form is observed by two-level 2D and 3D analysis using numerical microscopy.
• Core–shell particles were used to remove toxic dyes. Experimental results showed that cationic dyes are more absorbed than anionic ones. According to the Langmuir model, the adsorption capacities were: 25.90 mg g−1 (for MB), 30.95 mg g−1 (for CV) and 9.03 mg g−1 (for CR).
• Core–shell particles are easy to regenerate. The results showed a decrease of 3.89, 3.31, and 5.93% for MB, CV and CR, respectively.
• The core–shell particles are easy to recover. The results showed that the adsorbent mass loss after adsorption does not exceed 3%.
Conflicts of interest
The authors declare that they have no conflicts of interest.Author contributions
All authors have given approval to the final version of the manuscript.Acknowledgements
This work was supported by the framework of the Franco-Moroccan cooperation, research project CEDocs 2018. We thank the Mascir Foundation for their support. We thank FIOUX Philippe (IS2M-Mulhouse-France) for XPS analyses. We thank VIDAL Loïc (IS2M-Mulhouse-France) and KNOPF Stéphan (IS2M-Mulhouse-France) for SEM and TEM analyses, respectively.Notes and references
- M. Alimohammady, M. Jahangiri, F. Kiani and H. Tahermansouri, New J. Chem., 2017, 41, 8905–8919 RSC.
- M. Zbair, Z. Anfar, H. A. Ahsaine, N. El Alem and M. Ezahri, J. Environ. Manage., 2018, 206, 383–397 CrossRef CAS PubMed.
- M. Zbair, H. Ait Ahsaine and Z. Anfar, J. Cleaner Prod., 2018, 202, 571–581 CrossRef CAS.
- S. Lhanafi, Z. Anfar, B. Chebli, M. Benafqir, R. El Haouti, Y. Azougarh, M. Abbaz and N. El Alem, Sustainable Environ. Res., 2018, 28, 389–395 CrossRef CAS.
- Y. Ozay, E. K. Ünşar, Z. Işık, F. Yılmaz, N. Dizge, N. A. Perendeci, M. A. Mazmanci and M. Yalvac, J. Cleaner Prod., 2018, 196, 42–50 CrossRef CAS.
- R. Su, Q. Li, Y. Chen, B. Gao, Q. Yue and W. Zhou, J. Cleaner Prod., 2019, 209, 20–29 CrossRef CAS.
- S. Liu, X. Chen, W. Ai and C. Wei, J. Cleaner Prod., 2019, 212, 1062–1071 CrossRef CAS.
- S. Wong, H. H. Tumari, N. Ngadi, N. B. Mohamed, O. Hassan, R. Mat and N. A. Saidina Amin, J. Cleaner Prod., 2019, 206, 394–406 CrossRef CAS.
- E. Serrano León, J. A. Perales Vargas-Machuca, E. Lara Corona, Z. Arbib, F. Rogalla and M. Fernández Boizán, J. Cleaner Prod., 2018, 198, 931–939 CrossRef.
- R. M. Novais, A. P. F. Caetano, M. P. Seabra, J. A. Labrincha and R. C. Pullar, J. Cleaner Prod., 2018, 197, 1137–1147 CrossRef CAS.
- T. L. da Silva, A. C. da Silva, M. G. A. Vieira, M. L. Gimenes and M. G. C. da Silva, J. Cleaner Prod., 2016, 137, 1470–1478 CrossRef CAS.
- O. Kuczman, M. V. D. Gueri, S. N. M. De Souza, W. N. Schirmer, H. J. Alves, D. Secco, W. G. Buratto, C. B. Ribeiro and F. B. Hernandes, J. Cleaner Prod., 2018, 196, 382–389 CrossRef CAS.
- A. Kumar and H. M. Jena, J. Cleaner Prod., 2016, 137, 1246–1259 CrossRef CAS.
- R. Bedoić, L. Čuček, B. Ćosić, D. Krajnc, G. Smoljanić, Z. Kravanja, D. Ljubas, T. Pukšec and N. Duić, J. Cleaner Prod., 2019, 213, 700–709 CrossRef.
- M. Moretti, M. Van Dael, R. Malina and S. Van Passel, J. Cleaner Prod., 2018, 171, 954–961 CrossRef.
- A. Pfluger, J. Coontz, V. Zhiteneva, T. Gulliver, L. Cherry, L. Cavanaugh and L. Figueroa, J. Cleaner Prod., 2019, 206, 97–107 CrossRef CAS.
- A. Ahmad, A. H. Bhat and A. Buang, J. Cleaner Prod., 2018, 171, 1361–1375 CrossRef CAS.
- R. Kamaraj and S. Vasudevan, New J. Chem., 2016, 40, 2249–2258 RSC.
- M. Inyang, B. Gao, Y. Yao, Y. Xue, A. R. Zimmerman, P. Pullammanappallil and X. Cao, Bioresour. Technol., 2012, 110, 50–56 CrossRef CAS PubMed.
- M. Inyang, B. Gao, A. Zimmerman, M. Zhang and H. Chen, Chem. Eng. J., 2014, 236, 39–46 CrossRef CAS.
- Y. Yao, B. Gao, M. Inyang, A. R. Zimmerman, X. Cao, P. Pullammanappallil and L. Yang, Bioresour. Technol., 2011, 102, 6273–6278 CrossRef CAS PubMed.
- M. Inyang, B. Gao, W. Ding, P. Pullammanappallil, A. R. Zimmerman and X. Cao, Sep. Sci. Technol., 2011, 46, 1950–1956 CrossRef CAS.
- M. Inyang, B. Gao, P. Pullammanappallil, W. Ding and A. R. Zimmerman, Bioresour. Technol., 2010, 101, 8868–8872 CrossRef CAS PubMed.
- B. Coasne, New J. Chem., 2016, 40, 4078–4094 RSC.
- A. Jada, H. Debih and M. Khodja, J. Pet. Sci. Eng., 2006, 52, 305–316 CrossRef CAS.
- A. Jada, H. Ridaoui, L. Vidal and J. B. Donnet, Colloids Surf., A, 2014, 458, 187–194 CrossRef CAS.
- H. Ridaoui, A. Jada, L. Vidal and J. B. Donnet, Colloids Surf., A, 2006, 278, 149–159 CrossRef CAS.
- Z. Anfar, M. Zbair, H. A. Ahsaine, M. Ezahri and N. El Alem, Fullerenes, Nanotubes, Carbon Nanostruct., 2018, 26, 389–397 CrossRef CAS.
- H. A. Ahsaine, M. Zbair, Z. Anfar, Y. Naciri, R. El, N. El Alem and M. Ezahri, Mater. Today Chem., 2018, 8, 121–132 CrossRef.
- A. Elouahli, M. Zbair, Z. Anfar, H. A. Ahsaine, H. Khallok, R. Chourak and Z. Hatim, Surf. Interfaces, 2018, 13, 139–147 CrossRef CAS.
- Z. Anfar, R. El Haouti, S. Lhanafi, M. Benafqir, Y. Azougarh and N. El Alem, J. Environ. Chem. Eng., 2017, 5, 5857–5867 CrossRef CAS.
- P. J. F. Harris, Z. Liu and K. Suenaga, J. Phys.: Condens. Matter, 2008, 20, 1–5 Search PubMed.
- M. E. Casco, M. Martínez-Escandell, K. Kaneko, J. Silvestre-Albero and F. Rodríguez-Reinoso, Carbon, 2015, 93, 11–21 CrossRef CAS.
- Y. Huang, F. S. Cannon, J. K. Watson, B. Reznik and J. P. Mathews, Carbon, 2015, 83, 1–14 CrossRef CAS.
- C. Bommier, R. Xu, W. Wang, X. Wang, D. Wen, J. Lu and X. Ji, Nano Energy, 2015, 13, 709–717 CrossRef CAS.
- J. Liu, N. Sun, C. Sun, H. Liu, C. Snape, K. Li, W. Wei and Y. Sun, Carbon, 2015, 94, 243–255 CrossRef CAS.
- B. Chang, D. Guan, Y. Tian, Z. Yang and X. Dong, J. Hazard. Mater., 2013, 262, 256–264 CrossRef CAS PubMed.
- B. Chang, H. Yin, X. Zhang, S. Zhang and B. Yang, Chem. Eng. J., 2017, 312, 191–203 CrossRef CAS.
- B. Chang, Y. Guo, Y. Li, H. Yin, S. Zhang, B. Yang and X. Dong, J. Mater. Chem. A, 2015, 3, 9565–9577 RSC.
- Y. Haldorai, W. Voit and J.-J. Shim, Electrochim. Acta, 2014, 120, 65–72 CrossRef CAS.
- Z. Anfar, A. Amedlous, A. Ait El Fakir, H. Ait Ahsaine, M. Zbair, S. Lhanafi, R. El Haouti, A. Jada and N. El Alem, ACS Omega, 2019, 4, 9434–9445 CrossRef CAS.
- S. Vasudevan and J. Lakshmi, RSC Adv., 2012, 2, 5234–5242 RSC.
- W. Song, B. Gao, X. Xu, F. Wang, N. Xue, S. Sun, W. Song and R. Jia, J. Hazard. Mater., 2016, 304, 280–290 CrossRef CAS PubMed.
- F. Tuinstra and J. L. Koenig, J. Chem. Phys., 1969, 31, 646–650 Search PubMed.
- A. C. Ferrari and J. Robertson, Phys. Rev. B: Condens. Matter Mater. Phys., 2013, 10, 26–31 Search PubMed.
- A. Lazzarini, A. Piovano, R. Pellegrini, G. Agostini, S. Rudić, C. Lamberti and E. Groppo, Phys. Procedia, 2016, 85, 20–26 CrossRef CAS.
- B. Chang, S. Zhang, L. Sun, H. Yin and B. Yang, RSC Adv., 2016, 6, 71360–71369 RSC.
- H. W. Kwak, Y. Hong, M. E. Lee and H. J. Jin, Int. J. Biol. Macromol., 2018, 120, 906–914 CrossRef CAS PubMed.
- G. K. Poongavanam and V. Ramalingam, Int. J. Therm. Sci., 2019, 136, 15–32 CrossRef CAS.
- L. Liang, M. Zhou, W. Yang and L. Jiang, Chem. Eng. J., 2018, 352, 673–681 CrossRef CAS.
- J. Sun, X. Liu, F. Zhang, J. Zhou, J. Wu, A. Alsaedi, T. Hayat and J. Li, Colloids Surf., A, 2019, 563, 22–30 CrossRef CAS.
- Z. Anfar, A. Amedlous, A. A. El Fakir, M. Zbair, H. Ait Ahsaine, A. Jada and N. El Alem, Chemosphere, 2019, 236, 124351 CrossRef CAS.
- Z. Anfar, H. Ait Ahsaine, M. Zbair, A. Amedlous, A. Ait El Fakir, A. Jada and N. El Alem, Crit. Rev. Environ. Sci. Technol., 2019, 1–42 CrossRef.
- Z. Anfar, M. Zbair, H. A. Ahsaine, Y. Abdellaoui, A. A. El Fakir, E. H. Amaterz, A. Jada and N. El Alem, ChemistrySelect, 2019, 4, 4981–4994 CrossRef CAS.
- V. Rocher, A. Bee, J. M. Siaugue and V. Cabuil, J. Hazard. Mater., 2010, 178, 434–439 CrossRef CAS PubMed.
- M. Şaban Tanyildizi, Chem. Eng. J., 2011, 168, 1234–1240 CrossRef.
- M. Laabd, H. Ait Ahsaine, A. El Jaouhari, B. Bakiz, M. Bazzaoui, M. Ezahri, A. Albourine and A. Benlhachemi, J. Environ. Chem. Eng., 2016, 4, 3096–3105 CrossRef CAS.
- H. A. Ahsaine, M. Zbair and R. El Haouti, Desalin. Water Treat., 2017, 85, 330–338 CrossRef.
- I. Langmuir, J. Am. Chem. Soc., 1916, 38, 2221–2295 CrossRef CAS.
- H. Freundlich, Z. Phys. Chem., 1907, 57, 385–470 CAS.
- A. Benhouria, M. A. Islam, H. Zaghouane-Boudiaf, M. Boutahala and B. H. Hameed, Chem. Eng. J., 2015, 270, 621–630 CrossRef CAS.
- K. W. Jung, B. H. Choi, M. J. Hwang, T. U. Jeong and K. H. Ahn, Bioresour. Technol., 2016, 219, 185–195 CrossRef CAS PubMed.
Footnote |
| † Electronic supplementary information (ESI) available: Effects of pH, adsorption isotherms, numerical macroscopic images and elemental analysis of the digestate and the PC. See DOI: 10.1039/c9ra04869c |
| This journal is © The Royal Society of Chemistry 2019 |