DOI:
10.1039/C9RA04461B
(Paper)
RSC Adv., 2019,
9, 27069-27082
The synthesis and characterization of benzotriazole-based cationic surfactants and the evaluation of their corrosion inhibition efficiency on copper in seawater
Received
13th June 2019
, Accepted 6th August 2019
First published on 28th August 2019
Abstract
This study aims at preparing three cationic surfactants based on benzotriazole and evaluating their efficiencies as corrosion inhibitors for copper electrodes in seawater using different electrochemical techniques (potentiodynamic polarization, electrochemical impedance spectroscopy (EIS) and atomic force microscopy (AFM)). FTIR and 1H NMR spectroscopic techniques confirmed the chemical structures of the as-prepared cationic compounds. The inhibition efficiency increased with the increase the concentration of the as-prepared compounds in the solution. The curves of the potentiodynamic polarization and the plots of EIS techniques show that the performance of all investigated compounds as mixed type. The standard free energy  values imply that the three as-prepared compounds show physicochemical adsorption and obey the Langmuir adsorption model. AFM technique observed the reduction in the surface roughness due to the protective film formed on the copper surface. Finally, computational calculations show a great correlation with the experimental results due to the electron-donating effect.
1. Introduction
Copper and its alloys are the earliest metals known to human, which has become very important today compared to any other time due to their good resistance to corrosion in different environments, and high thermal conductivity, excellent operability and good mechanical properties at different temperatures.1 Unfortunately, these alloys require regular maintenance and have limited service time because of their high degrees of degradation and low bio-fouling reluctance in seawater.2 Several problems occur in the electrochemical behavior as a result of bio-fouling due to strong adhering on the metal surface.3 Due to the presence of highly concentrated chlorides and various salts in seawater, one of the major problems faced is the corrosion of metallic surfaces. In (2004) A. El-Warraky et al.4 investigated the effect of chloride ion concentration in chloride solutions, which clarify that in dilute solutions of NaCl (less than 10−3 M Cl−), the formation of CuCl occurs by the dissolution of copper that has a little effect and not protective enough. At the same time, the formation of cuprous oxide may be favored over chloride complexes formation. Moreover, at high chloride concentrations (more than 10−3 M Cl−), the complexes of CuCl3−2 and CuCl4−3 are formed, in which the corrosion potential moves to high negative values and the anodic current also attains higher values.5 Traverso et al.6 focused on the influence of sulphide on the corrosion of copper alloys in seawater and it was reported that at initial levels (4 ppm) of sulfide, most intensive corrosion occurs depending on the amount of dissolved oxygen in solution and the chemical conformation of the corrosion film. Practically, few recent studies discussing the common and localized corrosion of copper alloys in seawater have been reported.7,8 Recently, the use of corrosion inhibitors has become one of the most important ways to reduce corrosion attacks, which prevent copper dissolution in an aggressive medium by forming adsorbed barrier layer at the metal surface and by decreasing the metal/solution contact.9,10 Different types of inhibitors used should be safe besides being eco-friendly and economical.11,12 The efficiency of any inhibitor is strongly associated to its chemical composition, concentration and the electrolyte solution.13 Benzotriazole (BTA) compounds are considered as one of the best compounds that have inhibiting action on metals by bonding its surface with the free lone pairs of electrons of nitrogen atoms through the P π–d π bond.14–16 Sherif et al.14 documented a detailed study on the influence of 3-amino-1,2,4-triazole (ATA) on copper corrosion in aerated synthetic seawater solutions. The results revealed that ATA form a stable complex on the surface of the copper electrode when adsorbed on it, which decreases the copper corrosion. Moreover, the corrosion process can be enhanced by increasing its concentration. Marija et al.17 discussed the influence of imidazole-based compounds on copper corrosion in seawater, where they found that the prepared compound, imidazole, could inhibit corrosion on the surface of the copper by adsorbing on its surface, in which decrease in the corrosion current density can be achieved by increasing the imidazole concentration. Wang et al.18 studied different types of the dibenzotriazole bearing alkaline linker in addition to monobenzotriazole as corrosion inhibitors for copper in 3.5 wt% NaCl solution at 298 K. They found that dibenzotriazole derivatives provide a high inhibition efficiency more than monobenzotriazole for copper in NaCl solution. Many classes of organic compounds exhibit inhibitor properties. Among them, some cationic surfactants particularly include quaternary ammonium salts. The presence of functional groups such as double bond, benzene ring and nitrogen atoms in addition to the hydrophobic chain of the surfactant enhances their adsorption ability.19 In the present study, we developed n-alkyl-quaternary ammonium salts based on benzotriazole as corrosion inhibitors, which improved the solubility of benzotriazole in seawater. Then the inhibition performance of the as-prepared compounds for a copper electrode in seawater was obtained by different electrochemical techniques, such as PDP and EIS. AFM technique shows the variations of the copper-corroded surface in solution before and after adding the inhibitor molecules. Quantum chemical calculations were performed to obtain the relation between the molecular structure and inhibition efficiency of the as-prepared compounds.
2. Materials and experimental procedures
2.1 Electrochemical measurements
A three-electrode system was used to evaluate the electrochemical performance of the copper electrode in naturally aerated stagnant seawater solutions obtained from the white Mediterranean Sea. The chemical analysis of the seawater samples was done with the help Volta lab potentiostat (Radiometer PGZ402) and has been shown in Table 1. A saturated calomel electrode SCE and a platinum electrode were used as the reference and counter electrodes, respectively. The working electrode was made of a copper wire obtained by an upcasting procedure. It was prepared in a metallurgical workshop. The metallic rod was introduced into glass tubes using a two-component epoxy resin leaving a surface area of 0.2 cm2 to contact the solution. The chemical composition of the pure copper is listed in Table 2. Electrochemical impedance spectroscopy was performed at a steady state potential. EIS was performed within the frequency range of 100![[thin space (1/6-em)]](https://www.rsc.org/images/entities/char_2009.gif) 000–0.05 Hz with a peak to peak amplitude of 5 mV.20,21 PDP was executed over the sweeping potential range of −500 to 60 mV at a scan rate of 2 mV s−1. Electrochemical impedance parameters have been fitted using the Zm view software with a suitable equivalent circuit. Before every measurements, the Cu electrode was polished by consecutive emery papers ranking from 600 to 2500 grit and was then carefully washed with bi-distilled water and dried using a soft paper. Subsequently, direct dipping in the corrosive medium was done. To obtain the desired concentration from the as-prepared inhibitors, a certain amount of inhibitor was dissolved into the seawater samples. Series of solutions with lower concentrations were prepared by dilution. To verify the reproducibility, every experiment was repeated at least three times.
000–0.05 Hz with a peak to peak amplitude of 5 mV.20,21 PDP was executed over the sweeping potential range of −500 to 60 mV at a scan rate of 2 mV s−1. Electrochemical impedance parameters have been fitted using the Zm view software with a suitable equivalent circuit. Before every measurements, the Cu electrode was polished by consecutive emery papers ranking from 600 to 2500 grit and was then carefully washed with bi-distilled water and dried using a soft paper. Subsequently, direct dipping in the corrosive medium was done. To obtain the desired concentration from the as-prepared inhibitors, a certain amount of inhibitor was dissolved into the seawater samples. Series of solutions with lower concentrations were prepared by dilution. To verify the reproducibility, every experiment was repeated at least three times.
Table 1 Complete chemical composition of seawater (as ions) used in this study
| Chemical composition |
Na+ |
Ca2+ |
Mg2+ |
Cl− |
SO42− |
HCO3− |
T.D.S. ions |
| Conc./(g L−1) |
11.33 |
0.48 |
1.41 |
20.8 |
1.92 |
0.39 |
36.8 |
Table 2 Chemical composition of copper electrode used in this study
| Chemical composition |
Cu |
Al |
Ni |
Zn |
Mn |
Sn |
Fe |
Si |
Mg |
Ti |
| Conc./(g L−1) |
99.928 |
99.928 |
0.001 |
0.02 |
0.007 |
0.003 |
0.033 |
0.002 |
0.004 |
0.001 |
2.2 Synthesis of inhibitors
In a 250 mL round bottom flask attached to a condenser and magnetic stirrer, 20 mM of different 1-bromo alkanes specifically, 1-bromo (hexane, dodecane, octadecane) were added separately to 20 mM of 5-methyl-1H-benzo[d][1,2,3]triazole. 100 mL acetone was used as the solvent. The reaction mixture was refluxed for about 36 h and then cooled to room temperature. The obtained pale brown precipitate product was further purified using diethyl ether. Then, it was recrystallized from acetone to give a pale brown precipitate of the cationic surfactants.22 Finally, the reaction yield was about 72%.
2.3 Surface morphological observation
Atomic force microscopy (AFM) wet – SPM with non-contact mode was used to study the surface roughness of copper in seawater samples before and after adding the optimum concentration (1.05 × 10⁻³ M) of the inhibitor molecules (OBT).
2.4 Computational study
Quantum calculations and optimization of the geometry of the as-synthesized compounds were performed using the Materials Studio 6.0 (MS6.0) software from Accelrys, Inc. The optimized structure was studied by VAMP module and the chemical parameters were obtained using the Hamiltonian NDDO (Neglect of Diatomic Differential Overlap) with the parameterized element PM3 (parameterization model 3). A full optimization of all geometrical variables without any symmetry constraints was performed at the restricted Hartree–Fock (RHF) level with a gradient norm 0.4 kcal mol−1 Å−1.23,24 These parameters analyzed include the highest occupied molecular orbital (EHOMO), lowest unoccupied molecular orbital (ELUMO), energy gap (ΔE = ELUMO − EHOMO), hardness (η), electronegativity (X), dipole moment (μ), fraction of the electron transferred (ΔN) and softness (σ) = 1/η.11
3. Results and discussion
3.1 Characterization of the chemical structure of the as-prepared inhibitors
The chemical structure of the as-synthesized surfactants in Scheme 1 was confirmed by 1H NMR and FTIR spectra. First, the FTIR spectrum shows the main characteristic bands of the as-prepared cationic compound (HBT) as presented in Fig. 1. The absorption band at 729.08 cm−1 is attributed to the out of the plane C–H bending for the aromatic structure. The N–H stretching (secondary amine) appears at 3429 cm−1 and 3009 cm−1 is expected to be the C–H stretching in the aromatic structure. 1624.80 cm−1 and 1468.08 cm−1 are attributed to the C![[double bond, length as m-dash]](https://www.rsc.org/images/entities/char_e001.gif) C aromatic stretching of benzene. Typical bands, 2956–2862 cm−1 (aliphatic C–H stretching),13 in the FTIR spectrum confirmed the presence of predicted functional groups in the as-prepared compounds. 1H NMR spectrum of the as-prepared compound (HBT) is shown in Fig. 2. The spectrum shows different bands at δ = 0.882 ppm (t, 3H, CH3 (CH2)3CH2CH2N), δ = 1.321 ppm (m, 6H, CH3 (CH2)3CH2CH2N), δ = 1.65 ppm (m, 2H, CH3 (CH2)3CH2CH2N), δ = 2.01 ppm (m, 2H, CH3(CH2)3CH2CH2N), δ = 3.51 ppm (s, 3H, CH3-toluidene nucleus), δ = 9.45 ppm (s, 1H, NH) δ = 7.35 ppm (d, 1H, 4-benzene nucleus) and δ = 7.84 (s, 1H, 6-benzene nucleus). The chemical composition of the as-synthesized cationic surfactants (HBT, DBT and OBT) (Scheme 1) was confirmed by the elemental analysis using a Vario Elementar Analyzer (Hanau, Germany), (Table 3). The data of elemental analysis confirmed the purity of the as-synthesized inhibitors.
C aromatic stretching of benzene. Typical bands, 2956–2862 cm−1 (aliphatic C–H stretching),13 in the FTIR spectrum confirmed the presence of predicted functional groups in the as-prepared compounds. 1H NMR spectrum of the as-prepared compound (HBT) is shown in Fig. 2. The spectrum shows different bands at δ = 0.882 ppm (t, 3H, CH3 (CH2)3CH2CH2N), δ = 1.321 ppm (m, 6H, CH3 (CH2)3CH2CH2N), δ = 1.65 ppm (m, 2H, CH3 (CH2)3CH2CH2N), δ = 2.01 ppm (m, 2H, CH3(CH2)3CH2CH2N), δ = 3.51 ppm (s, 3H, CH3-toluidene nucleus), δ = 9.45 ppm (s, 1H, NH) δ = 7.35 ppm (d, 1H, 4-benzene nucleus) and δ = 7.84 (s, 1H, 6-benzene nucleus). The chemical composition of the as-synthesized cationic surfactants (HBT, DBT and OBT) (Scheme 1) was confirmed by the elemental analysis using a Vario Elementar Analyzer (Hanau, Germany), (Table 3). The data of elemental analysis confirmed the purity of the as-synthesized inhibitors.
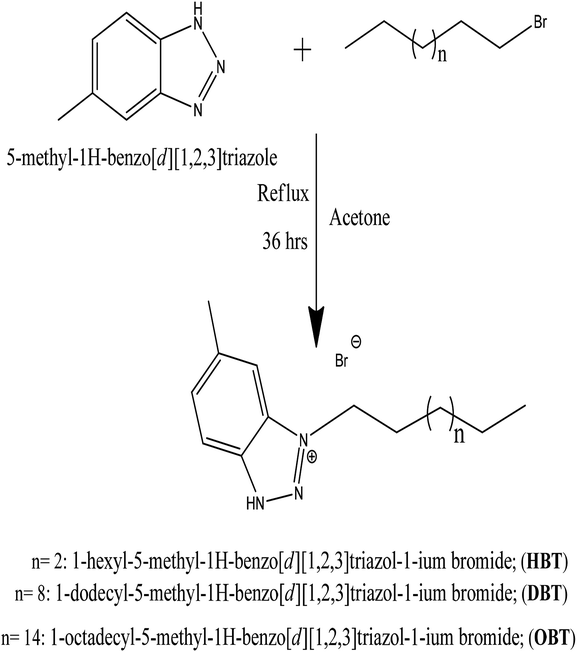 |
| | Scheme 1 The chemical structure of the as-prepared cationic surfactants. | |
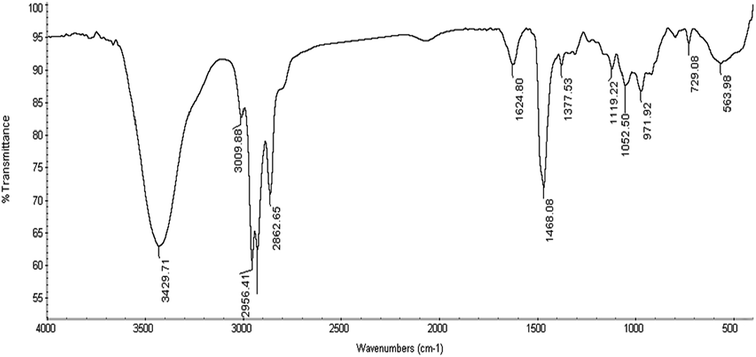 |
| | Fig. 1 FTIR spectrum of HBT. | |
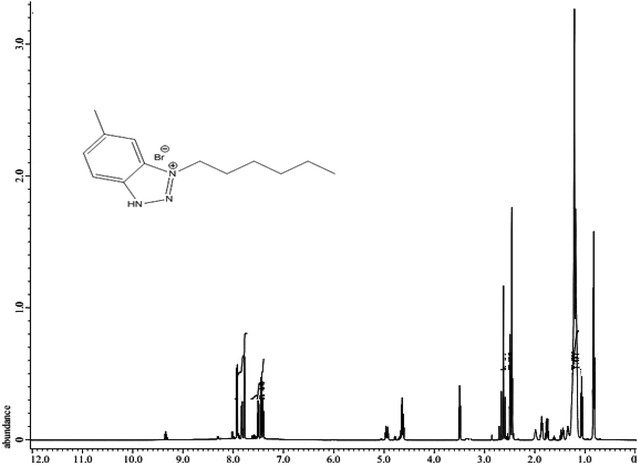 |
| | Fig. 2 1H NMR spectrum of HBT. | |
Table 3 The elemental analysis of the as-prepared surfactants
| Compound |
Structure |
Yield, % |
MWt (g mol−1) |
Carbon (C%) |
Hydrogen (H%) |
Nitrogen (N%) |
Bromide (Br%) |
| Calc. |
Found |
Calc. |
Found |
Calc. |
Found |
Calc. |
Found |
| HBT |
C13H20N3Br |
71 |
298 |
52.36 |
52.23 |
6.76 |
6.69 |
14.09 |
14.02 |
26.79 |
26.63 |
| DBT |
C19H32N3Br |
82 |
382 |
59.68 |
59.57 |
8.44 |
8.37 |
10.99 |
10.89 |
20.9 |
20.81 |
| OBT |
C25H44N3Br |
85 |
466 |
64.36 |
64.24 |
9.51 |
9.43 |
9.01 |
8.92 |
17.13 |
17.02 |
3.2 Potentiodynamic polarization results
The polarization behavior of Cu–10Al–10Zn alloy was verified by the resulting potentiodynamic polarization curves, which were measured at a scan rate of 2 mV s−1 in both (cathodic and anodic) potentials. The curves of polarization, cathodic and anodic, of the copper electrode in seawater samples before and after adding different concentrations of the as-synthesized surfactants (HBT, DBT and OBT) were obtained as shown in Fig. 3(a–c) at 298 K. Table 4 contains the values of the corresponding electrochemical polarization parameters including the corrosion potentials (Ecorr), corrosion current density (icorr), corrosion rate (CR), cathodic and anodic Tafel slopes (βc and βa, respectively) besides the inhibition efficiencies (η%), surface coverage and polarization resistance (Rp). The previous values can be calculated by using the following relationships:12,13,25| |
 | (1) |
| |
 | (2) |
where (θ) represent the degree of the surface coverage,  represent the values of corrosion current densities with and without the inhibitor molecules, respectively. The well-known Stern–Geary equation was used to determine the polarization resistance values (Rp):
| | |
Rp = babc/2.303icorr(ba + bc)
| (3) |
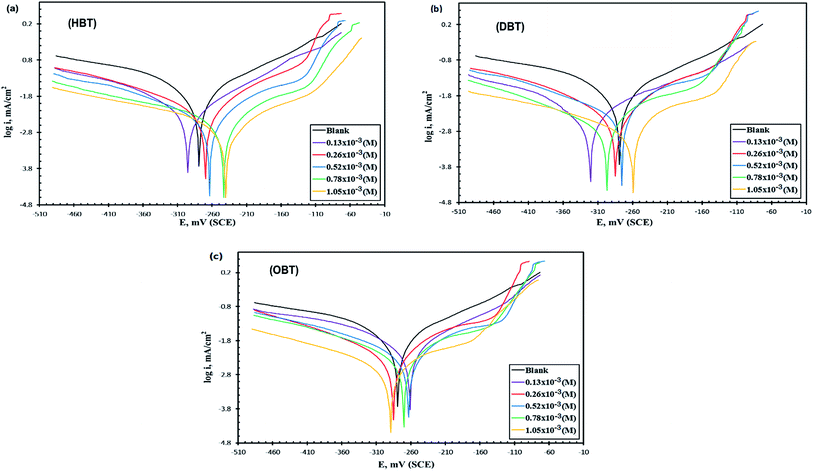 |
| | Fig. 3 Polarization curves of Cu electrode in seawater without and with various concentrations of inhibitor at 298 K: HBT (a), DBT (b) and OBT (c). | |
Table 4 Polarization parameters and rates of corrosion of the copper electrode in the absence and presence of different concentrations of different inhibitors in naturally aerated stagnant seawater at 298 K
| |
Conc. (M × 10−3) |
Ecorr/mV SCE |
icorr/mA cm−2 |
βa/mV dec−1 |
βc/mV dec−1 |
Corr. rate/μm per year |
θ |
Rp/kΩ cm2 |
η% |
| (HBT) |
Blank |
−278.9 |
0.0296 |
74.7 |
−202.3 |
345.2 |
— |
1.73 |
— |
| 0.13 |
−295.7 |
0.0173 |
58.3 |
−222.9 |
201.76 |
0.4195 |
1.98 |
41.95 |
| 0.26 |
−269.9 |
0.0107 |
42.6 |
−272.2 |
124.79 |
0.6409 |
2.04 |
64.09 |
| 0.52 |
−263.7 |
0.0077 |
34.4 |
−300.7 |
89.77 |
0.7416 |
2.19 |
74.16 |
| 0.78 |
−243.2 |
0.0065 |
30.6 |
−314.5 |
75.35 |
0.7819 |
2.26 |
78.19 |
| 1.05 |
−240.2 |
0.0044 |
23.4 |
−336.3 |
51.3 |
0.8523 |
2.49 |
85.23 |
| (DBT) |
0.13 |
−321.2 |
0.0157 |
59.7 |
−257.8 |
183.1 |
0.473 |
2.15 |
47.3 |
| 0.26 |
−284.3 |
0.0093 |
43.2 |
−279.6 |
108.6 |
0.6879 |
2.38 |
68.79 |
| 0.52 |
−275.7 |
0.0061 |
34.6 |
−364.4 |
71.14 |
0.7953 |
2.72 |
79.53 |
| 0.78 |
−296.8 |
0.0038 |
23.8 |
−442.7 |
44.73 |
0.8725 |
2.87 |
87.25 |
| 1.05 |
−259.2 |
0.0026 |
20.9 |
−494.5 |
30.3 |
0.9128 |
3.64 |
91.28 |
| (OBT) |
0.13 |
−261.3 |
0.0132 |
56.8 |
−382.4 |
153.94 |
0.557 |
2.19 |
55.7 |
| 0.26 |
−288.3 |
0.0075 |
39.6 |
−415.6 |
87.69 |
0.7483 |
2.53 |
74.83 |
| 0.52 |
−263.4 |
0.0064 |
37.3 |
−420.1 |
74.6 |
0.785 |
2.77 |
78.5 |
| 0.78 |
−270.2 |
0.0031 |
20.3 |
−474.9 |
36.15 |
0.896 |
2.97 |
89.6 |
| 1.05 |
−289.6 |
0.0023 |
16.9 |
−491.6 |
26.82 |
0.923 |
3.30 |
92.3 |
In the absence of inhibitor molecules, the process of copper corrosion passed through the following steps:
First step: the formation of OH, which is attained from the reduction of oxygen, and the cathodic reaction in a neutral or basic solution26 can be given as:
| | |
O2 + 2H2O + 4e− → 4OH−
| (4) |
Second step: in the presence of (Cl−) ions, the anodic dissolution of copper electrode occurs, which is represented by the following mechanism:27
then, Cu(
I) complex will be formed:
followed by the oxide formation:
| | |
2CuCl2− + 2OH− → Cu2O + H2O + 4Cl−
| (7) |
In addition, the formation of cupric hydroxyl chloride known as atacamite occurs as a result of further oxidation. It exhibits minor protective properties:
| |
 | (8) |
Moreover, after adding inhibitor molecules, the corrosion rate of the copper electrode decreased significantly, moving the polarization curves directly towards lower current densities. It is also observed that the inhibition efficiency values that are intended from icorr values, as shown in Table 4, increased by increasing the concentration of the as-prepared compounds. When the effect of the three prepared inhibitors were compared to each other at 1.05 × 10⁻³ M (Fig. 4), it was noticed that icorr values for the compound (OBT) is lower than those for (DBT) and (HBT), which further indicate that the (OBT) inhibitor is more effective on the pure copper surface than other inhibitors (DBT) and (HBT). All the inhibitors (HBT, DBT and OBT) gave high η% values at every concentration and the highest values of inhibition efficiency at 1.05 × 10⁻³ M are 85%, 91% and 92% for HBT, DBT and OBT, respectively. This greatly enhanced the strength of the adsorption film and gave a high protection layer, thus increasing the inhibition efficiency of OBT. Moreover, the variability of Tafel slopes (βa and βc) approved that cathodic and anodic reactions, and oxygen reduction and metal dissolution were affected without modifying the mechanism of corrosion.28 There is no noticeable shift in the corrosion potential values by adding the inhibitor molecules to both anodic and cathodic areas, which does not exceed 85 mV. Therefore, the as-synthesized compounds can be categorized as mixed-type compounds.12 Table 5 shows the comparison between the η% of the as-prepared compound (OBT) and some other reported inhibitors for the copper electrode in seawater.17,29,30
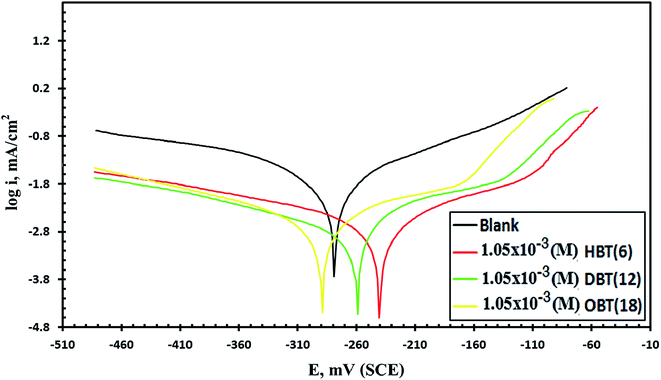 |
| | Fig. 4 Potentiodynamic polarization curves of the Cu electrode after electrode immersion in stagnant naturally aerated seawater free and containing (1.05 × 10⁻³ M) of the different inhibitors at 298 K. | |
Table 5 Comparison between the corrosion inhibition efficiency of the as-prepared (OBT)-cationic surfactant and some other reported inhibitor for the copper electrode in saline water
| No. |
Inhibitor |
Test medium |
Optimum concentration |
IE% |
Test method |
Ref. |
| 1 |
OBT |
Seawater |
1.05 × 10⁻³ (M) (400 ppm) |
92.3 |
PDP |
Present study |
| 2 |
Imidazole |
5 × 10⁻³ (M) |
84.35 |
PDP |
17 |
| 3 |
Purine |
5 × 10⁻³ (M) |
91.91 |
PDP |
17 |
| 4 |
Vitis vinifera |
1000 ppm |
76.08 |
WL |
29 |
| 5 |
(AMLA) |
1000 ppm |
79.99 |
EIS |
29 |
| 6 |
BTAH |
Near neutral chloride solution |
5 (mM) |
89.32 |
PDP |
30 |
3.3 EIS measurements
Electrochemical impedance spectroscopic technique was used to study the corrosion behavior of the copper electrode in seawater samples with and without various concentrations of the as-synthesized compounds (HBT, DBT and OBT). Fig. 5(a–c) and 6(a–c) show the representative Nyquist and Bode plots for the copper electrode that are obtained at the various concentrations of the as-synthesized inhibitors. The Nyquist and Bode plots show that after the addition of inhibitor molecules to the corrosive medium, the impedance response of the copper electrode directly changed. The obtained Nyquist plots showed non-perfect semicircles because of the frequency dispersion due to the inhomogeneity and roughness of the electrode surface.31 It is also clear from the Nyquist plots that the diameters of real resistance (Zr) increased with the increase in the inhibitor molecule concentration compared to the blank solution, indicating that the formed adsorbed layer has an effect to protect the copper surface in the corrosive medium. The band of impedance is described by two capacitive loops or two-phase maxima.32,33 The first phase maxima, one small loop, exist at the high-frequency area and are caused by the double layer capacitance as a result of the adsorption of surfactant molecules at the surface of the metal. The last phase maxima, a large incomplete capacitive loop, exist at low-frequency area and are controlled by the film formation. This film changes the structure at the electrode/solution interface.34 The equivalent circuit (EC) used for the impedance studies obtained from analyzing the impedance diagrams using the EIS analyzer software program is presented in the inset in Fig. 7. The film resistance (Rf), solution resistance (Rs), film capacitance (Cf) and the double layer capacitance (Cdl) are considered as the main parameters. All the previous electrochemical impedance parameters plus the charge transfer resistances (Rct) and the inhibition efficiency (η%) values are listed in Table 6. The following equation can be used to calculate the values of the inhibition efficiency η% from (Rct) values:12,28,31| | |
η% = (1 − Rct(uninh)/Rct(inh)) × 100
| (9) |
where Rct(uninh) and Rct(inh) are the charge transfer resistance values in the absence and presence of inhibitor molecules, respectively. From Fig. 6(a–c) and data presented in Table 6, it is observed that the values of Rct increased and the values of Cdl decreased gradually with the addition of the as-synthesized inhibitors compared to the blank solution. Furthermore, Rct increases with the increase in aliphatic chain length as shown in Fig. 7; Rct values at 1.05 × 10⁻³ M were 3.75, 4.29 and 4.99 for HBT, DBT and OBT, respectively. At low frequency, the increase in the |Z| mode was due to the increase in the concentration of the inhibitor molecules in the solution. Moreover, this confirms that the adsorbed inhibitor molecules replaced the water molecules in the double layer and formed a protective adherent layer on the electrode surface to protect it from the corrosive medium.43–45 Fig. 6(a–c) show the Bode curves of the copper electrode in seawater before and after adding different concentrations of the as-prepared surfactants. From the Bode plots, it can be observed that there is a significant increase in the impedance value by increasing the inhibitor concentration in the solution, which increases the surface coverage of the metal electrode and exhibits a high inhibition performance.35 Thus, the results obtained here agree with the above-mentioned results for the potentiodynamic polarization measurements. The variation in the statues of copper surface in both the Tafel and EIS techniques is a major reason for changes in the efficiency values.36
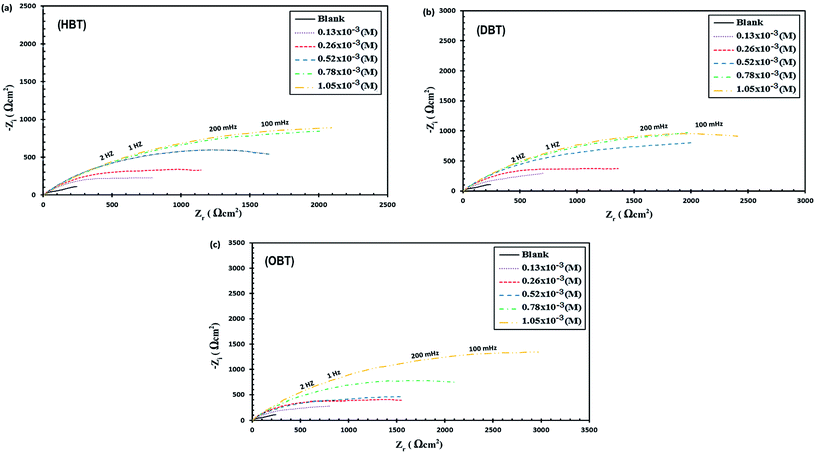 |
| | Fig. 5 Nyquist plot of Cu electrode in seawater with different concentrations of (a) HBT, (b) DBT and (c) OBT. | |
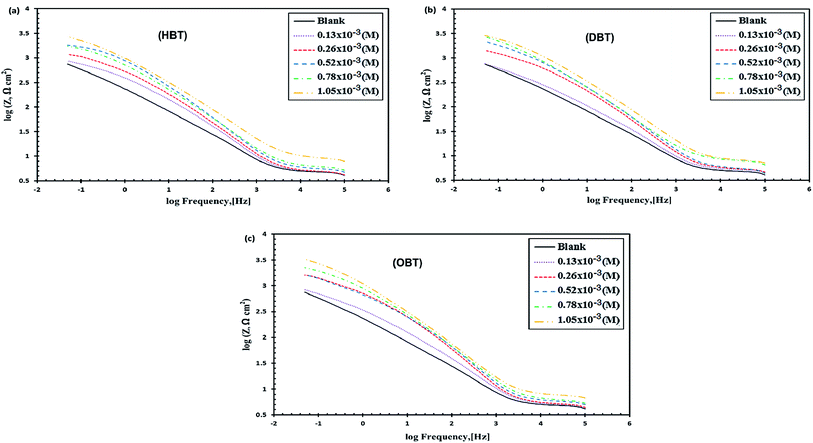 |
| | Fig. 6 Bode plot of Cu electrode in seawater with different concentrations of (a) HBT, (b) DBT and (c) OBT. | |
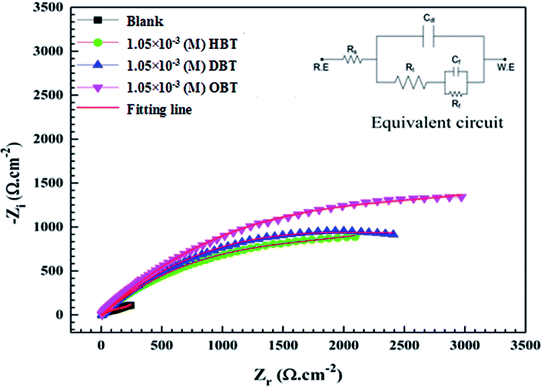 |
| | Fig. 7 EIS curves of the Cu electrode after electrode immersion in stagnant naturally aerated seawater free and containing (1.05 × 10⁻³ M) of the different inhibitors at 298 K. The equivalent circuit is shown inset. | |
Table 6 Electrochemical impedance spectroscopy (EIS) parameters of the copper electrode in naturally aerated stagnant seawater in the absence and presence of different concentrations of HBT, DBT and OBT at 298 K
| |
Conc. (M × 10−3) |
Rs, (Ω cm2) |
Cf, (μF cm−2) × 10−5 |
n1 |
Rf (Ω cm2) |
Cdl, (μF cm−2) × 10−3 |
n2 |
Rct, (kΩ cm2) |
IE% |
| (HBT) |
Blank |
4.65 |
19.83 |
0.7453 |
48.8 |
1.926 |
0.5024 |
0.71 |
— |
| 0.13 |
4.31 |
3.649 |
0.8 |
107.6 |
0.294 |
0.8 |
1.32 |
46.2 |
| 0.26 |
4.22 |
2.797 |
0.8388 |
107.7 |
0.208 |
0.8 |
1.82 |
60.9 |
| 0.52 |
5.26 |
3.509 |
0.8 |
174.5 |
0.146 |
0.4908 |
2.32 |
69.3 |
| 0.78 |
6.32 |
2.788 |
0.7825 |
174.4 |
0.158 |
0.8 |
2.91 |
67.8 |
| 1.05 |
6.31 |
2.948 |
0.7741 |
189.5 |
0.149 |
0.8 |
3.75 |
81 |
| (DBT) |
0.13 |
4.61 |
3.083 |
0.8542 |
62.31 |
0.493 |
0.4719 |
1.41 |
49.6 |
| 0.26 |
4.68 |
2.683 |
0.8407 |
182.4 |
0.173 |
0.4824 |
1.98 |
64.1 |
| 0.52 |
4.43 |
3.871 |
0.7847 |
757.2 |
0.175 |
0.4443 |
2.95 |
75.9 |
| 0.78 |
5.20 |
4.988 |
0.7689 |
225 |
0.160 |
0.4634 |
3.12 |
77.2 |
| 1.05 |
6.32 |
1.543 |
0.844 |
140.6 |
0.119 |
0.5058 |
4.29 |
83.4 |
| (OBT) |
0.13 |
4.39 |
2.871 |
0.8447 |
54.12 |
0.362 |
0.4706 |
1.51 |
52.9 |
| 0.26 |
4.48 |
2.221 |
0.8624 |
263.3 |
0.159 |
0.4684 |
2.18 |
67.4 |
| 0.52 |
5.03 |
2.466 |
0.8381 |
556.4 |
0.225 |
0.4698 |
3.13 |
77.3 |
| 0.78 |
5.37 |
2.262 |
0.8307 |
208.7 |
0.128 |
0.4766 |
3.73 |
80.9 |
| 1.05 |
6.74721 |
2.253 |
0.8211 |
314.3 |
0.104 |
0.4933 |
4.99 |
85.7 |
3.4 Adsorption isotherm
Further information on the interactions between the metal and inhibitor molecules can be understood from the adsorption isotherms. Among the adsorption isotherms, such as Freundlich, Temkin, Dubinin–Radushkevich and Langmuir adsorption isotherms, Langmuir adsorption has successfully fitted this interaction.37 The degree of surface coverage (θ) was calculated from the electrochemical polarization method at different concentrations according to:38| | |
θ = (icorr − icorr(inh)/icorr)
| (10) |
the correlation between surface coverage area (θ) and concentration of the inhibitor molecules (Cinh) was given by Langmuir model through the following equation.| | |
Cinh/θ = 1/Kads + Cinh
| (11) |
where Kads is the adsorption equilibrium constant, Cinh is the inhibitor molar concentration of the investigated surfactants and θ is the degree of surface coverage, and η/100 was attained from the DC polarization technique. Fig. 8 shows the straight line produced by plotting Cinh/θ versus Cinh with the regression coefficient (r2) values; 0.9967, 0.9992 and 0.9961 for HBT, DBT and OBT at 25 °C, respectively. In addition, all slopes as shown in Table 7 are very near to 1. Combining both of the above findings, it can be confirmed that the adsorption of each inhibitor on copper surface completely follows this isotherm.39 The small deviation from unity is generally attributed to the interactions of the adsorbed inhibitor molecules with heterogeneous copper surface. The Kads values are intended from the intercept of the straight line. The values of Kads were associated to the standard free energy of adsorption,  with the following equation.40
| |
 | (12) |
where R (8.314 J mol−1 K−1) is the universal gas constant and T is the absolute temperature. The 55.5 value is related to the concentration of water in solution in M.41 The calculated values of  for all the as-synthesized compounds are recorded in Table 7. The negative sign of
  indicates that the surfactant molecules are spontaneously adsorbed onto the copper surface. It is reported in the literature that if the absolute value of
  is −20 kJ mol−1 or less negative, it indicates that the adsorption of inhibitor molecules on the copper surface is due to the electrostatic interactions between the positive and negative charges located in the quaternary nitrogen and adsorbed chloride on the copper surface respectively, i.e. physisorption. If the absolute value of
  is −40 kJ mol−1 or more negative, it functions by chemical adsorption due to a charge transfer from the surfactant molecule to the copper surface.12 From the obtained data, the calculated values for
  are greater than −20 kJ mol−1 and less than −40 kJ mol−1. Thus, this can be associated with physicochemical adsorption.42
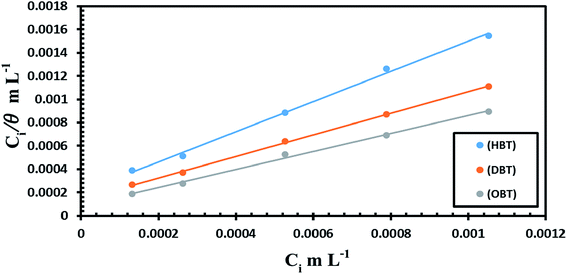 |
| | Fig. 8 Langmuir adsorption isotherm curve (Ci/θ vs. Ci) for the prepared inhibitors on the surface of the copper electrode in seawater at 298 K. | |
Table 7 Thermodynamic parameter for adsorption of the as-prepared inhibitor for copper electrode in seawater at 298 K
3.5 Inhibition mechanism
The inhibition mechanism depends on the adsorption behavior of the inhibitor molecules.
The inhibitor molecules can be adsorbed from the bulk of the solution on metal surface by replacement process with seawater molecules on metal/solution interface. Type of the aggressive solution, molecular structure, the presence of donor atoms, nature and the charge present on the metal surface are the main factors that affect the adsorption process on the metal surface.43 According to Fig. 9, we suggest that the inhibition mechanism may have occurred via physical adsorption involving electrostatic interactions between the positive quaternary nitrogen on the surfactant molecules and the negative adsorbed chloride on the copper surface. In addition, the adsorption of bromide ions on the positively charged copper surface enhanced/synergized the probability of the adsorption process, making a protective layer on the copper surface. Furthermore, chemisorption implicates charge sharing or charge transfer to form a coordinate covalent bond between the copper surface and adsorbed the as-prepared inhibitor molecules. The non-polar carbon-chain has a high electron density that keeps the aggressive chloride anions away from the copper surface. Thus, enhancement in the adsorption property of the as-synthesized compounds on the copper surface is observed.
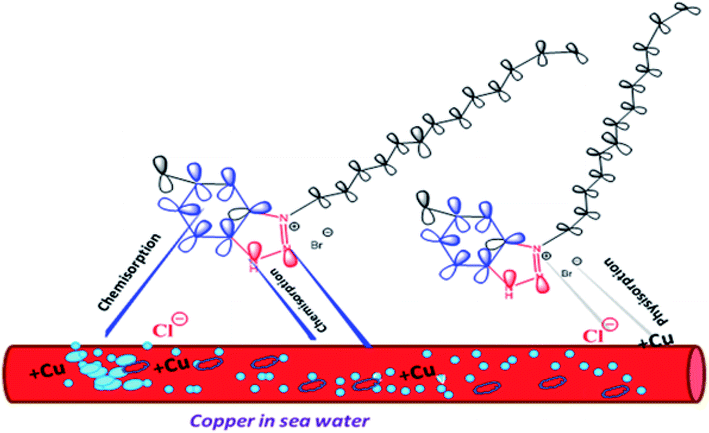 |
| | Fig. 9 Illustration of the adsorption behaviour of the as-prepared inhibitors. | |
3.6 (AFM) surface characterization
The morphology of the copper electrode surface was assessed by atomic force microscopy in the presence and absence of (1.05 × 10⁻³ M) the OBT inhibitor. Fig. 10(a and b) illustrate the surface morphology (3D) of the sample after exposure to seawater solution in the absence and presence of (1.05 × 10⁻³ M) the OBT inhibitor. Fig. 10(a) shows a rough surface of the copper electrode without adding the inhibitor, which strongly damaged because of the dissolution of the metal in the corrosive solution. However, as shown in Fig. 10(b), the presence of (1.05 × 10⁻³ M) the OBT inhibitor impedes the corrosion and gives a smooth surface for the inhibited copper specimen. The value of surface roughness, derived from (AFM) height profile images (Fig. 10) for the copper electrode in the absence of inhibitor and after exposure to seawater is (4.71) μm. In the presence of (1.05 × 10⁻³ M) of the OBT inhibitor, the value decreased to (1.44) μm. The decrease in the roughness is attributed to the protection film being absorbed on the copper surface. The resulting AFM results are well correlated with the previous electrochemical measurements.43–47
 |
| | Fig. 10 AFM micrographs of copper surface (a) in seawater, (b) in presence of (1.05 × 10⁻³ M) of (OBT). | |
3.7 Quantum investigation
Fig. 11 represents the optimized structure for the investigated inhibitors as well as the corresponding frontier molecular distributions (HOMO and LUMO). In accordance to the density functional theory (DFT), the adsorption active centers in inhibitor molecules mainly depend on the HOMO, LUMO's energy and distribution of electron density.11 The inhibitor molecules consist of a polar head involving heteroatoms (N) and π-bond, in which the electron density is focused on them, indicating that these sites are the adsorption active sites that increase the polarity of the molecule: enhancing the adsorption probability and preventing surface interactions with the environment. Table 8 shows the quantum chemical parameter values for the three prepared inhibitors in the gas phase. EHOMO is associated with the capability of the inhibitor to give electrons to the copper surface. From the data obtained in Table 8, OBT has higher EHOMO values (−7.992 eV) than DBT and HBT, indicating that the OBT inhibitor can donate electrons to an empty molecular orbital with low energy with substantially enhanced adsorption process than DBT and HBT43 inhibitors. Moreover, the lower values of ELUMO enhance the capability of the surfactant molecules to accept electrons and improve the inhibition efficiency.48,49 The energy gap, ΔE, is yet another indicator for the reactivity of inhibitor molecules. The higher energy gap (ΔE) between the LUMO and HOMO orbital levels will cause lower inhibition efficiency. This is because removing of an electron from occupied orbital needs very high energy. The computed ΔE values for the three tested inhibitors agree with the trend in the observed experimental data where OBT has the lowest ΔE value. The global hardness value means the stability and reactivity of the molecule. Hard molecules have a high ΔE value and are hence less reactive towards bonding with copper surface than the soft molecule. For the dipole moment (μ), there are some different views in the use of it as a descriptor for inhibition process. The first opinion is the consideration that the increase in the inhibition efficiency is due to the decrease in dipole moment, in which the assemblage of the surfactant molecules in the copper surface will be favored at a small value of dipole moment. The other opinions establish that compound with high dipole moment values react strongly with the metal surface through (dipole–dipole) interactions and give a better inhibition performance.50–52 From Table 8, the values of dipole moment obtained are in the order: OBT < DBT < HBT, which corresponds to the first opinion that the increase in the inhibition efficiency is due to the decrease in dipole moment.53,54 Further calculations included the determination of (I) ionization potential, (X) electronegativity, (A) electron affinity and (η) hardness. These parameters are recorded in Table 8 using the following equations:25where I = −EHOMO and A = −ELUMO. From the values of electronegativity (X) shown in Table 8, we can expect to what extent a molecule can retain its electrons. Decrease in the values of electronegativity (X) leads to the increase in the opportunity of electron donation via the molecule. Moreover, increase in the values of electronegativity (X) leads to a decrease in the opportunity of electron donation via the molecule. From Table 8, the values of electronegativity (X) obtained are in the order: OBT < DBT < HBT, which proposes that the OBT compound has the maximum probability of giving electrons to the metal surface. The sequence of X is compatible with the experimental (η%). The fraction of electron-transferred values (ΔN) from the surfactant molecule to the copper metal is another index showing the affinity of a molecule to give electrons to the metal surface, which can be calculated as follows:17| |
 | (15) |
where XCu and Xinh are the absolute electronegativities of the copper and inhibitor molecule, respectively; ηCu and ηinh refer to the absolute hardnesses of copper and the inhibitor molecule, respectively. The theoretical values of XCu and ηCu are (4.48) eV mol−1 and (0) eV mol−1, respectively.17,55 According to Lukovits et al.,56 if ΔN value is less than 3.6, the tendency of donating electrons to the surface of the metal increases with the increase the ΔN values.56 From Table 8, the values of ΔN for the three tested compounds proceed in the order: OBT > DBT > HBT. Therefore, compound OBT has the maximum capability to provide electrons to the copper surface. Hence, these results are compatible with the experimental results. From the previous data, we can conclude that the computed quantum parameters show a great agreement with the experimental results and suggest the high possibility of providing electrons to the copper surface, which enhances the inhibition efficiency. This suggestion refers to the fact that the adsorption of inhibitor on the copper surface is mainly by electron donation from the high electron density sites of the molecules to the copper surface (Table 9).
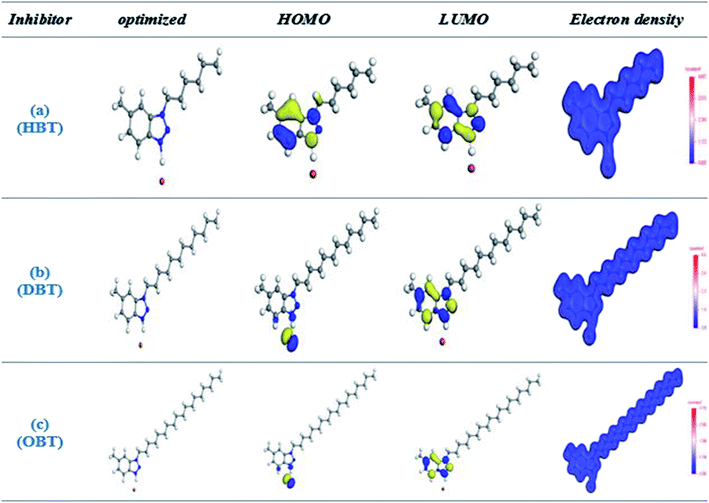 |
| | Fig. 11 The total electron density, (HOMO) and (LUMO) orbital occupation for the investigated inhibitors (a) HBT, (b) DBT and (c) OBT. | |
Table 8 Quantum chemical calculated parameters of the investigated inhibitors
| Inhibitor |
EHOMO (eV) |
ELUMO (eV) |
ΔE (eV) |
A (eV) |
η (eV) |
σ (eV−1) |
I (eV) |
χ (eV) |
ΔN |
μ (Debye) |
| (HBT) |
−8.832 |
−1.843 |
6.989 |
1.843 |
3.494 |
0.286 |
8.832 |
5.3375 |
0.237874 |
6.324 |
| (DBT) |
−8.444 |
−2.247 |
6.197 |
2.247 |
3.098 |
0.322 |
8.444 |
5.3455 |
0.266984 |
6.245 |
| (OBT) |
−7.992 |
−1.881 |
6.111 |
1.881 |
3.055 |
0.327 |
7.992 |
4.9365 |
0.33767 |
6.128 |
Table 9 Comparison between the quantum chemical parameters of the as-prepared (OBT)-cationic surfactant and benzotriazole in another publication
| No. |
Compound |
Method |
EHOMO (eV) |
ELUMO (eV) |
ΔE (eV) |
Ref. |
| 1 |
(OBT) |
PM3 method |
−7.992 |
−1.881 |
6.111 |
Present study |
| 2 |
Benzotriazole |
PM3 method |
−8.433 |
−0.571 |
7.862 |
23 |
4. Conclusion
Three as-prepared cationic surfactants were investigated for their inhibition efficiencies for the corrosion of copper electrode in seawater. The results indicated that all the as-prepared inhibitors could inhibit copper corrosion in seawater and their corrosion inhibition efficiencies increased with the increase in the inhibitor concentrations. The adsorption of the inhibitor molecules was mainly attributed to a physico-chemical adsorption as confirmed from the calculated standard Gibbs free energy values obtained from the Langmuir adsorption model. The (DC) polarization curves designated that the inhibitor molecules acted as mixed type inhibitors, which impeded the dissolution of the metal (anodic) besides oxygen reduction (cathodic). EIS data revealed that the values of (Rct) increased and the values of (Cdl) decreased progressively via increasing the concentrations of the inhibitor molecules compared to the values of the blank solution. Both potentiodynamic polarization and electrochemical impedance techniques show that the η% value of inhibitor OBT is higher than that of HBT and DBT inhibitors. AFM analyses showed a smother surface of electrode after adding the inhibitor molecule, which confirmed the formation of a protective film on the copper surface, preventing it from direct contact with corrosive ions. The obtained results from quantum calculations asserted that the inhibitor molecules could be adsorbed on the copper surface in its active sites and the order of inhibition is OBT > DBT > HBT.
Conflicts of interest
There are no conflicts to declare.
Acknowledgements
Special thanks to the Egyptian Petroleum Research Institute (EPRI) for their support to the laboratories.
References
- A. Cohen, ed. S. D. Cramer and B. S. Covino, ASM Handbook Volume 13B, Corrosion: Materials, ASM International, 2005, vol. 13B Search PubMed.
- A. Drach, I. Tsukrov, J. DeCew, J. Aufrecht, A. Grohbauer and U. Hofmann, Corros. Sci., 2013, 76, 453–464 CrossRef CAS.
- A. M. Nagiub, Port. Electrochim. Acta, 2005, 23, 301–314 CrossRef CAS.
- H. A. El Shayeb, A. El Warraky and E. M. Sherif, Anti-corrosion Methods & Mater., 2004, 51, 52–61 CrossRef.
- J. G. N. Thomas and A. K. Tiller, Br. Corros. J., 1972, 7, 256–262 CrossRef CAS.
- P. Traverso, A. M. Beccaria and G. Poggi, Br. Corros. J., 1994, 29, 110–114 CrossRef CAS.
- H. Nady, M. M. El-Rabiei, M. A. Migahed and M. Fathy, Z. Phys. Chem., 2017, 231, 1179 CAS.
- Y. Zhou, P. Zhang, Y. Zuo, D. Liu and F. Yan, J. Braz. Chem. Soc., 2017, 28, 2490–2499 CAS.
- F. Bentiss, M. Traisnel and M. Lagrenee, Corros. Sci., 2000, 42, 127–146 CrossRef CAS.
- A. Elgendy, A. E. Elkholy, N. M. El Basiony and M. A. Migahed, J. Mol. Liq., 2019, 285, 408–415 CrossRef CAS.
- N. E. Basiony, A. Elgendy, H. Nady, M. Migahed and E. Zaki, RSC Adv., 2019, 9, 10473–10485 RSC.
- M. Migahed, M. EL-Rabiei, H. Nady and E. Zaki, J. Mol. Struct., 2018, 1159, 10–22 CrossRef CAS.
- M. Migahed, M. El-Rabiei, H. Nady and M. Fathy, J. Environ. Chem. Eng., 2016, 4, 3741–3752 CrossRef CAS.
- E.-S. M. Sherif, R. Erasmus and J. Comins, J. Colloid Interface Sci., 2007, 309, 470–477 CrossRef CAS PubMed.
- V. Sharma, M. Borse, S. Jauhari, K. Pai and S. Devi, Tenside Surfactants Deterg., 2005, 42, 163–167 CrossRef CAS.
- M. Finšgar and I. Milošev, Corros. Sci., 2010, 52, 2737–2749 CrossRef.
- M. B. P. Mihajlović, M. B. Radovanović, Ž. Z. Tasić and M. M. Antonijević, J. Mol. Liq., 2017, 225, 127–136 CrossRef.
- Z. Wang, Y. Gong, C. Jing, H. Huang, H. Li, S. Zhang and F. Gao, Corros. Sci., 2016, 113, 64–77 CrossRef CAS.
- A. Popova, M. Christov and A. Vasilev, Corros. Sci., 2007, 49, 3290–3302 CrossRef CAS.
- E. Sherif and S.-M. Park, J. Electrochem. Soc., 2005, 152, B428–B433 CrossRef CAS.
- M. A. Amin, J. Appl. Electrochem., 2006, 36, 215–226 CrossRef CAS.
- M. A. Migahed, N. A. Negm, M. M. Shaban, T. A. Ali and A. A. Fadda, J. Surfactants Deterg., 2016, 19, 119–128 CrossRef CAS.
- K. Khaled, Electrochim. Acta, 2008, 53, 3484–3492 CrossRef CAS.
- F. E.-T. Heakal, S. Rizk and A. Elkholy, J. Mol. Struct., 2018, 1152, 328–336 CrossRef.
- H. Nady, M. El-Rabiei, M. Migahed and M. Fathy, Z. Phys. Chem., 2017, 231, 1179–1209 CAS.
- G. Kear, B. D. Barker, K. Stokes and F. C. Walsh, J. Appl. Electrochem., 2004, 34, 659–669 CrossRef CAS.
- W. A. Badawy, M. M. El-Rabiei and H. Nady, Electrochim. Acta, 2014, 120, 39–45 CrossRef CAS.
- M. A. Migahed, A. A. Attia and R. E. Habib, RSC Adv., 2015, 5, 57254–57262 RSC.
- A. Fateh, M. Aliofkhazraei and A. Rezvanian, Arabian J. Chem., 2017 DOI:10.1016/j.arabjc.2017.05.021.
- M. Finšgar, A. Lesar, A. Kokalj and I. Milošev, Electrochim. Acta, 2008, 53, 8287–8297 CrossRef.
- A. M. Al-Sabagh, M. A. Migahed, S. A. Sadeek and N. M. El Basiony, Egypt. J. Pet., 2018, 27, 811–821 CrossRef.
- G. Moretti, F. Guidi and F. Fabris, Corros. Sci., 2013, 76, 206–218 CrossRef CAS.
- A. Frignani, V. Grassi, F. Zanotto and F. Zucchi, Corros. Sci., 2012, 63, 29–39 CrossRef CAS.
- M. Farsak, H. Keleş and M. Keleş, Corros. Sci., 2015, 98, 223–232 CrossRef CAS.
- N. A. Negm, M. A. Migahed, R. K. Farag, A. A. Fadda, M. K. Awad and M. M. Shaban, J. Mol. Liq., 2018, 262, 363–375 CrossRef CAS.
- M. Hosseini, M. Ehteshamzadeh and T. Shahrabi, Electrochim. Acta, 2007, 52, 3680–3685 CrossRef CAS.
- E. Stupnišek-Lisac, A. Gazivoda and M. Madžarac, Electrochim. Acta, 2002, 47, 4189–4194 CrossRef.
- N. Helal and W. Badawy, Electrochim. Acta, 2011, 56, 6581–6587 CrossRef CAS.
- H. Tian, W. Li and B. Hou, Corros. Sci., 2011, 53, 3435–3445 CrossRef CAS.
- S. Martinez and I. Stern, Appl. Surf. Sci., 2002, 199, 83–89 CrossRef CAS.
- X. Wang, H. Yang and F. Wang, Corros. Sci., 2010, 52, 1268–1276 CrossRef CAS.
- P. Kannan, J. Karthikeyan, P. Murugan, T. S. Rao and N. Rajendran, J. Mol. Liq., 2016, 221, 368–380 CrossRef CAS.
- A. Yurt, B. Duran and H. Dal, Arabian J. Chem., 2014, 7, 732–740 CrossRef CAS.
- P. Mourya, S. Banerjee and M. M. Singh, Corros. Sci., 2014, 85, 352–363 CrossRef CAS.
- A. A. Abd-Elaal, N. Elbasiony, S. M. Shaban and E. Zaki, J. Mol. Liq., 2018, 249, 304–317 CrossRef CAS.
- S. A. El Wanees, N. ElBasiony, A. Al-Sabagh, M. Alsharif, S. A. El Haleem and M. Migahed, J. Mol. Liq., 2017, 248, 943–952 CrossRef.
- N. D. Nguyen, G. Zhang, J. Lu, A. E. Sherman and C. L. Fraser, J. Mater. Chem., 2011, 21, 8409–8415 RSC.
- M. Özcan, İ. Dehri and M. Erbil, Appl. Surf. Sci., 2004, 236, 155–164 CrossRef.
- N. Khalil, Electrochim. Acta, 2003, 48, 2635–2640 CrossRef CAS.
- P. Singh, E. E. Ebenso, L. O. Olasunkanmi, I. B. Obot and M. A. Quraishi, J. Phys. Chem. C, 2016, 120, 3408–3419 CrossRef CAS.
- N. Soltani, M. Behpour, E. E. Oguzie, M. Mahluji and M. A. Ghasemzadeh, RSC Adv., 2015, 5, 11145–11162 RSC.
- E. E. Oguzie, C. K. Enenebeaku, C. O. Akalezi, S. C. Okoro, A. A. Ayuk and E. N. Ejike, J. Colloid Interface Sci., 2010, 349, 283–292 CrossRef CAS PubMed.
- C. J. Casewit, K. S. Colwell and A. K. Rappe, J. Am. Chem. Soc., 1992, 114, 10046–10053 CrossRef CAS.
- L. O. Olasunkanmi, I. B. Obot, M. M. Kabanda and E. E. Ebenso, J. Phys. Chem. C, 2015, 119, 16004–16019 CrossRef CAS.
- A. Zarrouk, B. Hammouti, A. Dafali, M. Bouachrine, H. Zarrok, S. Boukhris and S. S. Al-Deyab, J. Saudi Chem. Soc., 2014, 18, 450–455 CrossRef.
- I. Lukovits, E. Kalman and F. Zucchi, Corrosion, 2001, 57, 3–8 CrossRef CAS.
|
| This journal is © The Royal Society of Chemistry 2019 |
Click here to see how this site uses Cookies. View our privacy policy here.  Open Access Article
 *b,
H. Elfekyc and
M. M. EL-Rabieic
 values imply that the three as-prepared compounds show physicochemical adsorption and obey the Langmuir adsorption model. AFM technique observed the reduction in the surface roughness due to the protective film formed on the copper surface. Finally, computational calculations show a great correlation with the experimental results due to the electron-donating effect.
![[thin space (1/6-em)]](https://www.rsc.org/images/entities/char_2009.gif) 000–0.05 Hz with a peak to peak amplitude of 5 mV.20,21 PDP was executed over the sweeping potential range of −500 to 60 mV at a scan rate of 2 mV s−1. Electrochemical impedance parameters have been fitted using the Zm view software with a suitable equivalent circuit. Before every measurements, the Cu electrode was polished by consecutive emery papers ranking from 600 to 2500 grit and was then carefully washed with bi-distilled water and dried using a soft paper. Subsequently, direct dipping in the corrosive medium was done. To obtain the desired concentration from the as-prepared inhibitors, a certain amount of inhibitor was dissolved into the seawater samples. Series of solutions with lower concentrations were prepared by dilution. To verify the reproducibility, every experiment was repeated at least three times.
000–0.05 Hz with a peak to peak amplitude of 5 mV.20,21 PDP was executed over the sweeping potential range of −500 to 60 mV at a scan rate of 2 mV s−1. Electrochemical impedance parameters have been fitted using the Zm view software with a suitable equivalent circuit. Before every measurements, the Cu electrode was polished by consecutive emery papers ranking from 600 to 2500 grit and was then carefully washed with bi-distilled water and dried using a soft paper. Subsequently, direct dipping in the corrosive medium was done. To obtain the desired concentration from the as-prepared inhibitors, a certain amount of inhibitor was dissolved into the seawater samples. Series of solutions with lower concentrations were prepared by dilution. To verify the reproducibility, every experiment was repeated at least three times.
![[double bond, length as m-dash]](https://www.rsc.org/images/entities/char_e001.gif) C aromatic stretching of benzene. Typical bands, 2956–2862 cm−1 (aliphatic C–H stretching),13 in the FTIR spectrum confirmed the presence of predicted functional groups in the as-prepared compounds. 1H NMR spectrum of the as-prepared compound (HBT) is shown in Fig. 2. The spectrum shows different bands at δ = 0.882 ppm (t, 3H, CH3 (CH2)3CH2CH2N), δ = 1.321 ppm (m, 6H, CH3 (CH2)3CH2CH2N), δ = 1.65 ppm (m, 2H, CH3 (CH2)3CH2CH2N), δ = 2.01 ppm (m, 2H, CH3(CH2)3CH2CH2N), δ = 3.51 ppm (s, 3H, CH3-toluidene nucleus), δ = 9.45 ppm (s, 1H, NH) δ = 7.35 ppm (d, 1H, 4-benzene nucleus) and δ = 7.84 (s, 1H, 6-benzene nucleus). The chemical composition of the as-synthesized cationic surfactants (HBT, DBT and OBT) (Scheme 1) was confirmed by the elemental analysis using a Vario Elementar Analyzer (Hanau, Germany), (Table 3). The data of elemental analysis confirmed the purity of the as-synthesized inhibitors.
C aromatic stretching of benzene. Typical bands, 2956–2862 cm−1 (aliphatic C–H stretching),13 in the FTIR spectrum confirmed the presence of predicted functional groups in the as-prepared compounds. 1H NMR spectrum of the as-prepared compound (HBT) is shown in Fig. 2. The spectrum shows different bands at δ = 0.882 ppm (t, 3H, CH3 (CH2)3CH2CH2N), δ = 1.321 ppm (m, 6H, CH3 (CH2)3CH2CH2N), δ = 1.65 ppm (m, 2H, CH3 (CH2)3CH2CH2N), δ = 2.01 ppm (m, 2H, CH3(CH2)3CH2CH2N), δ = 3.51 ppm (s, 3H, CH3-toluidene nucleus), δ = 9.45 ppm (s, 1H, NH) δ = 7.35 ppm (d, 1H, 4-benzene nucleus) and δ = 7.84 (s, 1H, 6-benzene nucleus). The chemical composition of the as-synthesized cationic surfactants (HBT, DBT and OBT) (Scheme 1) was confirmed by the elemental analysis using a Vario Elementar Analyzer (Hanau, Germany), (Table 3). The data of elemental analysis confirmed the purity of the as-synthesized inhibitors.


 represent the values of corrosion current densities with and without the inhibitor molecules, respectively. The well-known Stern–Geary equation was used to determine the polarization resistance values (Rp):


 with the following equation.40
 for all the as-synthesized compounds are recorded in Table 7. The negative sign of
  indicates that the surfactant molecules are spontaneously adsorbed onto the copper surface. It is reported in the literature that if the absolute value of
  is −20 kJ mol−1 or less negative, it indicates that the adsorption of inhibitor molecules on the copper surface is due to the electrostatic interactions between the positive and negative charges located in the quaternary nitrogen and adsorbed chloride on the copper surface respectively, i.e. physisorption. If the absolute value of
  is −40 kJ mol−1 or more negative, it functions by chemical adsorption due to a charge transfer from the surfactant molecule to the copper surface.12 From the obtained data, the calculated values for
  are greater than −20 kJ mol−1 and less than −40 kJ mol−1. Thus, this can be associated with physicochemical adsorption.42


