
 Open Access Article
 This Open Access Article is licensed under a Creative Commons Attribution-Non Commercial 3.0 Unported Licence
Keggin-structure heteropolyacid supported on alumina to be used in trans/esterification of high-acid feedstocks†
Leyvison Rafael V. da Conceição ab,
Cristiano E. R. Reisa,
Rosemar de Limaa,
Daniela V. Corteza and
Heizir F. de Castro*a
ab,
Cristiano E. R. Reisa,
Rosemar de Limaa,
Daniela V. Corteza and
Heizir F. de Castro*a
aEngineering School of Lorena-University of São Paulo, 12602-810, Lorena, São Paulo, Brazil. E-mail: heizir@usp.br
bInstitute of Exact and Natural Sciences, Federal University of Pará, 66075-110, Belém, Brazil
First published on 29th July 2019
Abstract
Heteropolyacids (HPA) with Keggin structures, such as H3PMo12O40 (H3PMo), have been described as efficient catalysts in trans/esterification reactions due to their tolerance to water and free fatty acids contents, with particularly well-suited characteristics of high proton mobility and stability. The versatile array of HPA is considerably increased when such catalysts are supported onto solid matrices. In this sense, Al2O3 was assessed as support for H3PMo to be used in trans/esterification reactions to produce biodiesel from high-acid feedstocks. The catalyst structure was characterized and applied on trans/esterification reaction of acid oils using ethanol as acyl acceptor. A face centered composite design was employed to conduct the experimental design and results analysis, taking macaw palm oil as study model. The process achieved an optimum level of 99.8% ester content and 4.1 mm2 s−1 viscosity under the following reaction conditions: 190 °C reaction temperature, 50![[thin space (1/6-em)]](https://www.rsc.org/images/entities/char_2009.gif) :1 ethanol-to-oil molar ratio and 13.0% catalyst concentration. Other tested feedstocks (fungal single cell oil and residual frying oil) were also tested promoting satisfactory results, though the parameters were found to be slightly outside the limits set by the USA (ASTM D6715) standard. The H3PMo/Al2O3 catalyst presented good regeneration and can be reused for up to four reaction cycles and requires lower ethanol-to-oil ratio, temperature, and catalyst concentration in comparison with other data from the literature.
:1 ethanol-to-oil molar ratio and 13.0% catalyst concentration. Other tested feedstocks (fungal single cell oil and residual frying oil) were also tested promoting satisfactory results, though the parameters were found to be slightly outside the limits set by the USA (ASTM D6715) standard. The H3PMo/Al2O3 catalyst presented good regeneration and can be reused for up to four reaction cycles and requires lower ethanol-to-oil ratio, temperature, and catalyst concentration in comparison with other data from the literature.
Introduction
The utilization of heteropolyacids (HPA) as catalysts has attracted interest from both Academic and Industrial settings due to their versatility and ease of use in acid catalysis. HPA with Keggin structures, such as H3PW12O40, H4SiW12O40, H3PMo12O40, and H4SiMo12O40, have been described to be efficiently used in trans/esterification reactions due to their high water and free fatty acid tolerance, with particularly well-suited characteristics of high proton mobility and stability due to their strong Brønsted-profile.1 Despite the numerous advances over the past years, a few challenges remain as the focus of study, particularly increasing the thermal stability, specific area, and solubility in polar media. The versatile array of HPA is considerably increased when such catalysts are supported onto solid matrices, such as activated carbon,2 zirconia,3 silica,4 and niobia.5The characteristics of the support have some direct implications on the performance of the HPA catalyst. While zirconia and titanium-based oxides have been demonstrated to be excellent supports for HPA,6 the use of such catalysts is hindered by the costs associated with the matrices, which often affect the economics of bulk-production chemicals, such as biodiesel. On the other hand, the use of lower-cost supports, such as alumina, have been linked to higher observable leaching effects, as demonstrated by Sheikh et al.,6 who demonstrated that 12-tungstophosphoric acid supported on Al2O3 leached at a higher rate when compared to the same HPA supported on ZrO2 and SiO2. However, many of the expected outcomes on the utilization of HPA supported on Al2O3 are not optimized in the literature and are often discredited when compared to other supports in screening studies. In this sense, this study aims to synthesize, characterize and optimize the performance of a 12-phosphomolybdic acid catalyst supported on aluminum oxide (H3PMo/Al2O3) through simultaneous esterification and transesterification reaction to produce biodiesel from high-acid feedstocks. A factorial design was used to determine optimal variable conditions, such as reaction temperature, alcohol-to-oil molar ratio and catalyst concentration, taking macaw palm oil as a study model. The established conditions were also applied to perform trans/esterifications of others high acid feedstocks, such as residual frying and microbial oils.
Ethanol was used as acyl acceptor due to some advantages when used in a process for biodiesel production. It has a superior dissolving power in vegetable oils and the ethyl esters (FAEE) show lower smoke opacity, lower exhaust temperature and lower pour point.7 Additionally, unlike methanol (which is generally derived from fossil sources), ethanol is produced mainly from renewable sources via fermentation processes, and because its large scale production as a substitute fuel for gasoline already exists, the supply of bioethanol for the industrial production of biodiesel can be easily achieved.7,8
Experimental
Materials
Macaw palm oil was supplied by the Association of Small Farmers D'Antas (Minas Gerais, Brazil). Residual Frying Oil (RFO) was obtained from a local vendor and was filtered to remove food and other particulates. Fungal Single Cell Oil (SCO) was obtained from the culture of Mucor circinelloides URM 4182 in sugarcane vinasse.9 The characterization in regards to fatty acid distribution and acidity of the used oils is described in Table 1. Aluminum oxide (Calcined Alumina A-1) containing 98.8% Al2O3 and with surface area of 67.70 m2 g−1 was donated by Alcoa Alumínio S.A. (Poços de Caldas, Minas Gerais, Brazil), and was calcined at 300 °C for 3 h before use. 12-Molybdophosphoric acid (H3PMo12O40) and anhydrous ethanol (98.0%) were purchased from the Vetec® Sigma-Aldrich. All the other chemical reagents and solvents were of analytical grade and used without further purification.| Fatty Acid (%) | Oil source | ||
|---|---|---|---|
| Macaw palm | RFO | Fungal SCO | |
| C8:0 | — | — | 1.64 |
| C10:0 | — | — | 1.57 |
| C12:0 | — | 3.69 | 9.32 |
| C14:0 | — | — | 5.76 |
| C16:0 | 18.7 | 20.62 | 35.11 |
| C16:1 | 4.0 | — | 2.96 |
| C18:0 | 2.8 | 2.51 | 2.3 |
| C18:1 | 53.4 | 27.75 | 21.06 |
| C18:2 | 17.7 | 43.71 | 10.99 |
| C18:3 | 1.5 | 1.72 | 9.28 |
| Saturated fatty acids (%) | 21.5 | 26.8 | 55.7 |
| Monounsaturated fatty acids (%) | 57.4 | 27.8 | 24.02 |
| Polyunsaturated fatty acids (%) | 19.2 | 45.4 | 20.27 |
| Acidity (mg KOH g−1) | 39.0 | 3.94 | 67.4 |
Preparation of the HPA catalyst
H3PMo/Al2O3 was prepared via incipient-wetness impregnation. In a typical synthesis, the heteropolyacid mass was dissolved in an alcoholic solution 70 wt% at room temperature, transferred to a ceramic crucible containing the support (Al2O3) and then mixed. The solid formed was then dried at 100 °C for 30 min, followed by calcination at 300 °C for 2 cycles of 1 h, followed by a final cycle of 3 h. H3PMo/Al2O3 catalysts were prepared using three different impregnation concentrations, 10, 20 and 30 wt. H3PMo % relative to the support. The catalysts were subjected to the analysis of surface acidity and preliminary catalytic tests performed under fixed reaction conditions: temperature of 175 °C, ethanol-to-oil molar ratio of 40:1 and catalyst concentration of 10.0%, in order to evaluate the catalytic activity and to determine the best impregnation concentration of the catalyst to be employed throughout the study.
Catalytic reaction
The performance of the catalyst prepared with the selected H3PMo impregnation was evaluated by simultaneous esterification and transesterification reactions of all feedstocks with ethanol. Before the reactions, the catalyst was thermally activated at 120 °C for 2 h. All catalytic tests were performed on pressurized stainless steel reactor (Parr Series 5500 HPCL Compact Reactors) equipped with an electrical heating jacket covering the reaction vessel. The reaction time and agitation parameters were set at 4 h and 700 rpm, respectively.Taking the macaw palm oil as study model, the effects of the process variables: reaction temperature (X1) from 100 to 200 °C, ethanol-to-oil molar ratio (X2) from 20:1 to 60:1 and catalyst concentration (X3) from 5.0 to 15.0 wt% (oil basis) were evaluated on response variables: ester content (Y1) and viscosity (Y2). The data were analyzed using Statistica 13® and the coefficients were interpreted using Fisher's test. The accuracy and general ability of these polynomial models were evaluated by the coefficients of determination R2. A 95% significance level (p < 0.05) was applied for all analyses.
Downstream process and catalyst stability
At the end of the runs performed with macaw palm and residual frying oils, the catalyst was separated from the reaction mixture by centrifugation at 1570 × g for 15 min. The reaction mixture was transferred to a separatory funnel and washed with portions of hot distilled water (80 °C) for 12 h to allow separation between the ethyl esters and glycerol phases. This washing step was performed three times to ensure complete glycerol removal. Finally, the ethyl esters were dried with anhydrous sodium sulfate to remove residual water.10 It is important to mention that crude biodiesel from microbial oil a dry washing using Amberlite was adopted following methodology described by Santos et al.11The stability of the recovered catalyst was evaluated in successive batch runs performed under optimal process condition using macaw palm oil as feedstock. The recovered catalyst was washed three times with t-butanol (10 mL), thermally activated at 120 °C for 2 h and then used in another cycle under the same reaction conditions.
Analytical methods
The N2 adsorption–desorption isotherms were measured at 77 K by using a Nova 1000 mark Quantachrome. Before measurements, about 0.2 g of sample was pre-treated under 2 h vacuum at 200 °C for removal impurities adsorbed on the catalyst surface. The surface area measurements were calculated according to the standard Brunauer–Emmett–Teller method (BET), the pore diameter and volume were obtained by the Barret–Joyner–Halenda (BJH) method.The surface acidity of the catalyst was determined using acid-base titration method. An aqueous suspension of 0.1 g of catalyst in 20 mL of NaOH (0.1 mol L−1) was stirred for 3 h at room temperature. The suspension was centrifuged and the supernatant titrated with HCl solution (0.1 mol L−1) in the presence of phenolphthalein. The surface acidity of the catalysts was expressed in mmol H+ g−1.12
X-ray diffraction (XRD) analysis of the synthesized catalyst was carried out using a PANalytical Model Empyrean X-ray diffractometer at 40 kV and 30 mA. Cu Kα (1.541874 Â) 2θ radiation was used at a range of 8–70° to generate diffraction patterns at ambient temperature. The catalyst morphology was analyzed by a high-resolution scanning electron microscopy (SEM) on a LEO Model 1450 VP microscope, operating at 20 kV acceleration voltage. Fourier transforms infrared (FTIR) spectra were recorded on a PerkinElmer spectrometer model FTIR System Spectrum GX. Samples were pressed in KBr, and the spectra obtained in the range of 4000–400 cm−1 with a resolution of 4 cm−1 over a sum of 32 scans.
The ester contents were analyzed by gas chromatography (Varian, model CP 3800) with a flame ionization detector (FID) using a TR FAME capillary column (30 m length, 0.25 mm internal diameter, and 0.25 μm film thickness) following methodology described by Conceição et al.12 Methyl heptadecanoate (C17:0) was used as an internal standard reference. Ester content was expressed as mass fraction in terms of percentage. Viscosity was determined according to the standard method ASTM D 445 with a LVDVII Brookfield viscometer (Brookfield Viscometers Ltd, England) equipped with a CP 42 cone at 40 °C using 0.5 mL of sample. Density value was determined according to the standard method ASTM D 4052 with a DMA 35N EX digital densimeter (Anton Paar) at 20 °C using 2 mL of sample. Residual acylglycerol contents were determined in an Agilent 1200 Series liquid chromatograph (Agilent Technologies, USA) equipped with an Evaporative Light Scattering Detector and a Gemini C-18 (5 μm, 150 × 4.6 mm, 110 Å) column at 40 °C following methodology described by Carvalho et al.13
Results and discussion
Catalyst characterization and effect of HPA/support ratio
Acidity is one of the most important property that a solid catalyst must have, especially when used in processes involving simultaneous esterification and transesterification reactions for biodiesel production.12 Thus, catalyst performance at different H3PMo impregnation concentrations was used to determine suitable impregnation loading that could afford high conversion rate of macaw palm oil into ester. The surface acidity of catalysts shows a significant increase, as there is greater H3PMo impregnation. For instance, the surface acidity of the catalyst increased from 4.95 to 9.60 mmol H+ g−1 when the ratio of H3PMo/Al2O3 increased from 10 to 30 wt%. The surface acidity follows a proportional behavior with the ratio of H3PMo/Al2O3, as an intermediate measurement was made at 20 wt% ratio, which promoted a surface acidity of 6.30 mmol H+ g−1, which fits within the limit readings of 10 and 30 wt%. Under the investigated conditions (ethanol molar ratio 1:60, at 150 °C), a moderate efficiency was attained with the catalyst being impregnated at 30.0% H3PMo, which provided biodiesel samples containing 80.0% ester and 6.7 mm2 s−1 viscosity. Interestingly, the impregnation of H3PMo onto Al2O3 provided a catalyst with greater acidity (9.60 mmol H+ g−1) than values previously reported of H3PMo supported onto Nb2O5 (5.644 mmol H+ g−1) at the same ratio of H3PMo and mineral support (30 wt%).
The XRD analysis was used to confirm whether H3PMo was in its crystalline form or dispersed when supported. X-ray diffraction patterns of the Al2O3 support, pure H3PMo and H3PMo/Al2O3 catalyst are shown in Fig. 1. As it can be seen, curve (a) presents a typical XRD pattern of Al2O3 at 2θ; according to Evangelista et al.,14 values of 19.5°, 32.5°, 37.5°, 39.5°, 45.5°, 62.0° and 67.4° are characteristics of an amorphous, tetragonal and monophasic structure. The XRD diffractogram of pure H3PMo has crystalline features with distinct diffraction planes and high intensities. The XRD pattern of pure H3PMo (curve (b)) revealed typical reflections of heteropolyacids by the presence of peaks at about 2θ values of 12.0°, 18.0°, 25.5°, 26.0°, 27.0°, 28.0°, 30.5°, 34.0° and 35.5°, which are characteristics of crystalline H3PMo. The XRD pattern of H3PMo/Al2O3 catalyst shows features of both phases, i.e. the amorphous phase of alumina (amorphous halos) as well as peaks of crystalline phases of H3PMo. In the curve analysis (c), it is possible to observe the presence of peaks of H3PMo crystalline phase at 12.0°, 18.0°, 26.0°, 28.0° and 35.5°, i.e. the Keggin structure, as verified in the pure H3PMo diffraction pattern. This demonstrates that H3PMo was widely dispersed on the Al2O3 support.
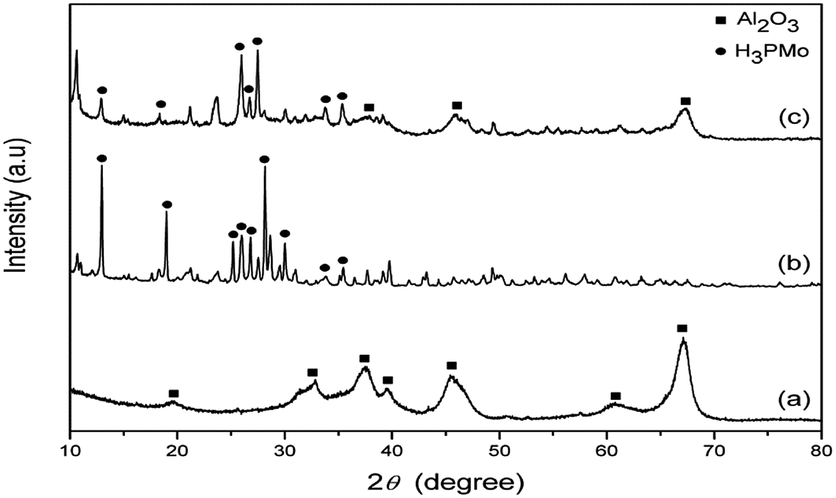 | ||
| Fig. 1 XRD patterns of (a) Al2O3 support, (b) pure H3PMo and (c) H3PMo/Al2O3. | ||
SEM images of the Al2O3 support and H3PMo/Al2O3 catalyst are exhibited in Fig. 2. The alumina support structure (Fig. 2(a)) is rough and contains pores that results in high specific surface area in which H3PMo could be anchored, and reveal irregular particles with a non-uniform morphology of spherical agglomerates whose diameter ranges from 20 to 100 μm. The SEM image of the H3PMo/Al2O3 catalyst (Fig. 2(b)) suggests that H3PMo was widely dispersed throughout the alumina support surface, thus leading to specific surface area reduction and evidencing the impregnation success.
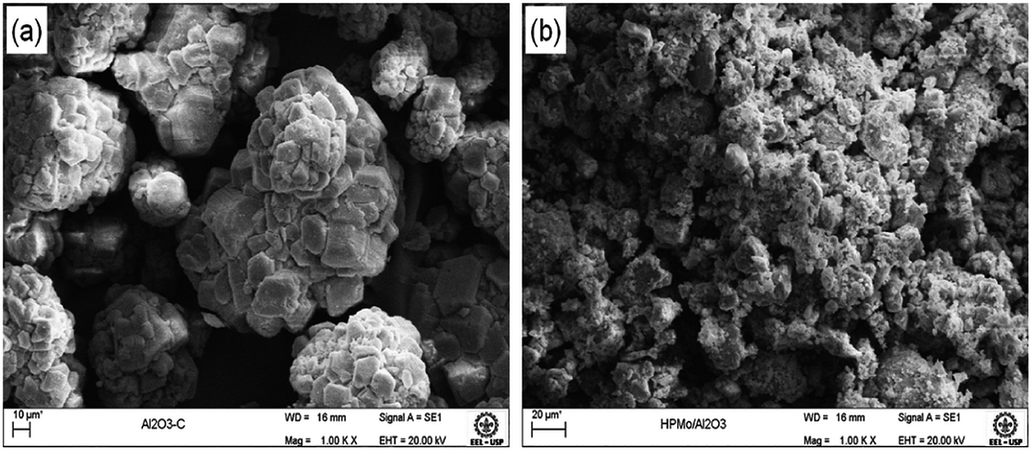 | ||
| Fig. 2 SEM images of (a) Al2O3 support and (b) H3PMo/Al2O3 catalyst. | ||
The FTIR spectra of the Al2O3 support and H3PMo/Al2O3 catalyst are displayed in Fig. 3, which shows a typical alumina infrared spectrum. For such a material, Al ions can occupy two sub lattices: tetrahedral sites and octahedral sites. The band close to ∼620 cm−1 is attributed to a stretching vibration of the AlO6 atomic group, while the a ∼800 cm−1 structure is a result of the AlO4 atomic group stretching which is the reason why the Al–O bonds are shorter.15,16
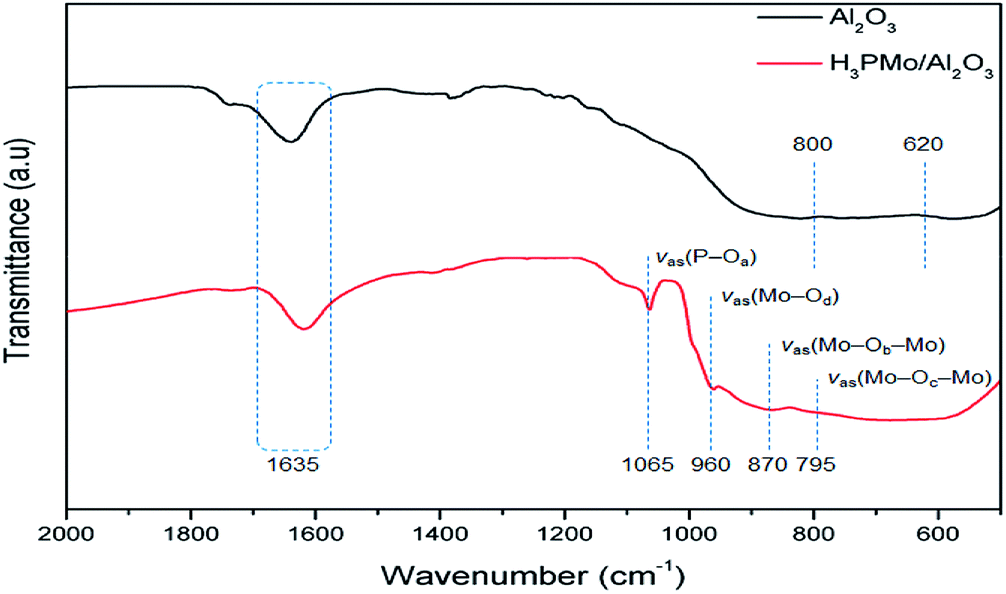 | ||
| Fig. 3 FTIR spectra of the Al2O3 support and H3PMo/Al2O3 catalyst. | ||
The H3PMo/Al2O3 catalyst spectrum shows four bands in the range of 1100–750 cm−1. Bands at 1065, 960, 870 and 795 cm−1 are characteristics of the Keggin structure, which are the result of νas(P–Oa), νas(Mo–Od), νas(Mo–Ob–Mo) and νas(Mo–Oc–Mo), respectively, (in which Oa is the oxygen atom bound to 3Mo atoms and the central P atom; Ob and Oc are the bridging oxygen atoms; and Od is the terminal oxygen atom). These absorption bands are consistent with previously reported data.17,18 The band at around 1635 cm−1 was equally pronounced in both materials, which was attributed to the O–H stretching vibration.
Table 2 presents the values of BET surface areas, pore volume and average pore diameters for the H3PMo/Al2O3 catalyst. Data indicate a remarkable decrease between the BET surface area value of the Al2O3 support (67.70 m2 g−1) and the H3PMo/Al2O3 catalyst (31.66 m2 g−1) after impregnation, which was attributed to the effect of HPMo deposition on the support, thereby resulting in partial blocking of the porous network. However, this is an expected behavior of high HPMo loading at 30.0 wt%. Similar discussion can be made to the pore volume of the support and the catalyst, which decreased, respectively from 0.188 cm3 g−1 to 0.048 cm3 g−1, and the pore size, which increased from 6.97 nm to 7.83 nm.
| Sample | Surface area (m2 g−1) | Pore size (nm) | Pore volume (cm3 g−1) |
|---|---|---|---|
| Al2O3 | 67.70 | 6.97 | 0.188 |
| H3PMo/Al2O3 | 31.66 | 7.83 | 0.048 |
The N2 adsorption–desorption isotherms and pore size distribution for the H3PMo/Al2O3 catalyst are shown in Fig. 4. The isotherm (Fig. 4(a)) corresponded to type IV, according to the IUPAC classification, and showed a characteristic hysteresis loop (H2) in a relative pressure (P/P0) range of 0.4–1.0, which was due to capillary condensation taking place in the mesoporous material. Fig. 4(b) shows that a pore size distribution centered in the range of 3.0–16.0 nm is a typical characteristic of a mesoporous material.19
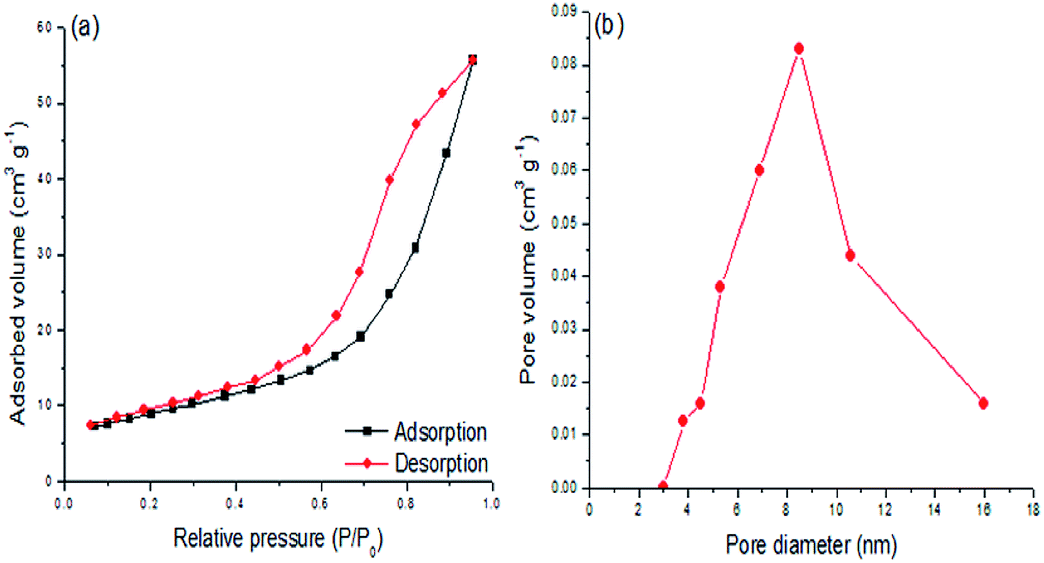 | ||
| Fig. 4 (a) N2 adsorption–desorption isotherms and (b) pore size distribution of the H3PMo/Al2O3 catalyst. | ||
Statistical model determination
Experimental points of both real and coded values are presented in Table 3, along with experimental results for ester content and viscosity value at specific design points. 18 runs were performed randomly in order to minimize errors from systematic trends in variables. The obtained data were examined by the analysis of variance (ANOVA) for fitting second-order response surface models by the least square method and to assess their goodness of fit. The models significance was evaluated by the probability value (p-value); at 95% confidence level, (p-values of less than 0.05 indicate significant effects). Coefficient terms with p-values of over 0.05 were not significant, thus being removed from the regression models.| Run | Variables | Responses | |||
|---|---|---|---|---|---|
| Temp. (°C) | EtOH:oil (mol mol−1) |
Catalyst (oil wt%) | Ester content (%) | Viscosity (mm2 s−1) | |
| 1 | 100 | 20 | 5 | 3.20 | 38.45 |
| 2 | 100 | 20 | 15 | 12.70 | 29.9 |
| 3 | 100 | 60 | 5 | 12.85 | 27.9 |
| 4 | 100 | 60 | 15 | 14.70 | 29.4 |
| 5 | 200 | 20 | 5 | 90.55 | 6.30 |
| 6 | 200 | 20 | 15 | 95.75 | 6.00 |
| 7 | 200 | 60 | 5 | 96.55 | 5.35 |
| 8 | 200 | 60 | 15 | 98.80 | 5.15 |
| 9 | 100 | 40 | 10 | 13.70 | 31.4 |
| 10 | 200 | 40 | 10 | 96.05 | 5.85 |
| 11 | 150 | 20 | 10 | 93.25 | 6.35 |
| 12 | 150 | 60 | 10 | 96.20 | 6.45 |
| 13 | 150 | 40 | 5 | 59.55 | 11.45 |
| 14 | 150 | 40 | 15 | 86.85 | 6.45 |
| 15 | 150 | 40 | 10 | 81.75 | 6.85 |
| 16 | 150 | 40 | 10 | 82.00 | 6.70 |
| 17 | 150 | 40 | 10 | 83.05 | 6.90 |
| 18 | 150 | 40 | 10 | 81.25 | 7.15 |
Statistical significance and fitness of the developed equations as well as the effects of individual terms and their interactions were analyzed by the ANOVA as summarized on Table 4. The models quality of fit was evaluated by Fisher's test (F-value), the probability value (p-value) and determination coefficients.
| Variable response | Sources | SS | DF | MS | F-Value | p-Value, prob > F |
|---|---|---|---|---|---|---|
| a SS = sum of squares, DF = degree of freedom, MS = mean squares. | ||||||
| Ester content | Model | 22303.6 |
9 | 2478.17 | 88.20 | <0.0000* |
| Residual | 224.82 | 8 | 28.10 | |||
| Lack of fit | 223.09 | 5 | 44.62 | 77.51 | 0.0023 | |
| Pure error | 1.73 | 3 | 0.58 | |||
| Cor total | 22528.4 |
17 | ||||
| R2 | 0.9900 | |||||
| Radj2 | 0.9788 | |||||
| Viscosity | Model | 2282.07 | 9 | 253.56 | 93.2 | <0.0000* |
| Residual | 21.75 | 8 | 2.72 | |||
| Lack of fit | 21.65 | 5 | 4.33 | 123.7 | 0.0011 | |
| Pure error | 0.10 | 3 | 0.03 | |||
| Cor total | 2303.82 | 17 | ||||
| R2 | 0.9905 | |||||
| Radj2 | 0.9800 | |||||
Based on the coded parameters, quadratic regression models with determined coefficients are given by eqn (1) and (2)
| Y1 = 83.1 + 42.1X1 − 29.3X12 + 2.4X2 + 10.6X22 + 4.6X3 − 10.9X32 − 1.3X2X3 | (1) |
| Y2 = 7.2 − 25.7X1 + 22.2X12 − 2.6X2 − 2.2X22 − 2.5X3 + 2.9X32 + 2.3X1X2 + 1.6X1X3 + 2.5X2X3 | (2) |
Data on Table 4 show that both models presented high F-values, i.e. 88.20 ester content and 93.22 viscosity with very low p-values (both <0.0000), thereby indicating that both predictive quadratic models were highly significant for the experimental data. The models significance and adequacy were also tested by using the determination coefficient (R2) and adjusted determination coefficient (Radj2). Their R2 and Radj2 values were very high, R2 = 0.9900 and Radj2 = 0.9788 (ester content) and R2 = 0.9905 and Radj2 = 0.9800 (viscosity). These values suggest that both models explain 98% of the experimental data variability on average (only 2% variation in ester content and viscosity could not be explained by the developed models), thence evidencing high significance of the models and an excellent correlation between predicted and observed values, as it can be seen in Fig. S1 (ESI†).
Interactive effects of process variables on responses variables were studied by plotting three-dimensional surface curves versus two independent variables, while keeping another variable at their central (0) level. 3D curves of ester content and viscosity from the interactions between variables are shown in Fig. 5.
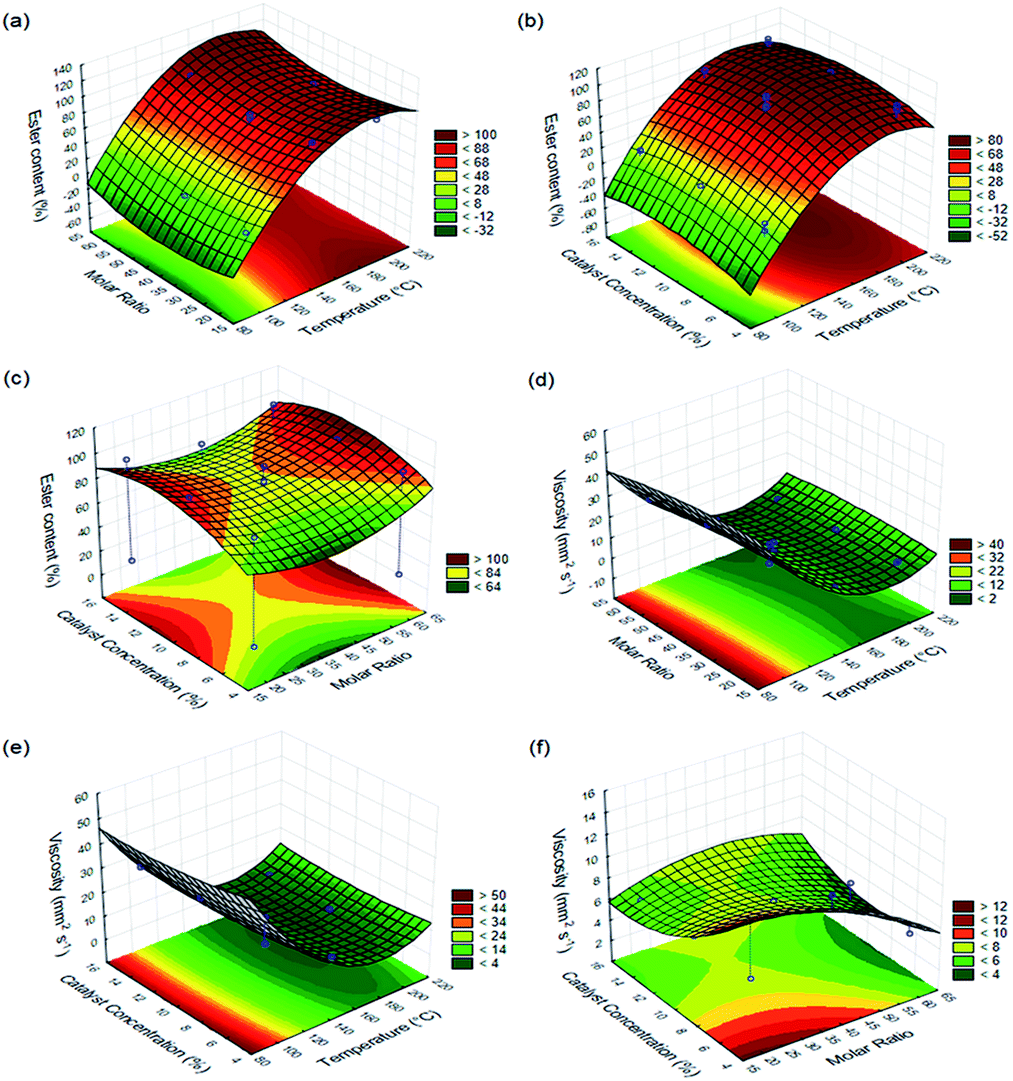 | ||
| Fig. 5 3D Response surface and contour plots for ester content vs. (a) temperature and molar ratio (b) temperature and catalyst concentration, (c) molar ratio and catalyst concentration, and for viscosity vs. (d) temperature and molar ratio, (e) temperature and catalyst concentration, (f) molar ratio and catalyst concentration. | ||
The 3D curves of ester content and viscosity from the interactions between variables are shown in Fig. 5. Fig. 5(a) demonstrates the effect of an interaction between independent variables of reaction temperature and ethanol-to-oil molar ratio on ester content at a constant catalyst concentration of 10.0%. Based on the surface plot, it can be observed that the independent variable of reaction temperature exerts a great influence on ester content, since an increase in reaction temperature values leads to biodiesel having significantly higher ester content. Ester content values of over 98.0% are obtained by any value used in the molar ratio variable, however, reaction temperature at or greater than 180 °C must necessarily be set. Fig. 5(b) shows the response surface and contour plots for the combined effect of reaction temperature and catalyst concentration on ester content at a constant ethanol-to-oil molar ratio of 40:1. The results demonstrate that ester content increases as temperature and catalyst concentration also increase. Ester content values (higher than 98.0%) were obtained when reaction temperature and catalyst concentration were close to 180 °C and 12.0%, respectively. Fig. 5(c) shows the effect of ethanol-to-oil molar ratio and catalyst concentration on ester content, while keeping reaction temperature at 150 °C. The same Fig. 5(c) shows that high ester contents are obtained by selecting values that are close to low and high levels of ethanol-to-oil molar ratio, 20:1 and 60:1, respectively, along with catalyst concentrations between 8.0 and 12.0%. However, ester content values of over 98.0% are achieved when using an ethanol-to-oil molar ratio of 60:1 and catalyst concentration of 11.0%. Fig. 5(d) represents the effect of varying reaction temperature and ethanol-to-oil molar ratio on biodiesel viscosity at a constant catalyst concentration of 10.0%. It clearly shows that the influence of temperature is statistically significant over the studied experimental range, which has a positive influence on biodiesel viscosity (low values are desired) as reaction temperature increased, regardless of the molar ratio being used. The biodiesel viscosity decreased to approximately 4.0 mm2 s−1 when reaction temperature was between 170 and 190 °C at whatever molar ratio. Fig. 5(e) shows the viscosity response for interactive factors of catalyst concentration and reaction temperature at a constant ethanol-to-oil molar ratio of 40:1. A significant decreased in the biodiesel viscosity (reaching values of around 4.0 mm2 s−1) was observed when the catalyst concentration increased from 10.0 and 14.0% and temperature raised from 170 and 190 °C. On the other hand, it was noted that the biodiesel viscosity tends to increase under extreme conditions, for example by processing the reaction at catalyst concentrations of over 14.0% and reaction temperatures above 190 °C. Fig. 6(f) represents the dependency of biodiesel viscosity on both ethanol-to-oil molar ratio and catalyst concentration at a constant reaction temperature of 150 °C. The lowest biodiesel viscosity values (4.0–5.0 mm2 s−1) were obtained by processing the reaction at a molar ratio of 60:1 and intermediate values for catalyst concentration of around 10%.
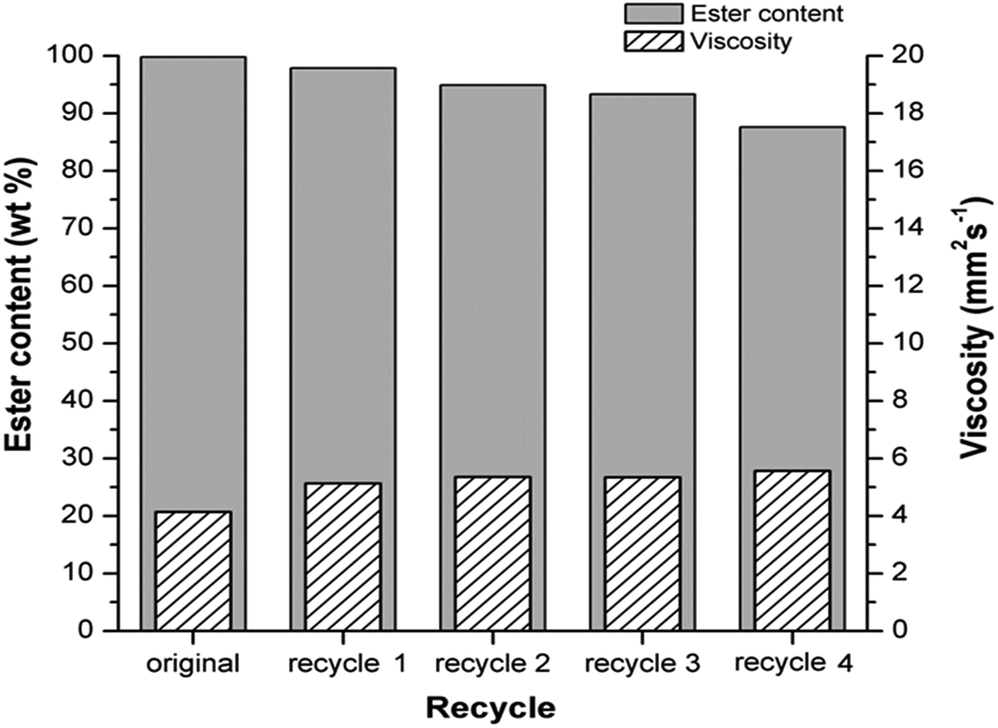 | ||
| Fig. 6 Reusability study of H3PMo/Al2O3 catalyst. Reaction conditions: temperature at 190 °C, ethanol-to-oil molar ratio of 50:1 and catalyst concentration of 13.0%. | ||
An optimization process was also carried out by Derringer's desirability function.20 The general function optimization procedure is used to find optimal conditions of independent variables (within the specified experimental range) for overall response desirability. Both ester content and viscosity responses were simultaneously optimized by this desirability function. The data described in the ESI† show the set of desirability graphs for the responses. For the ester content response variable, any value of over 95.0% satisfies the desirability, thus the value of 1 was selected. In regards to the viscosity response variable, satisfactory values are those below 6.0 mm2 s−1, hence 1 was attributed to this value. Based on the RSM analyses and desirability results optimum conditions of the macaw palm biodiesel production at the studied variables are: reaction temperature of 190 °C, ethanol-Ester content and viscosity responses predicted under these conditions were 99.8% and 4.1 mm2 s−1, respectively.
The models were verified as regards their predictability by analyzing the residual plots that are resulted from the difference between actual and predicted values of responses (ester content and viscosity). This analysis was carried out by using the normal probability plot of residual, residual vs. run orders and residual vs. the predicted response (ESI†). In order to evaluate the quality of the biodiesel produced under optimal process conditions, some properties were analyzed and the results met the specification of biodiesel (B100) standardized by international agencies, including USA (ASTM D6715) and Brazil (ANP 45/2014). In addition to excellent ester content and viscosity presented by macaw palm ethyl biodiesel, low values of monoacylglycerol and absence of diacylglycerol are extremely important for product quality, which indicate optimal conversion of oil into biodiesel. These contaminant values are very low and do not affect properties such as density, which was 880 kg m−3, which is within the limits established by the same standards.
Application of the catalyst on other feedstocks
The optimized conditions were applied on trans/esterification reactions of residual frying oil and fungal single cell oil with ethanol as acyl acceptor in order to verify the robustness of the catalyst and the statistical model developed using macaw palm oil as feedstock. The two tested oils have been described in the literature as highly acidic,21,22 which often pose additional difficulty in the trans/esterification reaction. The optimized results, using a catalyst ratio of 13 wt%, ethanol-to- oil molar ratio of 50:1, reaction time of 4 h, and temperature of 190 °C. Results are shown in Table 5.
| Quality parameters | Macaw palm oil | Fungal single cell oil | Residual frying oil | Standard value specification (ANPa 45/2014) |
|---|---|---|---|---|
| a ANP: Brazilian National Agency of Petroleum, Natural Gas and Biofuels. | ||||
| Density (kg m−3) at 20 °C | 880 | 915 | 870 | 860–900 |
| Viscosity (mm−2 s−1) 40 °C | 4.2 | 6.8 | 6.0 | 1.9–6.0 |
| Ester content (wt%) | 98.80 | 94.39 | 96.01 | Min. 96.5 |
| Monoacylglycerol (wt%) | 0.87 | 4.17 | 3.51 | Max. 0.7 |
| Diacylglycerol (wt%) | 0.33 | 1.44 | 0.48 | Max. 0.2 |
The results demonstrate that the optimized conditions provided satisfactory conversions of other oil feedstocks to ethyl esters. The conversion of SCO to FAEE is often limited by the viscosity of the oil and the presence of other lipid materials, which are not saponifiable.23 The residual products of the trans/esterification of SCO to biodiesel were mainly monoacylglycerols (4.82 wt%), with a minor amount of diacylglycerols (0.79 wt%), demonstrating that a possible increase in the reaction time would likely provide greater conversion yields, and subsequently lower viscosity values for such ester mixtures. The conversion of residual frying oil, on the other hand, was likely to be limited to the water content of the feedstock, similar to what has been described in the literature.24 While there were only monoacylglycerols present as residual ester products (3.99 wt%) from the reaction of residual frying oil to ethyl esters, the ester mixture presented a relatively high acid value (0.92 mg KOH g−1), indicating that a possible water activity in the oil likely provided hydrolysis of the esters, generating free fatty acids in the medium.
Therefore, while the catalyst prepared showed certain robustness towards the conversion of other oils of high acid value, the utilization of SCO and RFO as feedstocks for FAEE production was partially limited due to factors that are not present in macaw palm oil. Nonetheless, the results are promising and demonstrate that the reaction conditions can be extrapolated to other feedstock.
Catalyst recycling and comparison of operational conditions for similar reactions
One of the most important factors of heterogeneous catalysts that contribute to catalytic performance is stability against deactivation and leaching of the active sites during the reaction. Three consecutive catalytic cycles of simultaneous esterification and transesterification reactions were carried out under the optimal reaction conditions established by this work (temperature of 190 °C, ethanol-to-oil molar ratio of 50:1 and catalyst concentration of 13.0%). After the end of the first run, the used catalyst was removed from the reaction mixture by centrifugation, and then washed with t-butanol three times to eliminate both polar and non-polar compounds adsorbed on the catalyst surface. Then the recovered catalyst was dried at 120 °C and used for the second, third and fourth catalytic cycles, respectively, under the same experimental conditions and regeneration method (Fig. 6).
The H3PMo/Al2O3 catalyst showed good catalytic stability by maintaining ester content of over 87.0%, a reduction of approximately 12.0% from its original ester content and biodiesel viscosity below 6.0 mm2 s−1 after the fourth cycle. These results are consistent with data from an investigation conducted by Talebian-Kiakalaieh et al.,25 whereby the catalyst was reused in four cycles for producing biodiesel from waste cooking oil with high free fatty acid content, which presented conversion reduction of approximately 15.0%.
From a process perspective, it can be demonstrated that, albeit still high temperatures and relatively harsh conditions are required for the trans/esterification reaction to occur satisfactorily, the H3PMo/Al2O3 catalyst presents some advantages in comparison with previous reports from the literature. Table 6 resumes some applications of H3PMo supported on different materials. In summary, it can be seen that even at a lower ethanol-to-oil molar ratio, there is a higher ester production. Especially considering the study on trans/esterification of macaw palm oil using H3PMo support on Nb2O5 (ref. 12), it can be clearly seen that lower amounts of catalyst and molar ratio, and lower reaction temperatures are required for the heteropolyacid supported onto Al2O3 for a similar ester content obtained in the end of the reaction. Therefore, the results described herein may represent an alternative to reaction conditions in which the acid behavior of the catalyst is intrinsically linked to the product formation, as is the case of trans/esterification reactions of oils with high acid values and in the presence of residual dissolved water.
| Support | Reaction | Ester content (%) | Reference |
|---|---|---|---|
| a In relation to the oil or acid. | |||
| Al2O3 | Transesterification of macaw palm oil with ethanol: temperature of 190 °C, oil-to-alcohol molar ratio of 1:50, catalyst concentrationa of 13% and reaction time of 4 h |
99.6 | Present study |
| Nb2O5 | Transesterification of macaw palm oil with ethanol: temperature of 210 °C, oil-to-alcohol molar ratio of 1:90, catalyst concentrationa of 20% and reaction time of 4 h |
99.65 | 12 |
| Al2O3 | Transesterification of microbial oil with ethanol: temperature of 200 °C, oil-to-alcohol molar ratio of 1:120, catalyst concentration of 10% and reaction time of 4 h |
97 | 13 |
| Activated carbon fibers | Esterification of palmitic acid with methanol: temperature of 40–60 °C, acid-to-alcohol molar ratio of 1:97, catalyst concentration of 8% and reaction time of 6 h |
∼80 | 26 |
| SBA-16 | Esterification of crude karanj oil with methanol: temperature of 140 °C, acid-to-alcohol molar ratio of 1:8, catalyst concentration of 2.5% and reaction time of 5 h |
81.8 | 27 |
| SBA-15 | Esterification of palmitic acid with methanol: temperature of 60 °C, acid-to-alcohol molar ratio of 1:93, catalyst concentration of 10% and reaction time of 6 h |
45 | 28 |
Conclusions
The present study has investigated and optimized the effects of different process variables on biodiesel production from macaw palm oil using as catalyst H3PMo supported on Al2O3. The H3PMo/Al2O3 catalyst presented good regeneration and can be reused for up to four reaction cycles with little loss of activity. The results also demonstrated to be robust in terms of reproduction with other high-acid feedstock.Considering that biodiesel is commercially made from pure and refined vegetable oils or animal fats, the economic and environmental costs of biodiesel production are often questioned in regards to their sustainability. High-acid value oils are those that are likely prone to partial degradation in which part of the triacylglycerol structures are partially or fully hydrolyzed to free fatty acids. These oils cannot undergo through typical operations for producing biodiesel, i.e., through base-catalyzed reactions, as the main product of the reaction would be soap. This work assesses the use of a particular type of solid catalyst for the production of biodiesel through simultaneous esterification of free fatty acids and transesterification of triacylglycerols to fatty acid ethyl esters of fuel grade. The solid catalyst used in this study was a heteropolyacid, which is able to withstand high concentrations of free water in the reaction medium, as well as the presence of free fatty acids. Studies evaluating the performance of heteropolyacids as catalysts often use a solid support in order to increase their reaction and operation stability, which are often based in some metal oxides, like titania and zirconia, or other mineral-like structure, as zeolites and activated carbon. In order to potentially drive the costs associated with the preparation of the catalyst, this work assessed the utilization of alumina (Al2O3) as solid support for the catalyst. The use of the alumina-supported heteropolyacid was tested on the reaction of oil extracted from macaw palm, a plant native to Brazil with little commercial applications that provides a high-acid value oil, achieving over 98% of conversion on the established reaction conditions. The optimized conditions were also tested on other two feedstocks, residual frying oil and fungal single cell oil, demonstrating that the operational conditions are rather robust and can be extrapolated to other oil sources. Therefore, the reaction conditions established, and the engineering premises evaluated on the reaction conditions, are not limited to the use of macaw palm oil, per se, but potentially a wide array of feedstock with little to no commercial value, as residual frying oil.
Conflicts of interest
There are no conflicts to declare.Acknowledgements
This work was supported by the São Paulo Research Foundation (FAPESP) (process numbers 2016/10636-8 and 2017/12907-8), Conselho Nacional de Desenvolvimento Científico e Tecnológico CNPq (Process Number 404812/2013-9) and CAPES (financial code 001).References
- J. Alcañiz-Monge, B. El Bakkali, G. Trautwein and S. Reinoso, Appl. Catal., B, 2018, 224, 194–203 CrossRef.
- P. Ferreira, I. M. Fonseca, A. M. Ramos, J. Vital and J. E. Castanheiro, Catal. Commun., 2011, 12(7), 573–576 CrossRef CAS.
- S. Zhu, Y. Zhu, X. Gao, T. Mo, Y. Zhu and Y. Li, Bioresour. Technol., 2013, 130, 45–51 CrossRef CAS PubMed.
- Y. Izumi, K. Hisano and T. Hida, Appl. Catal., A, 1999, 181(2), 277–282 CrossRef CAS.
- E. Caliman, J. A. Dias, S. C. Dias, F. A. Garcia, J. L. de Macedo and L. S. Almeida, Microporous Mesoporous Mater., 2010, 132(1–2), 103–111 CrossRef CAS.
- R. Sheikh, M. S. Choi, J. S. Im and Y. H. Park, J. Ind. Eng. Chem., 2013, 19(4), 1413–1419 CrossRef CAS.
- M. F. M. Yusoff, X. Xu and Z. Gui, J. Am. Oil Chem. Soc., 2014, 91, 525–531 CrossRef CAS.
- C. Brunschwig, W. Moussavou and J. Blin, Prog. Energy Combust. Sci., 2012, 38, 283–301 CrossRef CAS.
- C. E. R. Reis, A. K. F. Carvalho, H. B. Bento and H. F. de Castro, Bioresource Technology Reports, 2019, 6, 46–53 CrossRef.
- L. R. V. da Conceição, L. M. Carneiro, J. D. Rivaldi and H. F. de Castro, Ind. Crops Prod., 2016, 89, 416–424 CrossRef.
- F. D. Santos, L. R. V. da Conceição, A. Ceron and H. F. de Castro, Appl. Clay Sci., 2017, 149, 41–50 CrossRef CAS.
- L. R. V. Conceição, L. M. Carneiro, D. S. Giordani and H. F. de Castro, Renewable Energy, 2017, 113, 119–128 CrossRef.
- A. K. F. Carvalho, L. R. V. Conceição, J. P. A. Silva, V. H. Perez and H. F. de Castro, Fuel, 2017, 202, 503–511 CrossRef CAS.
- J. P. C. Evangelista, T. Chellappa, A. C. F. Coriolano, V. J. Fernandes Jr, L. D. Souza and A. S. Araujo, Fuel Process. Technol., 2012, 104, 90–95 CrossRef CAS.
- G. Paglia, C. E. Buckley, T. J. Udovic, A. L. Rohl, F. Jones, C. F. Maitland and J. Connolly, Chem. Mater., 2004, 16, 1914–1923 CrossRef CAS.
- A. Boumaza, L. Favaro, J. Lédion, G. Sattonnay, J. B. Brubach, P. Berthet, A. M. Huntz, P. Roy and R. Tétot, J. Solid State Chem., 2009, 182, 1171–1176 CrossRef CAS.
- D. Liu, X. Y. Quek, S. Hu, L. Li, H. M. Lim and Y. Yang, Catal. Today, 2009, 147, 51–57 CrossRef.
- D. S. Mansilla, M. R. Torviso, E. N. Alesso, P. G. Vázquez and C. V. Cáceres, Appl. Catal., A, 2010, 375, 196–204 CrossRef CAS.
- S. S. Kale, U. Armbruster, R. Eckelt, U. Bentrup, S. B. Umbarkar, M. K. Dongare and A. Martin, Appl. Catal., A, 2016, 527, 9–18 CrossRef CAS.
- G. Derringer and R. Suich, J. Qual. Technol., 1980, 12, 214–219 CrossRef.
- C. Ratledge, Biochimie, 2004, 86(11), 807–815 CrossRef CAS PubMed.
- S. C. da Silva Filho, A. C. Miranda, T. A. F. Silva, F. A. Calarge, R. R. de Souza, J. C. C. Santana and E. B. Tambourgi, J. Cleaner Prod., 2018, 183, 1034–1042 CrossRef.
- M. Khot, S. Kamat, S. Zinjarde, A. Pant, B. Chopade and A. RaviKumar, Microb. Cell Fact., 2012, 11(1), 71 CrossRef CAS PubMed.
- E. A. Canesin, C. C. de Oliveira, M. Matsushita, L. F. Dias, M. R. Pedrão and N. E. de Souza, Electron. J. Biotechnol., 2014, 17(1), 39–45 CrossRef.
- A. Talebian-Kiakalaieh, N. A. S. Amin, A. Zarei and I. Noshadi, Appl. Energy, 2013, 102, 283–292 CrossRef CAS.
- J. Alcañiz-Monge, G. Trautwein and J. P. Marco-Lozar, Appl. Catal., A, 2013, 468, 432–441 CrossRef.
- M. S. Khayoon and B. H. Hameed, Fuel Process. Technol., 2013, 114, 12–20 CrossRef CAS.
- A. I. Tropecêlo, M. H. Casimiro, I. M. Fonseca, A. M. Ramos, J. Vital and J. E. Castanheiro, Appl. Catal., A, 2010, 390, 183–189 CrossRef.
Footnote |
| † Electronic supplementary information (ESI) available. See DOI: 10.1039/c9ra04300d |
| This journal is © The Royal Society of Chemistry 2019 |