 Open Access Article
Design and fabrication of polypyrrole/expanded graphite 3D interlayer nanohybrids towards high capacitive performance†
Jue Wangab,
Dong Fua,
Binqiao Rena,
Ping Yua,
Xiaochen Zhanga,
Weijun Zhanga and
Kan Kan *ab
*ab
aHeilongjiang Academy of Sciences, Institute of Advanced Technology, Harbin 150020, China. E-mail: kankan.has@foxmail.com
bKey Laboratory of Functional Inorganic Material Chemistry, Ministry of Education, School of Chemistry and Material Science, Heilongjiang University, Harbin, 150080, China
First published on 26th July 2019
Abstract
Polypyrrole/expanded graphite (PPy/EG) nanohybrids, with a hierarchical structure of a three dimensional EG framework with a thick PPy coating layer, have been synthesized via a vacuum-assisted intercalation in situ oxidation polymerization method. In the synthesis, pyrrole monomers were intercalated into the irregular pores of EG with the assistance of a vacuum pump. Subsequently, the intercalated pyrrole monomers assembled on both sides of the EG nanosheets and formed PPy by an in situ polymerization method. As electrode materials, the typical PPy/EG10 sample with an EG content of 10% had a high specific capacitance of 454.3 F g−1 and 442.7 F g−1 (1.0 A g−1), and specific capacitance retention rate of 75.9% and 73.3% (15.0 A g−1) in 1 M H2SO4 and 1 M KCl electrolytes, respectively. The two-electrode symmetric supercapacitor showed a high energy density of 47.5 W h kg−1 at a power density of 1 kW kg−1, and could retain superb stability after 2000 cycles. The unique self-supporting structure feature and homogeneous PPy nanosphere coating combined the contributions of electrochemical double layer capacitance and pseudo-capacitance, which made the nanohybrids an excellent electrode material for high performance energy storage devices.
Introduction
Supercapacitors, as one of the next generation eco-friendly energy storage devices, have attracted extensive research attention due to their large capacitance, high power density and long cycle life.1–3 According to the charge storage mechanism, supercapacitors are classified into two categories: electrochemical double-layer capacitors (EDLCs) and pseudo-capacitors. The pseudo-capacitors show 10–100 times higher specific capacitances than EDLCs due to the involvement of a faradaic charge storage mechanism, which is related to redox reactions taking place in the bulk of the active materials.4 Due to its excellent properties, such as high conductivity, excellent chemical and environmental stability, low cost and facile synthesis, polypyrrole (PPy) has been widely used in lithium ion batteries,5 sodium ion batteries,6 gas sensors,7 electrochemical sensors,8 genosensors,9 photocatalytic degradation,10 the hydrogen evolution reaction,11 the oxygen reduction reaction,12 etc. In particular, it has a high theoretical specific capacitance, and is considered as the most promising electrode material, showing excellent capacitance characteristics in both acidic and neutral electrolytes,13–16 and it has been widely used in all kinds of supercapacitors.17,18 In the process of charging and discharging, the conductive polymer produces pseudo-capacitance by reversible redox reactions of doping and dedoping.19–24 The utilization of PPy can be enhanced further by controlling the dose of dopant. At the same time, PPy was designed in various micro-morphologies to enhance the pseudo-capacitance of supercapacitors, including nanowires,19–21 nanosheets,22 nanotubes,23,24 nanobrushes,25,26 and hollow microspheres.27 Nevertheless, the poor mechanical strength of PPy, such as the fracture of the molecular chains during charging and discharging, and the large volumetric swelling and shrinking of the molecular chains during electrolyte ion doping/dedoping, influences the cycle life of supercapacitors.20,28To overcome these drawbacks, considerable efforts have been focused on combining PPy with carbon materials.3 Carbon materials supply a framework for polymer growth, which could enhance the strength of the polymer chains.24 Meanwhile, the framework of carbon materials could further increase the electrical conductivity of the nanohybrids.13 Many recent studies have demonstrated that supercapacitors made of conductive polymer/carbon-based composites have a higher specific capacitance than single materials. Various carbon-based material structures have been used, including zero dimensional structures such as carbon dots (CDs);29 one dimensional structures such as carbon nanotubes (CNTs)30–33 and carbon nanofibers (CNFs);26,34–38 two dimensional structures such as graphene28,39–45 and graphene oxide;46,47 and three dimensional structures assembled with CNTs, CNFs and graphene.48–53 Furthermore, carbon-based materials made from cellulose fibers could provide a natural three dimensional interwoven structure; such a 3D interwoven structure has excellent mechanical stability, and electrode materials of cellulose fiber combined with PPy show perfect capacitance characteristics.54–58 Among the carbon materials, graphene shows the best electrochemical stability. Therefore, it is considered as a promising material for application in supercapacitors. However, the challenge is keeping the graphene sheets well separated, avoiding aggregation which is induced by π–π stacking and van der Waals interactions.15,37 Therefore, we chose EG for its cost effectiveness and easy fabrication. In particular the unique self-supporting structure avoids the aggregation of the sheets and it has rarely been used as an electrode material.59,60
Herein, we focused on polypyrrole/expanded graphite (PPy/EG) nanohybrids, which were prepared by a vacuum-assisted intercalation in situ oxidation polymerization method without surfactant.61,62 The EG with a hierarchical structure was a unique 3D carbon-based framework. The pyrrole (Py) could homogeneously adhere on both sides of the EG nanosheets without surfactant, and then a PPy coating was directly grown on the nanosheets during the polymerization reaction. The special structure endowed the PPy/EG nanohybrids with the following advantages in energy storage: (i) the perfect conductivity of EG could promote the rapid transport of electrons during the charging/discharging processes; (ii) the hierarchical structure could facilitate the transport of electrolyte ions over the whole material surfaces; (iii) the self-supported structure of EG as a framework could avoid the fracture of the polymer chains during the doping/dedoping processes. The PPy/EG nanohybrids as supercapacitor electrode materials exhibited high specific capacitance and energy density, and improved cycling stability in both acid and neutral electrolytes. The PPy/EG nanohybrids prepared in this work could be considered to have great potential for large-scale supercapacitor applications.
Experimental
Materials
All chemical reagents used were of analytical grade, including pyrrole (Py), hydrochloric acid (HCl), ammonium persulfate (APS) and ethanol, and were purchased from Energy Chemical. Expandable graphite (45 μm) was purchased from Qingdao Tianyuan Company. EG was prepared by means of intermittent microwave heating.Preparation of PPy/EG nanohybrids
The PPy/EG nanohybrids were fabricated as follows. Pyrrole monomers were added into ethanol and ultrasonicated. The Py–ethanol solution was added into the interlayers of EG by a vacuum-assisted intercalation method. The mixed solution was transferred to a round-bottom flask, and 60 mL of 1 M HCl aqueous solution was introduced into the above solution. The mixed solution was cooled to 0–5 °C and stirred for 2 h. APS (nPy![[thin space (1/6-em)]](https://www.rsc.org/images/entities/char_2009.gif) :
:![[thin space (1/6-em)]](https://www.rsc.org/images/entities/char_2009.gif) nAPS = 1
nAPS = 1![[thin space (1/6-em)]](https://www.rsc.org/images/entities/char_2009.gif) :
:![[thin space (1/6-em)]](https://www.rsc.org/images/entities/char_2009.gif) 1) in 20 mL of 1 M HCl aqueous solution was slowly added into the flask by a constant pressure drop funnel with stirring. The polymerization was allowed to proceed at 0–5 °C for 24 h. Finally, the resultant PPy/EG nanohybrids were collected by centrifugation and then washed successively with deionized water and ethanol until the filtrate was colorless and neutral. The resultant products were dried at 60 °C for 24 h and ground to obtain black powders. The PPy/EG nanohybrids were derived from precursors with the EG contents of 5%, 10% and 15%. They were named PPy/EG5, PPy/EG10 and PPy/EG15, respectively. For comparison, pure-PPy was prepared under the same conditions.
1) in 20 mL of 1 M HCl aqueous solution was slowly added into the flask by a constant pressure drop funnel with stirring. The polymerization was allowed to proceed at 0–5 °C for 24 h. Finally, the resultant PPy/EG nanohybrids were collected by centrifugation and then washed successively with deionized water and ethanol until the filtrate was colorless and neutral. The resultant products were dried at 60 °C for 24 h and ground to obtain black powders. The PPy/EG nanohybrids were derived from precursors with the EG contents of 5%, 10% and 15%. They were named PPy/EG5, PPy/EG10 and PPy/EG15, respectively. For comparison, pure-PPy was prepared under the same conditions.
Material characterization
Morphology and structures were investigated by scanning electron microscopy (SEM, HITACHI S-4800) with an acceleration voltage of 5 kV. Thermo-gravimetric analysis (TGA) was performed on a TA-SDTQ600 Instrument, with a heating rate of 10 °C min−1 in N2. The crystal phase of the samples was characterized by X-ray powder diffraction (XRD, Rigaku D/MAX-III-B-40 kV, Japan, Cu-Kα radiation, λ = 1.5406 Å). The samples were dried for 10 h at 150 °C under vacuum before the measurements. Fourier transform infrared spectroscopy (FTIR PerkinElmer Spectrometer) was carried out using a Bruker Vector 22 and KBr pellets. Raman measurements were examined by using a Thermo Scientific Nicolet 6700 spectrometer (OMNIC, Thermo Fisher Scientific Inc.) with a laser excitation wavelength of 458 nm. The Brunauer–Emmett–Teller (BET) surface area of the products was measured by N2 adsorption–desorption (TriStar II 3020). Morphology and structures were further researched by transmission electron microscopy (TEM, JEOL-2100) with an acceleration voltage of 200 kV. The surface of the samples was examined by X-ray photoelectron spectroscopy (XPS), which was performed with a VGESCALAB MK II using MgKα (1253.6 eV) achromatic X-ray radiation.Preparation of electrodes and electrochemical measurements
The electrode material mixtures were prepared by the solvent evaporation method with 80 wt% active material powders, 10 wt% carbon black and 10 wt% polyvinylidene fluoride dried powder (PVDF), which were dissolved in N-methyl-2-pyrrolidone (NMP).For the three electrode test, the working electrode was prepared by coating the mixtures onto a platinum mesh electrode (1 × 1 cm2) and drying at 80 °C for 12 h in a vacuum oven. A platinum plate electrode (1 × 1 cm2) was employed as the counter electrode. A standard calomel electrode (SCE) with saturated KCl solution was used as the reference electrode. A 1 M H2SO4 solution or a 1 M KCl solution was used as the electrolyte. The electrochemical impedance spectroscopy (EIS), cyclic voltammetry (CV) and galvanostatic charge–discharge (GCD) measurements were performed on a CHI660E electrochemical working station. The EIS data were evaluated and the measured data fitted using the specialized data acquisition program “Zview”. The specific capacitance was calculated based on the active mass of the electrode material. The active mass of PPy, PPy/EG5, PPy/EG10 and PPy/EG15 was 5.02, 4.95, 4.93 and 4.93 mg, respectively. The specific capacitances were calculated according to the equation:
 | (1) |
For the symmetrical two-electrode devices, the mixtures were smeared onto copper foil to form a 125 μm thick membrane and dried at 80 °C for 12 h in a vacuum oven. Then, same mass electrodes were selected and symmetrical devices (CR2032 type) were assembled in an argon glove box with 1 M Et4NBF4-PC as the electrolyte, and sealed by a crimping machine. Finally, the sum mass of the active materials of the two electrodes was calculated, and that of PPy and PPy/EG10 was 3.08 and 3.02 mg, respectively.
For the two-electrode devices, the specific capacitances (Ccell), energy densities (E) and power densities (P) were calculated from the GCD measurements by employing the following equations:
 | (2) |
 | (3) |
 | (4) |
The coulombic efficiency (η) was calculated by using the equation:
 | (5) |
Results and discussion
Structural characterizations
As shown in Fig. 1, PPy/EG nanohybrids were prepared using the following processes. Firstly, Py molecules were intercalated into the interlayer of EG and adsorbed on the surface of the EG nanosheets homogeneously using a vacuum as the driving force. Subsequently, the in situ polymerization of PPy occurred on the EG nanosheets.The EG displayed a hierarchical structure, as shown in Fig. S1a.† In Fig. S1b,† the PPy spheres piled amorphously without a framework. The images in Fig. 2 illustrate that the PPy nanospheres coated both sides of the EG nanosheets. Py monomers were intercalated into the interlayer of EG. The framework was provided by the three dimensional layer structure of the EG nanosheets for the polymerization of PPy. As can be seen from Fig. 2a, c, and e, the PPy coating of the PPy/EG nanohybrids thickened with a decrease in EG content.
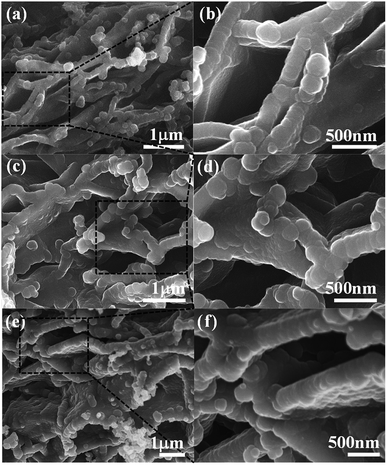 | ||
| Fig. 2 The morphology of the PPy/EG nanohybrids. (a and b) The SEM images of PPy/EG15, (c and d) the SEM images of PPy/EG10 and (e and f) the SEM images of PPy/EG5. | ||
Therefore, the thickness of the PPy coating could be controlled by changing the content of EG. When the content of EG was 5%, the excessive PPy spheres were unordered and accumulated. The thicknesses of PPy/EG15, PPy/EG10 and PPy/EG5 were about 200 nm, 250 nm and 300 nm (Fig. 2b, d and f), respectively. As an electrode material for supercapacitors, the hierarchical structure of the PPy/EG nanohybrids could increase the contact area of PPy effectively. At the same time, the EG nanosheets had a high conductivity, and could be used as a self-supporting current collector to enhance the capacitance of electrode materials.
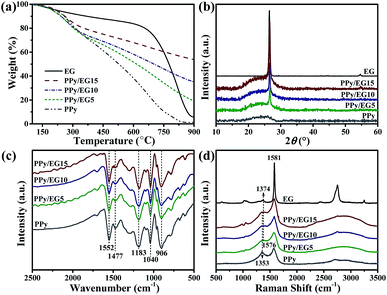
The thermal stability of the PPy/EG nanohybrids was analyzed by TGA. As shown in Fig. 3a, the initial decomposition temperature of EG was 650 °C, and 60% weight retention was observed at 800 °C. The weight loss of the PPy and PPy/EG nanohybrids between 100 °C and 300 °C arose from the recombination of the PPy chains. The main weightless stage was at 300 °C for the thermal degradation of PPy.52 At 800 °C, the weight retention of PPy was 4.9%, PPy/EG5 was 28.5%, PPy/EG10 was 41.8% and PPy/EG15 was 57.9%. The thermal stability increased with the content of EG. The increasing weight retention was due to strong intermolecular forces between PPy and EG.
XRD patterns were measured to investigate the crystalline structure of the nanohybrids. As the XRD patterns presented in Fig. 3b show, EG displayed a sharp diffraction peak at 2θ = 26.7° corresponding to the (002) plane of well-ordered graphite.46,52 PPy showed a broad peak between 17° and 28° ascribed to amorphous PPy.19,34 Overlapping peaks including a broad diffraction peak at 2θ = 17°–28° and a sharp diffraction peak at 2θ = 26.7° were observed in the PPy/EG nanohybrids. The sharp diffraction peak at 2θ = 26.7° increased, which was ascribed to the higher EG content in the nanohybrids. This result showed that π-conjugated bonds existed between the EG nanosheets and PPy chains, and the crystallinity of the PPy/EG nanohybrids was affected by the amorphous PPy coating. The FTIR spectra of the PPy/EG nanohybrids and PPy samples are presented in Fig. 3c. There were five main absorption peaks in the infrared spectrum of the PPy sample. The peak at 1552 cm−1 was the C![[double bond, length as m-dash]](https://www.rsc.org/images/entities/char_e001.gif) C bond telescopic vibration absorption of pyrrole rings.16,35 The peak at 1477 cm−1 was the C–N bond asymmetric telescopic vibration absorption of the pyrrole rings.32,34 The peak at 1183 cm−1 was attributed to the telescopic vibration absorption of C–N bonds.34,46 The deformation vibration peaks at 1040 cm−1 and 906 cm−1 were ascribed to N–H bonds and C–H bonds of the pyrrole rings.21,59 Characteristic absorption peaks were also present for the PPy/EG nanohybrids. Furthermore, the red shift of the characteristic absorption peaks corresponded to the π–π electronic interaction and hydrogen bonds of the EG nanosheets and PPy chains. The PPy/EG nanohybrids had a strong interaction between PPy and EG, which was further validated by FTIR analyses.
C bond telescopic vibration absorption of pyrrole rings.16,35 The peak at 1477 cm−1 was the C–N bond asymmetric telescopic vibration absorption of the pyrrole rings.32,34 The peak at 1183 cm−1 was attributed to the telescopic vibration absorption of C–N bonds.34,46 The deformation vibration peaks at 1040 cm−1 and 906 cm−1 were ascribed to N–H bonds and C–H bonds of the pyrrole rings.21,59 Characteristic absorption peaks were also present for the PPy/EG nanohybrids. Furthermore, the red shift of the characteristic absorption peaks corresponded to the π–π electronic interaction and hydrogen bonds of the EG nanosheets and PPy chains. The PPy/EG nanohybrids had a strong interaction between PPy and EG, which was further validated by FTIR analyses.
Raman spectra were used to further analyze the structural changes of the PPy/EG nanohybrids. As shown in Fig. 3d, the EG sample exhibited three characteristic peaks, at 1374 cm−1 for the D-band, 1581 cm−1 for the G-band and 2754 cm−1 for the 2D-band.19,42 The absorption peaks at 1353 cm−1 and 1576 cm−1 were C–C bond and C![[double bond, length as m-dash]](https://www.rsc.org/images/entities/char_e001.gif) C bond telescopic vibrations of pyrrole rings.34,35 The PPy/EG nanohybrids presented two broad absorption peaks at 1368 cm−1 and 1578 cm−1, which were formed by the overlapping of the PPy and EG absorption peaks. Notably, the absorption peaks at 976 cm−1 and 1050 cm−1 were due to the polaron structure and symmetric C–H in-plane bending vibration, respectively.36,42 The absorption peaks of PPy were enhanced by the interaction between the EG nanosheets and PPy chains. In the Raman spectra of the PPy/EG15 sample, the above characteristic peaks of PPy were obvious. This demonstrated that PPy had grown along the EG nanosheet layers in an orderly manner.
C bond telescopic vibrations of pyrrole rings.34,35 The PPy/EG nanohybrids presented two broad absorption peaks at 1368 cm−1 and 1578 cm−1, which were formed by the overlapping of the PPy and EG absorption peaks. Notably, the absorption peaks at 976 cm−1 and 1050 cm−1 were due to the polaron structure and symmetric C–H in-plane bending vibration, respectively.36,42 The absorption peaks of PPy were enhanced by the interaction between the EG nanosheets and PPy chains. In the Raman spectra of the PPy/EG15 sample, the above characteristic peaks of PPy were obvious. This demonstrated that PPy had grown along the EG nanosheet layers in an orderly manner.
N2 adsorption–desorption isotherms were acquired to analyze the specific surface area and pore size distribution of the composites. The pore characteristics of the EG, PPy, PPy/EG15, PPy/EG10 and PPy/EG5 samples are shown in Fig. S2 and Table S1.† The SBET of the EG and PPy samples was 26.37 and 15.82 m2 g−1, respectively. The PPy/EG nanohybrids had a larger SBET than the PPy sample. The SBET of PPy/EG15, PPy/EG10 and PPy/EG5 was 30.97, 28.73 and 22.45 m2 g−1, respectively. As observed in the SEM images, the PPy nanospheres were intercalated into the interlayer of EG, and the SBET of the PPy/EG nanohybrids decreased. The larger SBET of the PPy/EG nanohybrids provided more channels for the diffusion and infiltration of electrolyte ions, which could accelerate the transfer of electrolyte ions.
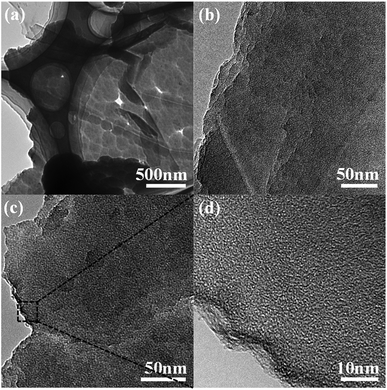
The morphology and structure of PPy/EG10 were analyzed by TEM. The image in Fig. 4a clearly shows the folds of the EG nanosheets. PPy nanospheres coated the surface of the EG nanosheets in an orderly manner and their diameter was about 150–200 nm. The images in Fig. 4b and c indicate that the thickness of the EG nanosheets was homogeneous. PPy nanospheres accumulated at the edge of the EG nanosheets. The edge was seen clearly in the image in Fig. 4d. The conclusion from TEM was consistent with the SEM measurement results.
Chemical status and element composition of the PPy and PPy/EG10 samples were further analyzed by XPS. The XPS full-scan spectra are shown in Fig. S3.† The binding energies of PPy at 284.6, 399.6 and 531.0 eV correspond to C1s, N1s and O1s peaks, whereas the binding energy of PPy/EG10 migrated to higher levels. The peaks of C1s, N1s and O1s were situated at 285.6, 400.3 and 531.6 eV, respectively, which was attributed to the π–π interaction between PPy and EG.24 The content of C, N and O elements is shown in Table S2.† With the EG content increasing, the C element content increased from 71.89% to 76.90%, the O element content decreased from 12.49% to 11.18% and the N element content decreased from 15.62% to 11.92%. This is because the EG in the PPy/EG nanohybrids provided a lot of carbon.
Regarding the high-resolution XPS N1s spectrum in Fig. 5a, the N1s peak of the PPy sample was divided into two characteristic peaks at 400.2 and 401.2 eV, which corresponded to the neutral secondary amine structure (–NH–) and positively charged nitrogen (–N+–).24,49 The two N1s fitting peaks of the PPy/EG10 sample in Fig. 5b are at 400.4 and 401.2 eV. The peak of the neutral secondary amine structure (–NH–) migrated to a higher binding-energy level. This was attributed to the strong π–π interaction between EG and PPy.25 As shown in Fig. 5c, the C1s peak of the PPy sample could be fitted into three peaks. The peaks at 284.5, 285.5 and 287.6 eV were attributed to C–C bonds (sp2-hybridized carbons), C–N bonds and C![[double bond, length as m-dash]](https://www.rsc.org/images/entities/char_e001.gif) O/C–O bonds, respectively.44,63 However, the C1s peak appeared at 284.5 eV (sp2-hybridized carbons) for the PPy/EG10 sample in Fig. 5d with a higher intensity, because the carbon atoms of EG used sp2 hybridization.
O/C–O bonds, respectively.44,63 However, the C1s peak appeared at 284.5 eV (sp2-hybridized carbons) for the PPy/EG10 sample in Fig. 5d with a higher intensity, because the carbon atoms of EG used sp2 hybridization.
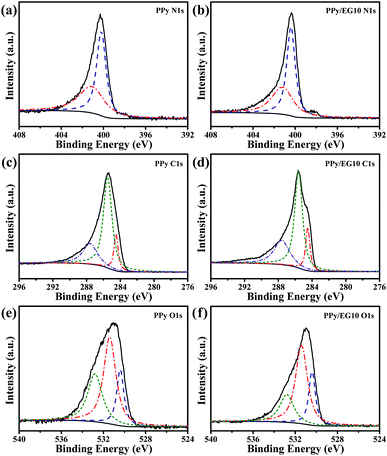 | ||
| Fig. 5 The high resolution XPS spectra of the PPy and PPy/EG10 samples. (a and b) The core level N1s spectra; (c and d) the core level C1s spectra; (e and f) the core level O1s spectra. | ||
The O1s spectra of the PPy and PPy/EG10 samples are shown in Fig. 5e and f. They could be fitted into three peaks. The peaks of the PPy sample at 530.4, 531.4 and 532.8 eV belonged to C![[double bond, length as m-dash]](https://www.rsc.org/images/entities/char_e001.gif) O, C–O–C and C–O, respectively.63,64 The O1s peak area at 531.4 eV of the PPy/EG10 sample (Fig. 5f) decreased, which was due to the functional groups of EG increasing the intensity of the C
O, C–O–C and C–O, respectively.63,64 The O1s peak area at 531.4 eV of the PPy/EG10 sample (Fig. 5f) decreased, which was due to the functional groups of EG increasing the intensity of the C![[double bond, length as m-dash]](https://www.rsc.org/images/entities/char_e001.gif) O bonds and C–O bonds.
O bonds and C–O bonds.
Formation mechanism
Many researchers have studied the formation mechanism of PPy, including chemical polymerization,65 electrochemical polymerization66,67 and UV-induced radical polymerization.68 In the process of chemical polymerization, neutral PPy is affected by the oxidant and pH value. For PPy in the presence of an oxidant and in an acidic/alkaline media, over-oxidation makes the PPy ionized and rearranges the delocalized electrons. PPy transforms into polarons. When the pH increases, electrons recombine with positively charged electron holes. Polarons are transformed into neutral PPy and the doping level decreases. In addition, it was found that the oxidation rate of the Py monomer was faster than the polymerization reaction.65The synthesis process of the PPy/EG nanohybrids was mainly divided into two steps. The first step was intercalating Py monomers into the interlayers of EG by the vacuum-assisted intercalation method. Because of π–π stacking, Py monomers dispersed and adsorbed on the surface of the EG nanosheets.69 In the second step, the in situ polymerization of the Py monomers along the EG framework occurred in 1 M HCl solution, with APS as an oxidant. A homogeneous coating was formed on the surface of the EG nanosheets.
According to the structural characterization and analysis of the PPy/EG nanohybrids, the formation mechanism of the Py monomers polymerizing along the EG framework was inferred as follows. When Py monomers were intercalated into the interlayers of EG, the Py monomers and EG nanosheets interacted with each other by π–π stacking. Subsequently, the oxidant was added into the prepolymer suspension solution, and the Py monomers polymerized and delocalized electrons were rearranged. The ionized PPy was positively charged in acidic media, and electrostatically assembled with the negatively charged oxygen functional groups of the EG nanosheets. These functional groups acted as heterogeneous nucleation sites, which enabled the in situ polymerization of PPy attached to the surfaces of the EG nanosheets.70 Also, homogeneous nucleation sites hardly formed and the oxidation rate of Py monomers was faster than the polymerization reaction. Therefore, the Py monomers preferred covering the surface of EG to agglomeration. So, PPy chains polymerized along the EG framework preferentially and formed a coating on the surface of the EG nanosheets. The PPy chains grew along the vertical direction of the EG nanosheets homogeneously. The conductivity of PPy cab be affected by a dopant. Because the in situ polymerization occurred in HCl solution, the prepared PPy/EG nanohybrids were doped with HCl. As an electrode material for a supercapacitor, the p-type dopant HCl in the polymer molecular chains could promote the redox reaction of doping and dedoping, which generates high pseudo-capacitance.
Electrochemical performance
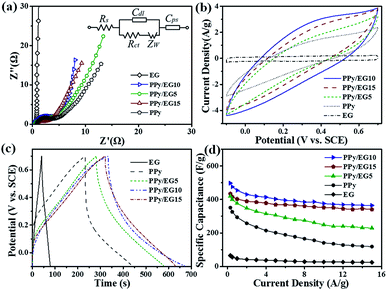
The electrochemical performances of EG, PPy and the PPy/EG nanohybrids were tested using three-electrode systems in 1 M H2SO4 and 1 M KCl electrolytes, respectively. Fig. 6a shows the Nyquist plots of the EG, PPy and PPy/EG electrodes in 1 M H2SO4. The Nyquist plots exhibited a typical semicircle in the high-frequency region and a straight line in the low-frequency region. In the high-frequency region, the real-axis intercept is the equivalent series resistance (ESR), and the radius of the semicircle impedance loop can be associated with the surface properties of the electrode and corresponds to the faradaic charge transfer resistance in the electrode material.71 As shown in Fig. 6a, PPy/EG10 has the lowest ESR, owing to lower contact resistance and good intrinsic electronic properties.72 The fitting of the equivalent circuit model by the coupled nonlinear Schrödinger equation (CNLS) method is shown in the inset of Fig. 6a and in Table S3.† The capacitor circuit consists of Rs, Rct, Zw, Cdl, and Cps.62 In the model, Rs is the sum of the electrolyte resistance, the intrinsic resistance of the active electrode material, and the contact resistance at the interface of the active material and the current collector. Rct is the charge-transfer resistance across the electrode-solution interface. Zw is the Warburg resistance, which reflects the characteristics of ion diffusion into the active materials. Cdl represents the double-layer capacitance at the solution–nanohybrid interface, and Cps represents the pseudo-capacitance from the redox reaction of PPy. As listed in Table S3,† the PPy/EG10 electrode exhibited an Rs value of 0.3699 Ω cm−2, which was much lower than that for EG (0.5516 Ω cm−2), PPy/EG5 (0.5365 Ω cm−2), PPy/EG15 (0.8563 Ω cm−2), and PPy (0.8665 Ω cm−2). It was indicated that PPy/EG10, with good electrical conductivity, could lower the charge-transfer resistance, thus improving the rate capacity and the power density of a supercapacitor. The PPy/EG10 electrode exhibited Cdl and Cps values of 35.18 μF cm−2 and 2839 mF cm−2, respectively, which were much higher than those of PPy/EG5 and PPy/EG15. It was implied that PPy/EG10 had high capacitance combining double-layer capacitance and pseudo-capacitance.73,74 The EIS results demonstrated that PPy/EG10 was one of the best electrode materials for supercapacitors due to the synergistic effect of the unique 3D structure, good electrical conductivity and high usage pseudo-capacitance of PPy.The CV curves of the EG, PPy and PPy/EG electrodes at 10 mV s−1 are shown in Fig. 6b. The EG electrode exhibited a quasi-rectangular feature, and the response current was low, which indicated that the EG electrode had electric double-layer capacitance characteristics with low specific capacitance. The wide redox current on the CV curve of the PPy electrode at 0.4 V was due to the redox peak produced by the doping/dedoping of PPy during the charging and discharging processes, which indicated that the PPy electrode exhibited pseudo-capacitance characteristics. Compared with the PPy electrode, the PPy/EG electrodes had an obvious redox current with larger areas on the CV curve and higher specific capacitances, which was mainly derived from the pseudo-capacitance generated by PPy. The redox peaks of the PPy/EG electrodes gradually shifted with increasing EG content. The 3D structure of the PPy/EG nanohybrids increased the contact area of electrodes and electrolyte, which enhanced the pseudo-capacitance. EG, as the skeleton of the PPy/EG nanohybrids, played a role in structure support and electron transport. The CV curves of the PPy/EG10 electrode at different scanning speeds are shown in Fig. S4a.† In the CV curve, the response current density increased with the scanning rate and the current density was linear with the scanning rate. This indicated that the current, which was generated by redox reaction of the PPy/EG10 electrode, had reversible stability and rapid response.43,52
The GCD curves of the EG, PPy and PPy/EG electrodes in 1 M H2SO4 electrolyte with a current density of 1.0 A g−1 are shown in Fig. 6c. The GCD curve of the PPy electrode presented the characteristics of a twisty triangle, which indicated the pseudo-capacitance characteristic of the PPy electrode.35,52 The GCD curve of the PPy/EG electrodes was also characterized by obvious nonlinear pseudo-capacitance. According to the GCD curves, the specific capacitances of the PPy/EG nanohybrids were calculated at 1.0 A g−1 current density. The specific capacitances of the PPy/EG5, PPy/EG10 and PPy/EG15 electrodes were 376.4, 454.3 and 402.5 F g−1 (Table S5†), respectively. It is worth noting that the PPy/EG samples showed a higher specific capacitance than some reported carbon-based/PPy composite electrodes in acid electrolyte (Table S6†). The specific capacitances of the PPy and EG electrodes were 293.6 and 46.2 F g−1. With increasing EG content in the PPy/EG nanohybrids, the specific capacitance increased at first and then decreased and reached a maximum value with 10% EG content. This was due to the EG content affecting on the structure of the PPy/EG nanohybrids. When the EG content was low (as in PPy/EG5), the PPy coating on the EG nanosheets was thick. The specific capacitance decreased due to the reduced contact area between the EG and electrolyte. When the EG content was high (as in PPy/EG15), the PPy coating was thin with less pseudo-capacitance. Thus, a suitable amount of EG served as a skeleton for PPy growth, which could give the nanohybrids a larger specific surface area and increase the pseudo-capacitance of PPy maximally.
The rate performance of the EG, PPy and PPy/EG electrodes in 1 M H2SO4 is shown in Fig. 6d with the current density range of 0.3–15.0 A g−1. The PPy/EG electrodes showed excellent rate performance with an acid electrolyte. The retention rate of the PPy/EG10 electrode specific capacitance at 15.0 A g−1 reached 75.9% compared with the specific capacitance at 0.3 A g−1, which was higher than the retention rate of the PPy electrode (Table S5†). On comparing the PPy/EG electrodes with different EG contents, the retention rate of the PPy/EG10 electrode specific capacitance increased with increasing EG content. The 3D skeleton and excellent conductivity of the EG in the PPy/EG nanohybrids accelerated the transfer of electrolyte ions and electrons, and improved the rate performance of charging and discharging at high current density. The GCD test results were consistent with the EIS and CV test results.
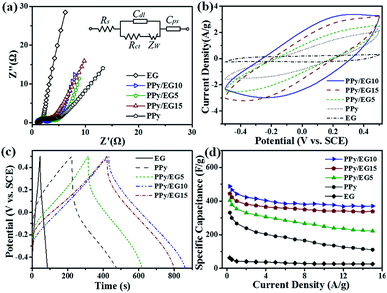
In addition, the nanohybrids were evaluated in a three-electrode system with 1 M KCl electrolyte as shown in Fig. 7. Fig. 7a shows the Nyquist plots of the EG, PPy and PPy/EG electrodes in 1 M KCl electrolyte and the equivalent circuit for fitting. The fitting results are listed in Table S4.† The PPy/EG10 electrode showed the best ion diffusion behavior on the surface of the electrode, which is in accordance with the above electrochemical tests in 1 M H2SO4 electrolyte. As shown in Fig. 7b, a pair of redox peaks also appeared on the CV curve of the PPy/EG electrodes in 1 M KCl electrolyte. The peaks were located at 0.3 V, which indicated the PPy/EG electrode exhibited good capacitance characteristics in neutral electrolyte. The reduced electrolyte ion diffusion distance was attributed to the 3D structure of PPy/EG nanohybrids. The excellent conductivity of EG accelerated the electron transfer. With the synergistic effect of PPy and EG, the PPy/EG nanohybrids exhibited preferable capacitance characteristics. The GCD curves of the PPy and PPy/EG electrodes (Fig. 7c) presented the characteristics of a nonlinear symmetric triangle, indicating the pseudo-capacitance of the PPy and PPy/EG electrodes. When the current density was 1.0 A g−1, the specific capacitances of PPy, PPy/EG5, PPy/EG10 and PPy/EG15 were 266.9, 353.6, 442.7, and 399.8 F g−1, respectively (Table S5†). The specific capacitance was not only higher than some reported carbon material/PPy composite electrodes in neutral electrolyte, but also higher than some reported electrodes which were tested in alkaline electrolyte (Table S6†). The test results of the electrodes in 1 M KCl were slightly lower than those of the electrodes in 1 M H2SO4. The H+ ionized from H2SO4 electrolyte was the dopant of PPy, which improved the specific capacitance of the electrode during charging and discharging. The PPy/EG electrodes showed perfect rate performance under neutral electrolytes (Fig. 7d). The retention rate of the PPy/EG10 electrode specific capacitance at 15.0 A g−1 reached 73.3% compared with the specific capacitance at 0.3 A g−1 (Table S5†). The PPy/EG10 electrode presented outstanding capacitive characteristics in both acidic and neutral electrolytes, which was close to the state of an ideal pseudo-capacitance electrode material, and it could be used in electrochemical capacitors with higher specific capacitance.
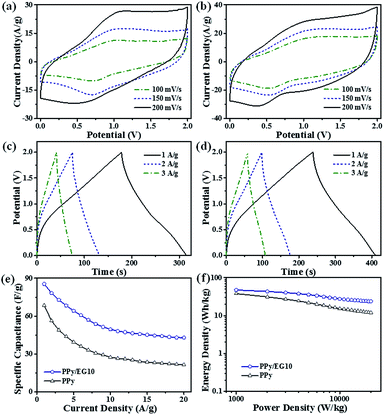
The actual device performance of a two-electrode supercapacitor is an important evaluation parameter in practical applications. The PPy and PPy/EG10 nanohybrids were further evaluated in a fully assembled two-electrode device with 1 M Et4NBF4-PC electrolyte. As shown in Fig. 8a and b, the CV curves of the PPy and PPy/EG10 devices exhibited a wide redox peak, which showed the pseudo-capacitance characteristics. The PPy/EG device had a larger CV curve area and a shifted position of the redox peaks with the introduction of EG. The specific capacitances of the devices were calculated from the GCD curves and are presented in Fig. 8c–e. The total capacitances of the PPy and PPy/EG10 devices were 68.5 F g−1 and 85.6 F g−1 at 1.0 A g−1, respectively. The specific capacitances of the electrode materials were calculated to be about 274.0 F g−1 and 342.4 F g−1, respectively. Fig. 8f shows the corresponding Ragone plots. The supercapacitors using the PPy/EG10 exhibited larger energy density values compared to those of PPy. The energy density of the PPy/EG10 devices declined more slowly than with PPy, with the power density increasing at a current density less than 10.0 A g−1. The PPy/EG10 device delivered an extremely high energy density of about 47.5 W h kg−1 at a power density of 1 kW kg−1, and 23.9 W h kg−1 was retained at a power density as high as 20 kW kg−1, which was much higher than for the PPy device. The remarkable power performance was much better than that of the recently reported carbon-based/PPy supercapacitors, as shown in Table S7.†
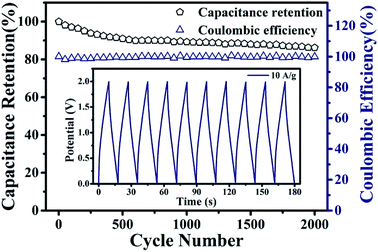
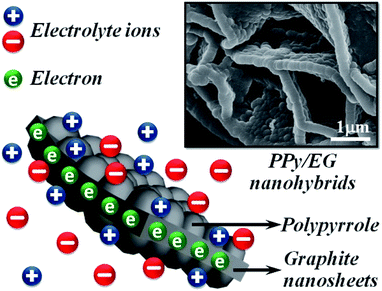
The cycling stability of the PPy/EG10 device was measured by charge–discharge cycling at 10.0 A g−1. The test results are shown in Fig. 9, and the inset is the GCD curves of the last 10 cycles. It could be observed that 86.1% of the specific capacitance of the PPy/EG10 device was retained after 2000 charge–discharge cycles, displaying greater cycling stability. The coulombic efficiency of the PPy/EG10 device still remained above 99% after 2000 cycles. In addition, the stable GCD curves for the last 10 cycles indicated that repetitive GCD tests wouldn't induce observable changes. The outstanding cycling stability of the PPy/EG10 device could be attributed to the self-supporting structure of EG, which enhanced the mechanical strength of the PPy/EG nanohybrids. During the charging and discharging processes, the excellent mechanical strength reduced the fracture of the PPy chains in the doping and dedoping processes. The PPy/EG10 electrode showed an outstanding energy storage performance, which could be attributed to its unique characteristics as follows (Fig. 10): firstly, the 3D hierarchical structure of the PPy/EG nanohybrids could facilitate electrolyte ion transport over the whole surface and improved the pseudo-capacitance. Secondly, the inner self-supporting skeleton of the EG nanosheets would be beneficial to the electron transport for achieving high-rate performance and good stability. The synergistic effect of the above factors made the PPy/EG10 nanohybrid an ideal candidate electrode material for high performance energy storage devices.
Conclusions
In conclusion, a high performance PPy/EG nanohybrid electrode material for supercapacitors was prepared by a vacuum-assisted intercalation in situ oxidation polymerization method with low-cost raw materials. The PPy/EG nanohybrids exhibited excellent specific capacitance and rate capability in both acidic and neutral electrolytes. The obtained PPy/EG10 device showed a high energy density, power density, and long-term electrochemical stability. The 3D structure of the PPy/EG nanohybrids was conducive to the infiltration of electrolyte and the diffusion of ions, which improved the pseudo-capacitance of PPy. The EG nanosheets acted as a current collector in the processes of charging and discharging, which could accelerate the electron transport. The EG in the nanohybrids served as a self-supporting skeleton, which prevented the volumetric swelling and shrinking of the nanohybrids and enhanced the cycling stability. The method described in this work provided the synthesis of a novel nanohybrid, which was designed to combine a conductive polymer with the 3D structure EG as an energy storage material for supercapacitors.Conflicts of interest
There are no conflicts to declare.Acknowledgements
We gratefully acknowledge the support of this research by the Natural Science Foundation of Heilongjiang Province (LH2019B030), and the Central Government Directs Local Science and Technology Development Projects (ZY18C06).References
- D. P. Dubal, N. R. Chodankar, D. H. Kim and P. G. Romero, Chem. Soc. Rev., 2018, 47, 2065–2129 RSC.
- F. Wang, X. Wu, X. Yuan, Z. Liu, Y. Zhang, L. Fu, Y. Zhu, Q. Zhou, Y. Wu and W. Huang, Chem. Soc. Rev., 2017, 46, 6816–6854 RSC.
- A. Borenstein, O. Hanna, R. Attias, S. Luski, T. Brousse and D. Aurbach, J. Mater. Chem. A, 2017, 5, 12653–12672 RSC.
- I. Shown, A. Ganguly, L. C. Chen and K. H. Chen, Energy Sci. Eng., 2015, 3, 2–26 CrossRef CAS.
- Y. Zhang, Z. Bakenov, T. Tan and J. Huang, Nanomaterials, 2018, 8, 606 CrossRef.
- L. Zhu, Y. Shen, M. Sun, J. Qian, Y. Cao, X. Ai and H. Yang, Chem. Commun., 2013, 49, 11370–11372 RSC.
- T. Yoon, J. Jun, D. Y. Kim, S. Pourasad, T. J. Shin, S. U. Yu, W. Na, J. Jang and K. S. Kim, J. Mater. Chem. A, 2018, 6, 2257–2263 RSC.
- A. U. Rehman, M. Ikram, K. Kan, Y. Zhao, W. Zhang, J. Zhang, Y. Liu, Y. Wang, L. Du and K. Shi, Sens. Actuators, B, 2018, 274, 285–295 CrossRef CAS.
- Y. Ye, W. Yan, Y. Liu, S. He, X. Cao, X. Xu, H. Zheng and S. Gunasekaran, Anal. Chim. Acta, 2019, 1074, 80–88 CrossRef CAS PubMed.
- H. Noreen, J. Iqbal, A. Arshad, R. Faryal, A. Rahman and R. Khattak, J. Solid State Chem., 2019, 275, 141–148 CrossRef CAS.
- S. Ye and G. Li, Front. Chem. Sci. Eng., 2018, 12, 473–480 CrossRef CAS.
- A. C. R. Perez, J. Q. Bermejo, J. M. Sieben, E. Morallon and D. C. Amoros, Electrocatalysis, 2018, 9, 697–705 CrossRef.
- S. Ye and J. Feng, ACS Appl. Mater. Interfaces, 2014, 6, 9671–9679 CrossRef CAS PubMed.
- X. Zuo, Y. Zhang, L. Si, B. Zhou, B. Zhao, L. Zhu and X. Jiang, J. Alloys Compd., 2016, 688, 140–148 CrossRef CAS.
- H. Feng, B. Wang, L. Tan, N. Chen, N. Wang and B. Chen, J. Power Sources, 2014, 246, 621–628 CrossRef CAS.
- A. Singh and A. Chandra, J. Appl. Electrochem., 2013, 43, 773–782 CrossRef CAS.
- H. Kashani, L. Chen, Y. Ito, J. Han, A. Hirata and M. Chen, Nano Energy, 2016, 19, 391–400 CrossRef CAS.
- J. Yang, W. Weng, Y. Liang, Y. Zhang, L. Yang, X. Luo, Q. Liu and M. Zhu, Electrochim. Acta, 2019, 304, 378–385 CrossRef CAS.
- X. Jian, J. Li, H. Yang, L. Cao, E. Zhang and Z. Liang, Carbon, 2017, 114, 533–543 CrossRef CAS.
- T. Liu, L. Finn, M. Yu, H. Wang, T. Zhai, X. Lu, Y. Tong and Y. Li, Nano Lett., 2017, 14, 2522–2527 CrossRef PubMed.
- N. Chen, J. Zhou, G. Zhu, Q. Kang, H. Ji, Y. Zhang, X. Wang, L. Peng, X. Guo, C. Lu, J. Chen, X. Feng and W. Hou, Nanoscale, 2018, 10, 3709–3719 RSC.
- X. Yang, Z. Lin, J. Zheng, Y. Huang, B. Chen, Y. Mai and X. Feng, Nanoscale, 2016, 8, 8650–8657 RSC.
- H. Zhang, J. Wang, Q. Shan, Z. Wang and S. Wang, Electrochim. Acta, 2013, 90, 535–541 CrossRef CAS.
- J. W. Lee, H. I. Lee and S. J. Park, Electrochim. Acta, 2018, 263, 447–453 CrossRef CAS.
- L. Msantino, S. Acharya and J. M. D'Arcy, J. Mater. Chem. A, 2017, 5, 11772–11780 RSC.
- J. Cherusseri and K. K. Kar, Phys. Chem. Chem. Phys., 2016, 18, 8587–8597 RSC.
- C. Niu, B. Zou, Y. Wang, L. Chen, H. Zheng and S. Zhou, Chem. Commun., 2015, 51, 5009–5012 RSC.
- X. Wu and M. Lian, J. Power Sources, 2017, 362, 184–191 CrossRef CAS.
- X. Zhang, J. Wang, J. Liu, J. Wu, H. Chen and H. Bi, Carbon, 2017, 115, 134–146 CrossRef CAS.
- J. Sun, Y. Huang, C. Fu, Z. Wang, Y. Huang, M. Zhu, C. Zhi and H. Hu, Nano Energy, 2016, 27, 230–237 CrossRef CAS.
- Y. Zhou, X. Hu, Y. Shang, C. Hua, P. Song, X. Li, Y. Zhang and A. Cao, RSC Adv., 2016, 6, 62062–62070 RSC.
- B. Ding, X. Lu, C. Yuan, S. Yang, Y. Han, X. Zhang and Q. Che, Electrochim. Acta, 2012, 62, 132–139 CrossRef CAS.
- J. Cherusseri and K. K. Kar, J. Mater. Chem. A, 2016, 4, 9910–9922 RSC.
- K. F. Babu, S. P. S. Subramanian and M. A. Kulandainathan, Carbohydr. Polym., 2013, 94, 487–495 CrossRef.
- C. Yang, J. Shen, C. Wang, H. Fei, H. Bao and G. Wang, J. Mater. Chem. A, 2014, 2, 1458–1464 RSC.
- L. Chen, L. Chen, Q. Ai, D. Li, P. Si, J. Feng, L. Zhang, Y. Li, J. Lou and L. Ci, Chem. Eng. J., 2018, 334, 184–190 CrossRef CAS.
- X. Wu, L. Meng, Q. Wang, W. Zhang and Y. Wang, Mater. Chem. Phys., 2018, 206, 259–269 CrossRef CAS.
- X. Jin, H. Wang, Y. Liu, H. Wang, W. Wang and T. Lin, Appl. Surf. Sci., 2019, 470, 783–791 CrossRef CAS.
- Y. Li, G. Louarn, P. H. Aubert, V. A. Rizzo, L. Galmiche, P. Audebert and F. Miomandre, Carbon, 2016, 105, 510–520 CrossRef CAS.
- R. Sun, H. Chen, Q. Li, Q. Song and X. Zhang, Nanoscale, 2014, 6, 12912–12920 RSC.
- Y. Ge, C. Wang, K. Shu, C. Zhao, X. Jia, S. Gambhir and G. G. Wallace, RSC Adv., 2015, 5, 102643–102651 RSC.
- J. K. Gan, Y. S. Lim, A. Pandikumar, N. M. Huang and H. N. Lim, RSC Adv., 2015, 5, 12692–12699 RSC.
- H. Zhou, T. Ni, X. Qing, X. Yue, G. Li and Y. Lu, RSC Adv., 2014, 4, 4134–4139 RSC.
- J. Zhang, P. Chen, B. H. L. Oh and M. B. Chan-Park, Nanoscale, 2013, 5, 9860–9866 RSC.
- M. Barakzehi, M. Montazer, F. Sharif, T. Norby and A. Chatzitakis, Electrochim. Acta, 2019, 305, 187–196 CrossRef CAS.
- Y. Zou, Q. Wang, C. Xiang, Z. She, H. Chu, S. Qiu, F. Xu, S. Liu, C. Tang and L. Sun, Electrochim. Acta, 2016, 188, 126–134 CrossRef CAS.
- K. Pal, V. Panwar, S. Bag, J. Manuel, J. H. Ahn and J. K. Kim, RSC Adv., 2015, 5, 3005–3010 RSC.
- J. Zhu and Y. Xu, Electrochim. Acta, 2018, 265, 47–55 CrossRef CAS.
- G. Han, Y. Liu, E. Kan, J. Tang, L. Zhang, H. Wang and W. Tang, RSC Adv., 2014, 4, 9898–9904 RSC.
- Z. Zhang, G. Chen, H. Wang and W. Zhai, J. Mater. Chem. C, 2015, 3, 1649–1654 RSC.
- J. Cao, Y. Wang, J. Chen, X. Li, F. C. Walsh, J. H. Ouyang, D. Jia and Y. Zhou, J. Mater. Chem. A, 2015, 3, 14445–14457 RSC.
- X. Fan, Z. Yang and N. He, RSC Adv., 2015, 5, 15096–15102 RSC.
- S. Chabi, C. Peng, Z. Yang, Y. Xia and Y. Zhu, RSC Adv., 2015, 5, 3999–4008 RSC.
- C. Wan, Y. Jiao and J. Li, J. Mater. Chem. A, 2017, 5, 3819–3831 RSC.
- A. D. Adhikari, R. Oraon, S. K. Tiwari, J. H. Lee and G. C. Nayak, RSC Adv., 2015, 5, 27347–27355 RSC.
- P. Tammela, Z. Wang, S. Frykstrand, P. Zhang, I. Sintorn, L. Nyholm and M. Strømme, RSC Adv., 2015, 5, 16405–16413 RSC.
- H. Zhuo, Y. Hu, Z. Chen and L. Zhong, Carbohydr. Polym., 2019, 215, 322–329 CrossRef CAS PubMed.
- Y. Chen, S. Lyu, S. Han, Z. Chen, W. Wang and S. Wang, RSC Adv., 2018, 8, 39918–39928 RSC.
- J. Cherusseri and K. K. Kar, RSC Adv., 2016, 6, 60454–60466 RSC.
- F. Barzegar, A. Bello, D. Momodu, M. J. Madito, J. Dangbegnon and N. Manyala, J. Power Sources, 2016, 309, 245–253 CrossRef CAS.
- K. Kan, L. Wang, P. Yu, B. Jiang, K. Shi and H. Fu, Nanoscale, 2016, 8, 10166–10176 RSC.
- K. Kan, L. Wang, P. Yu, W. Zhou, R. Wang, Y. Lin, K. Shi and H. Fu, ChemPlusChem, 2016, 81, 242–250 CrossRef CAS.
- H. L. K. S. Mosch, S. Hoppener, R. M. Paulus, B. Schroter, U. S. Schubert and A. Ignaszak, Phys. Chem. Chem. Phys., 2015, 17, 13323–13332 RSC.
- G. Panomsuwan, S. Chiba, Y. Kaneko, N. Saito and T. Ishizaki, J. Mater. Chem. A, 2014, 2, 18677–18686 RSC.
- K. Leonavicius, A. Ramanaviciene and A. Ramanavicius, Langmuir, 2011, 27, 10970–10976 CrossRef CAS PubMed.
- D. Plausinaitis, V. Ratautaite, L. Mikoliunaite, L. Sinkevicius, A. Ramanaviciene and A. Ramanavicius, Langmuir, 2015, 31, 3186–3193 CrossRef CAS PubMed.
- D. Plausinaitis, L. Sinkevicius, L. Mikoliunaite, V. Plausinaitiene, A. Ramanaviciene and A. Ramanavicius, Phys. Chem. Chem. Phys., 2017, 19, 1029–1038 RSC.
- A. Ramanavicius, V. Karabanovas, A. Ramanaviciene and R. Rotomskis, J. Nanosci. Nanotechnol., 2009, 9, 1909–1915 CrossRef CAS PubMed.
- S. Yang, C. Shen, Y. Liang, H. Tong, W. He, X. Shi, X. Zhang and H. Gao, Nanoscale, 2011, 3, 3277–3284 RSC.
- J. Xu, K. Wang, S. Zu, B. Han and Z. Wei, ACS Nano, 2010, 4, 5019–5026 CrossRef CAS PubMed.
- L. Sun, C. Tian, Y. Fu, Y. Yang, J. Yin, L. Wang and H. Fu, Chem.–Eur. J., 2014, 20, 564–574 CrossRef CAS PubMed.
- Y. Bai, R. Liu, E. Li, X. Li, Y. Liu and G. Yuan, J. Alloys Compd., 2019, 777, 524–530 CrossRef CAS.
- A. Valiuniene, A. I. Rekertaite, A. Ramanaviciene, L. Mikoliunaite and A. Ramanavicius, Colloids Surf., A, 2017, 532, 165–171 CrossRef CAS.
- D. P. Dubal, S. H. Lee, J. G. Kim, W. B. Kim and C. D. Lokhande, J. Mater. Chem., 2012, 22, 3044–3052 RSC.
Footnote |
| † Electronic supplementary information (ESI) available. See DOI: 10.1039/c9ra04205a |
| This journal is © The Royal Society of Chemistry 2019 |


