DOI:
10.1039/C9RA01505A
(Paper)
RSC Adv., 2019,
9, 23119-23128
Extraction of DNA from complex biological sample matrices using guanidinium ionic liquid modified magnetic nanocomposites†
Received
27th February 2019
, Accepted 29th June 2019
First published on 26th July 2019
Abstract
A series of guanidinium ionic liquid modified magnetic chitosan/graphene oxide (GIL-MCGO) nanocomposites have been prepared for DNA extraction via magnetic solid-phase extraction technology. These nanocomposites are of only 20 nanometers in diameter. Single stranded DNA or DNA sodium salts that were absorbed by GIL-MCGO could be quickly collected by an external magnet and extracted. The DNA extraction efficiency of 11 GIL-MCGO nanocomposites was evaluated using NanoDrop. Factors that could impact the DNA extraction process, such as pH, temperature, extraction time, and ionic strength were systematically investigated via single-factor experimental analysis. Under the optimum extraction conditions, a maximum DNA extraction capacity of 233.0 ± 0.4 mg g−1 of GIL-MCGO nanocomposite was achieved. The solid phase extraction method based on GIL-MCGO nanocomposites has been demonstrated with the extraction of DNA from a series of complex sample matrices, including single stranded DNA samples, salmon sperm DNA sodium salt, human whole blood and E. coli cell lysate. The DNA extracted by using the GIL-MCGO nanocomposites are well suitable for PCR amplifications. In addition, an initial study on the interaction between GIL-MCGO and DNA was conducted: the preference of GIL-MCGO on DNA absorption with varying base composition was tested. Only a slight loss in the DNA extraction efficiency of GIL-MCGO was observed after four extraction–desorption cycles, proving excellent regeneration performance and recyclability of the GIL-MCGO nanocomposites in the DNA extraction process.
Introduction
Highly accurate and reliable DNA analysis is the foundation of various biological applications.1–3 However, separating DNA with high purity from the cell matrix or from biological samples in a complex environment is proven to be extremely complicated and challenging.4,5 Proteins, metal ions, etc. are all common impurities in DNA involved downstream applications.6,7 Traditional DNA purification technology is realized by using phenol–chloroform liquid–liquid extraction system.8 The liquid–liquid extraction method suffers from the necessity of using great amounts of solvents. More recently, solid-phase extraction (SPE) technology has been developed and several DNA extraction kits are commercialized.9 These commercial SPE kits provide reduction on solvent usage and analysis time, however, some of the products require multiple centrifugation and transfer processes, which will easily result in extra time and human power consumption, and loss of DNA content;10 some other products tend to utilize very expensive magnetic beads, with poor reusability.11
Magnetic solid-phase extraction, originated from SPE technology, has been applied in DNA purification due to its advantage of easy separation procedure.12–14 Magnetic adsorbent plays a vital role in the magnetic SPE procedure. It requires a magnetic core to facilitate separation and a coexisting absorbing component to extract DNA in the purification process.15
Implementation of magnetic core avoids the necessity of adsorbent being packed into the SPE cartridges and the centrifuge steps in traditional SPE can be substituted by an external magnetic field to achieve solid–liquid separation.16 In preparing the magnetic core of the absorbents, chitosan, a basic polysaccharide polymer with bifunctional groups, has been reported as one of the surface modification materials.17–19 In the presence of glutaraldehyde, Fe3O4 can be modified by chitosan to form magnetic chitosan (MC) particles. These particles can be easily being functionalized, activated and coupled because of a multitude of chemically active amino and hydroxyl groups in its molecular structure.20–22
Recently, some researchers have explored the potential of chitosan-graphene oxide (GO) composite as biological adsorbents, where carboxyl group of GO chemically reacts with amine group of chitosan and consequently forming chemical bond between GO and chitosan.23,24 GO contains a wide range of oxygen functional groups both on the basal planes and at the edges of GO sheets, such as –COOH and –OH.23 These functional groups are expected to promote interfacial interactions between GO and adsorbate, which are essential for efficient extraction of macromolecules.25 However, the chitosan-GO composites are easy to aggregate. Therefore, it is important to develop a new material to overcome the aggregation and efficiently extract biomolecules. In the past years, ionic liquids (ILs) have been reported several times to be immobilized onto GO surface as adsorbents in SPE to prevent the aggregation of GO.26–28 ILs are widely recognized as solvents and dispersants that can be designed to be environmentally benign.29–31 Guanidinium ionic liquid (GIL), as a member of ILs family, has good biological compatibility and thermal/chemical stability, and can be easily prepared.32 In our previous work, we synthesized several guanidinium ILs and explored their application in protein purification and ingredient extraction from traditional Chinese medicine.33–35 Moreover, guanidinium ILs has good designability and compatibility with other components to form composites due to adjustability of its three nitrogen-atoms. Although the liquidity of ILs is lost when they are immobilized onto GO surface, other properties such as polarity and low volatility are maintained.36,37 Based on the properties of IL as well as the strong electrostatic/chemical interaction between IL and GO, the introduction of IL into functional composites could not only alleviate aggregation but also might increase the water-solubility.38,39 In addition, IL can physically interact with the –OH group of chitosan via hydrogen bonding, to enhance the stability and strength of the multi-components composite.
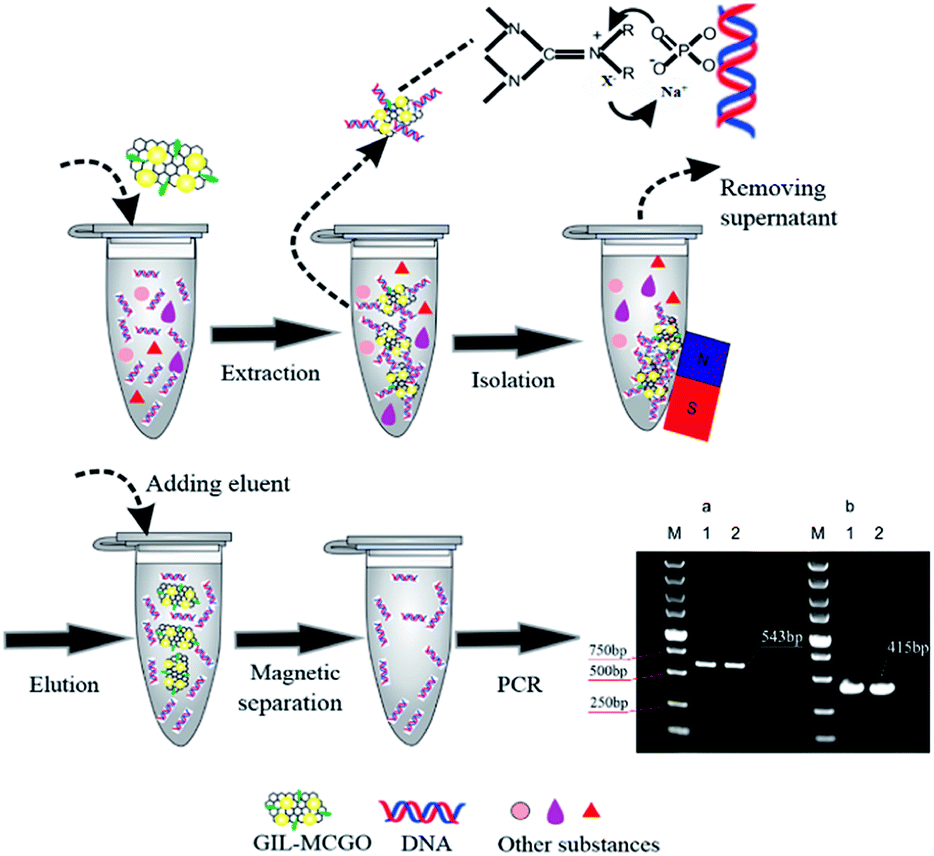
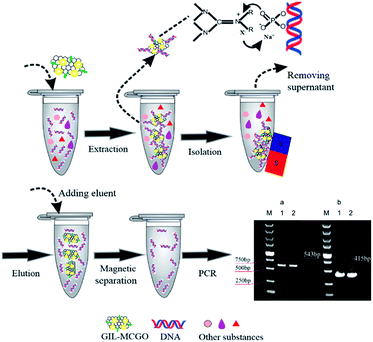
In this paper, a series of guanidinium ILs modified magnetic chitosan graphene oxide (GIL-MCGO) nanocomposites with smaller size (20 nanometers in diameter) have been prepared for DNA purification. The optimized GIL-MCGO based extraction procedures are capable of performing rapid and highly efficient extraction of single-stranded and double-stranded DNA from a matrix containing metal ions and/or proteins. Genomic DNA extracted from human whole blood and plasmid DNA (pDNA) extracted from a bacterial cell lysate using this method were shown to be a high-quality template for PCR (as shown in Scheme 1).
 |
| | Scheme 1 The process of DNA purification. | |
Experimental
Apparatus
GIL-MCGO nanocomposites were dried by a Labconco FreeZone freeze dryer (Kansas City, MO, USA). All batch extraction experiments were performed on a ZWY-240 thermostats cultivating shaker (Shanghai, China). Concentration of DNA was determined by a Thermo Scientific NanoDrop 2000 spectrophotometer (Waltham, MA, USA). The magnetic hysteresis and morphology of GIL-MCGO nanocomposites were characterized by a MicroSense EV11 Vibrating Sample Magnetometer (Lowell, MA, USA), a STA 409 PC Thermogravimetric analysis (Germany) and a Hitachi HT-7700 transmission electron microscope (Tokyo, Japan), respectively.
Reagents and materials
Chitosan with viscosity of 100–200 mPas, 95% degree of deacetylation, and methylacrylic acid (≥99.5%), propionic acid (≥99.5%), n-butyl bromide (≥98%), acrylic acid (≥99%), 1-bromohexane (99%), 1-bromooctane (≥99%), anhydrous magnesium sulfate (99.9%), potassium carbonate (≥99%), tetrabutylammonium bromide (99%), sodium bromide (99%), paraffin liquid (≥99%) and bovine hemoglobin were all purchased from Macklin Biochemical Technology Co., Ltd (Shanghai, China). Single layer graphene oxide with a thickness of 0.8–1.2 nm was purchased from Xianfeng Nano Material Technology Co., Ltd (Nanjing, China). Salmon sperm DNA sodium salt, KCl, CaCl2·2H2O, MgCl2·6H2O were purchased form Sigma-Aldrich Co. Llc (St. Louis, MO, USA). 1-Ethyl-3-(3-dimethylaminopropyl)carbodiimide hydrochloride (EDC) and N-hydroxysuccinimide (NHS) were purchased from Adams Reagent Co., Ltd. (Shanghai, China). 1,1,3,3-tetramethylguanidine (TMG, 99%), acetate (≥99.8%), fomate acid (≥98%), itaconic acid (≥99%), maleic acid (≥99%), iron(III) oxide, span ™80 were purchased from Aladdin Reagent Co., Ltd. (Shanghai, China). DL-lactic acid (≥85%), acetonitrile (≥99.8%), dichloromethane (≥99.8%), activated carbon, NaOH, NaCl, H3PO4 (≥80%), H3BO3, 1-butanol (≥99%), methanol (≥99.5%), ethanol (≥99.7%), glucose were procured from Sinopharm Chemical Reagent Co., Ltd. (Shanghai, China). Petroleum ether (≥95%), EDTA-2Na (≥99%) and glutaraldehyde solution (50% in H2O) were purchased from Huihong Reagent Co., Ltd (Hunan, China). Plasmid miniprep kit, animal genomic DNA kit, double-stranded and single-stranded DNA, proteinase k were purchased from Qingke Biotechnology Co., Ltd. (Hunan, China). Agarose M, Tris–HCl (>99.9%), SDS (>97%) were purchased from Sangon Biotech Co., Ltd. (Shanghai, China). 2×Taq plus master mix (dye plus) was purchased from Vazyme Biotech Co., Ltd. (Nanjing, China). DL-5000 DNA Marker was purchased from Takara Co., Ltd. (Beijing, China).
Synthesis of ionic liquid
Eight tetraalkylguanidinium-based ILs (Fig. 1a–h) consist of 1,1,3,3-tetramethylguanidinium cation and different anions were directly synthesized by neutralization of 1,1,3,3-tetramethylguanidine (TMG) and acids.34,35 Three hexaalkylguanidinium-based ILs (Fig. 1i–k) which have the same anion with different cation were prepared by stirring a mixture of TMG, haloalkanes, tetrabutylammonium bromide and potassium carbonate at 60 °C.33 The reaction conditions including the amount of reactant, reaction time and temperature, etc. are shown in the ESI.† All of the ILs were dried under vacuum at 70 °C for 24 h before use.
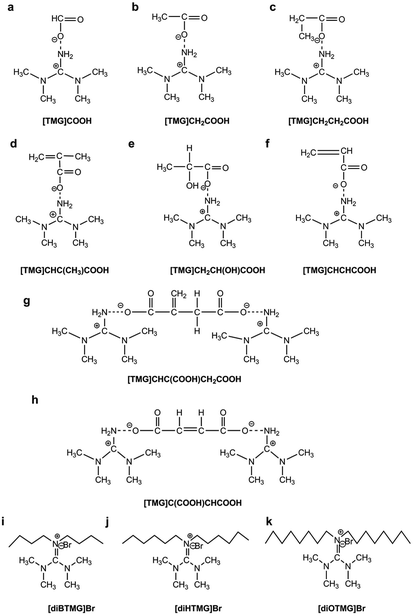 |
| | Fig. 1 Chemical structure of ionic liquids. | |
Extraction of synthetic oligonucleotide and salmon sperm DNA sodium salt
For extraction of synthetic oligonucleotide, a 20-base oligonucleotide with sequence of 5′-ACG GTG CCC ATC TAC GAG GG-3′ and a 21-base oligonucleotide with sequence of 5′-TGA TGT CCC GCA CGA TCT CCC-3′ were dissolved in TE buffer (pH 8) separately with a final concentration of 1000 nM (7 ng μL−1). Extraction experiments were performed on a thermostat cultivating shaker with a shaker speed of 400 rpm. 2 mg synthetic GIL-MCGO nanocomposites are employed to extract 1 mL DNA solution for 30 minutes under 35 ± 0.1 °C. Subsequently, GIL-MCGO nanocomposites were separated by an external magnetic field and the concentration of DNA post extraction was measured at 260 nm using a NanoDrop 2000 spectrophotometer from Thermo Scientific. Extraction efficiency (W%) and extraction capacity (Q mg g−1) were calculated by:| |
 | (1) |
| |
 | (2) |
where C (ng μL−1) and V (mL) represent the concentration and volume after extraction. C0 (ng μL−1) and V0 (mL) represent the concentration and volume before extraction. m (mg) is the mass of GIL-MCGO nanocomposites.
For extraction of salmon sperm DNA sodium salt, 10 mg synthetic GIL-MCGO nanocomposites are employed to extract an aqueous solution containing 7 ng μL−1 of 2000 bp salmon sperm DNA sodium salt was prepared in TE buffer (pH 8). The extraction was conducted with the same process as in the single stranded DNA extraction.
Extraction of DNA from a complex matrix
Sample matrices containing metal ions or protein (BHb) were prepared from stock solution. For experiments involving metal ions as matrix components, the sample solution containing 22![[thin space (1/6-em)]](https://www.rsc.org/images/entities/char_2009.gif) 670 ng μL−1 NaCl, 11400 ng μL−1 KCl, 468 ng μL−1 CaCl2, 5750 ng μL−1 MgCl2, and 50 ng μL−1 DNA sodium salt was extracted in triplicate using 10 mg synthetic GIL-MCGO nanocomposites. For experiments involving protein as a matrix component, the sample solution was prepared at an BHb concentration of 1000 μg mL−1 and DNA concentration of 1000 μg mL−1 with the pH at 4. BHb was measured at 406 nm using a NanoDrop 2000 spectrophotometer.
670 ng μL−1 NaCl, 11400 ng μL−1 KCl, 468 ng μL−1 CaCl2, 5750 ng μL−1 MgCl2, and 50 ng μL−1 DNA sodium salt was extracted in triplicate using 10 mg synthetic GIL-MCGO nanocomposites. For experiments involving protein as a matrix component, the sample solution was prepared at an BHb concentration of 1000 μg mL−1 and DNA concentration of 1000 μg mL−1 with the pH at 4. BHb was measured at 406 nm using a NanoDrop 2000 spectrophotometer.
Conditions for E. coli cell transformation
E. coli DH-5α cells were transformed with a modified plasmid (PGEMT-Bmp4) containing 415 bp DNA insert. 1 μL purified plasmid was added to a centrifuge tube which contains 50 μL competent cells and mixed gently. The mixture was placed on ice for 30 min before heat at 80 °C for 80 s, then chilled on ice immediately for 5 min. 600 μL non-resistant Luria Bertani (LB) medium was added to the sample. After being centrifuged at low speed, the sample was incubated at 37 °C for 12 h. Single colony was selected and placed in a LB medium containing ampicillin (100 mL containing 50 mg L−1 ampicillin). E. coli cell cultures were cultured in a shaker for 12 h at 37 °C.
Extraction of plasmid DNA from bacterial solution
A 1.5 mL aliquot of E. coli cell culture was centrifuged at 12000 g for 1 min, then resuspended in a 200 μL solution (pH 8) containing 25 mmol L−1 Tris–HCl, 10 mmol L−1 EDTA-2Na and 50 mmol L−1 glucose. A 200 μL solution containing 0.2 mmol L−1 NaOH and 1% SDS was added into the above sample with gentle mixing. A 200 μL potassium acetate (3 mol L−1) and acetic acid (2 mol L−1) solution (pH 4.8) was then added and the final solution was diluted to 1000 μL using 0.01 mol L−1 BR buffer at pH 2. 1000 μL cell lysate was adsorbed by 10 mg GIL-MCGO nanocomposites for 10 min. After pre-washing with 70% ethanol, the GIL-MCGO nanocomposites were eluted by 500 μL 0.04 mmol L−1 BR buffer at pH 10 and subjected to PCR assay.
Extraction of genomic DNA from human whole blood
Human whole blood samples from healthy volunteers were provided by Sanzhen Community Health Service Center (Changsha, China). All experiments were performed in accordance with the principles outlined in the Declaration of Helsinki, and Experiments were approved by the ethics committee at Hunan Normal University. Informed consents were obtained from human participants of this study. Blood samples were stored at −20 °C for future use. A 200 μL aliquot of human whole blood sample was mixed with 20 μL proteinase k (20 μg μL−1) and whirlpool for 10 s. 200 μL buffer gA1 was added into the sample with thoroughly mixing. The mixture was then incubated in a water bath for 15 min under 70 °C before 200 μL ethanol being added. The DNA in the lysate was extracted by 10 mg GIL-MCGO nanocomposites for 10 min. After washing several times, the GIL-MCGO nanocomposites have been separated and eluted by 500 μL BR buffer at pH 10 (0.04 mmol L−1) and subjected to PCR assay.
Real-time quantitative PCR assays
E. Coil cell lysate: PCR assay was performed using a 415 bp Bmp4 gene fragment with forward primer 5′-CAAATAGATGACGCCTTCTC-3′(molecular weight = 6061.0 Da) and reverse primer 5′-GCTTTCGACCTCTTTGTTTA-3′ (molecular weight = 6040.0 Da). The PCR mixture contains 1 μL recovered pDNA, 2 μL forward/reverse primer (10 μmol L−1) and 25 μL 2×Taq Plus Master Mix, with a final volume of 50 μL.
Human whole blood samples: PCR assay was performed using a 543 bp P53 gene fragment with forward primer 5′-CCACCATCCACTACAAC-3′ (molecular weight = 5028.3 Da) and reverse primer 5′-GCTTGCTTACCTCGCTTAG-3′ (molecular weight = 5745.8 Da). The PCR mixture contains 2 μL recovered DNA, 2 μL forward/reverse primer (10 μmol L−1) and 25 μL 2×Taq Plus Master Mix, with a final volume of 50 μL.
PCR temperature program was 95 °C for 3 min, 30 cycles at 90 °C for 15 s, 57 °C for 20 s, 72 °C for 1 min, and finally extended at 72 °C for 10 min.
Results and discussion
Preparation of GIL-MCGO nanocomposites
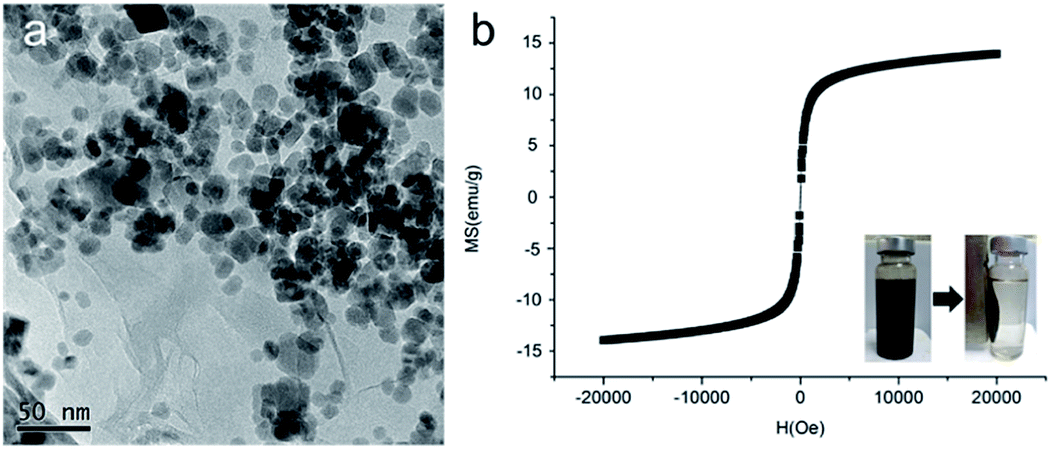
MCGO composites were prepared based on our previous work with certain modifications to have smaller size and increased surface to bulk ratio (the synthesis of GIL-MCGO nanocomposites is provided in ESI†). In the presence of catalysts, carboxyl group of GO chemically reacts with amine group of magnetic chitosan, consequently forming chemical bond between GO and chitosan. However, MCGO composites are easily aggregated and will affect its extraction performance. To mitigate the aggregation, guanidinium ILs are utilized to modify these MCGO composites. As observed in Rajesh's work, immobilization of ionic liquids on among nanocomposites to prevent aggregation and promote the dispersion of graphene oxide.40 Concurrently, hydroxyl groups of chitosan can also interact with nitrogen-containing ionic liquids to form intermolecular hydrogen bonds.41 By optimizing the preparation process, MCGO composites with smaller size have been obtained and were modified by different GILs for DNA extraction (TGA, FT-IR spectra of GIL-MCGO nanocomposites is in the ESI†). In Fig. 2(a), the diameter of the GIL-MCGO nanocomposites is only about 20 nanometers (the size distribution of GIL-MCGO nanocomposites is in the ESI†). Fig. 2(b) shows the magnetic hysteresis loop of the GIL-MCGO. It can be seen that the magnetic hysteresis loop was S-like shape and shows superparamagnetism of the nanocomposites. The maximum saturation magnetization of the GIL-MCGO nanocomposites is 14.0 emu g−1, which is sufficient for GIL-MCGO nanocomposites to be separated from their dispersion by an external magnetic field. Further, XRD pattern in the ESI† shows the crystalline phase of Fe3O4 was unchanged in the GIL-MCGO nanocomposites.
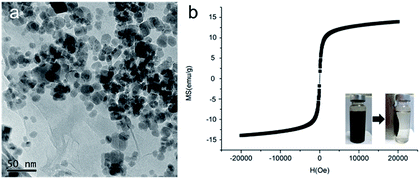 |
| | Fig. 2 TEM image (a) and magnetic hysteresis loop (b) of GIL-MCGO nanocomposites. | |
Extraction of synthetic oligonucleotide and salmon sperm DNA sodium salt
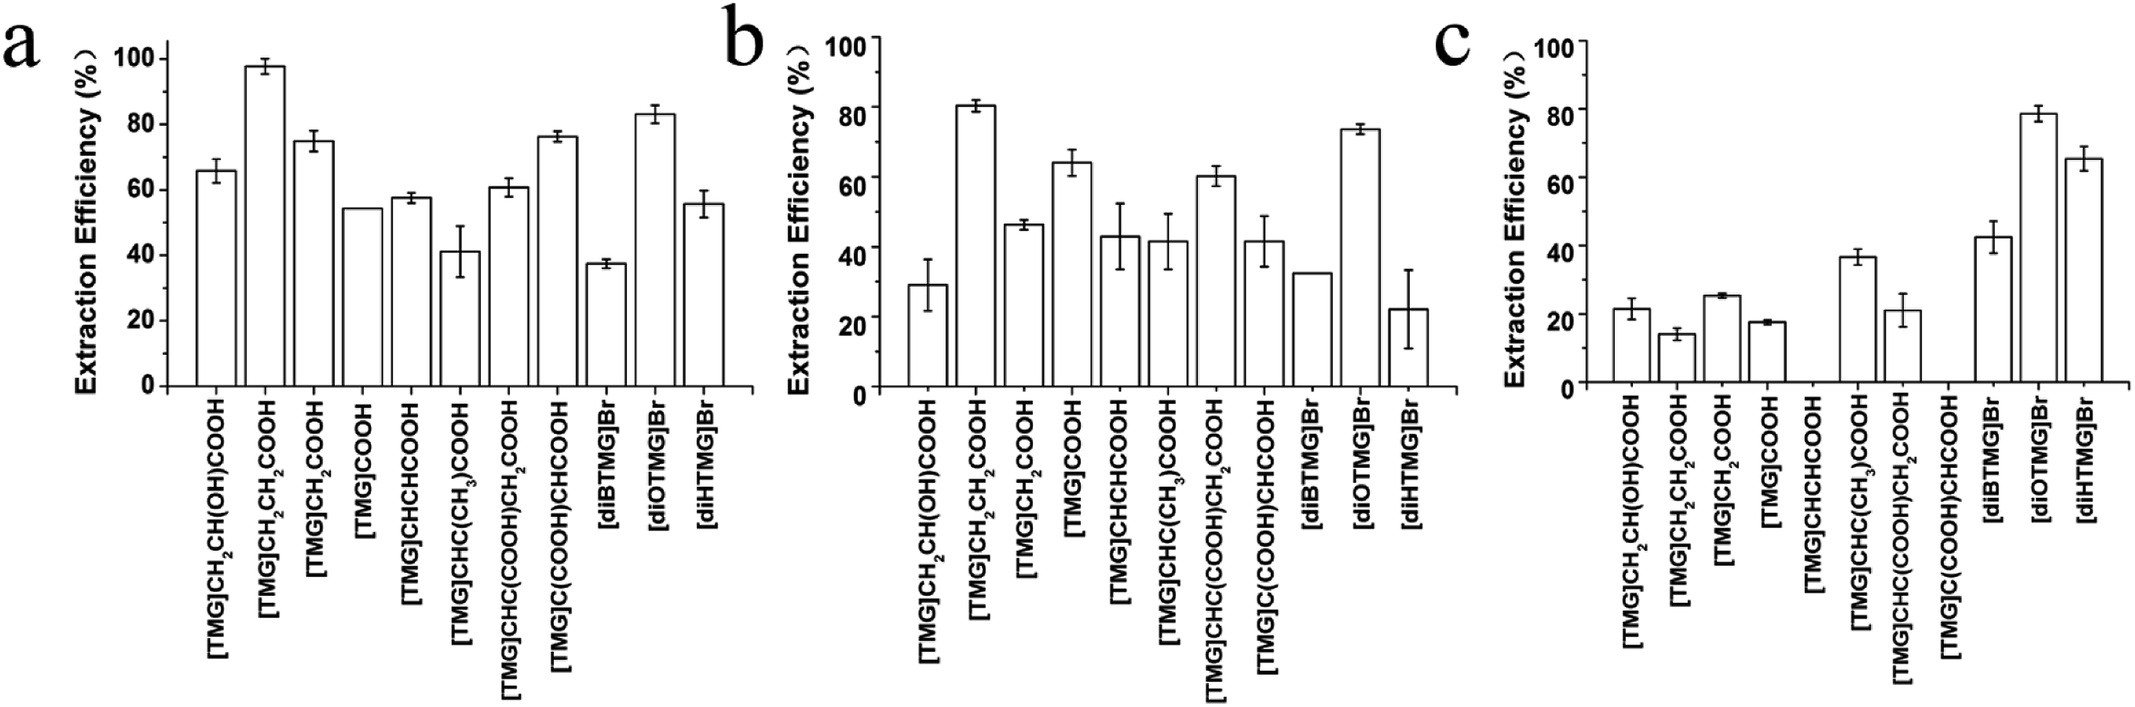
MCGO nanocomposites have been modified by 11 different guanidinium ILs (8 anionic tetraalkylguanidinium-based ILs and 3 cationic hexaalkylguanidinium-based ILs, Fig. 1) for DNA extraction. For single stranded DNA extraction (20-base oligonucleotide and 21-base oligonucleotide), all of the GIL-MCGO nanocomposites have extracted DNA from the solution. But the extraction performance of the GIL-MCGO nanocomposites are varying, with extraction efficiencies ranging from 37.4 to 97.7% (Fig. 3). The [TMG]CH2CH2COOH-MCGO has the highest extraction efficiencies both in 20-base oligonucleotide and 21-base oligonucleotide extraction. [diOTMG]Br-MCGO also has very high extraction efficiencies of 83 ± 3% and 73 ± 2%, respectively.
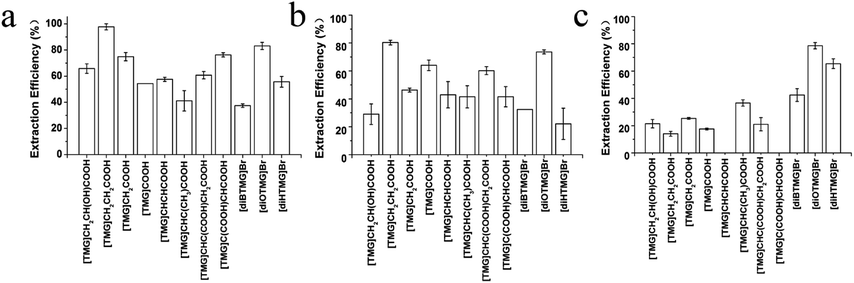 |
| | Fig. 3 Extraction efficiencies of 20-base oligonucleotide (a); 21-base oligonucleotide (b) and DNA sodium salt (c) by different GIL-MCGO nanocomposites. GIL-MCGO nanocomposites: 2 mg; DNA solution: 7 ng μL−1, 1 mL; extraction time: 30 min. | |
In the case of salmon sperm DNA sodium salt extraction, the extraction efficiencies of GIL-MCGO nanocomposites are very different from those of synthetic oligonucleotide extraction. [diOTMG]Br-MCGO has the highest extraction efficiency of DNA sodium salt, reaching 79 ± 2%. [diHTMG]Br-MCGO also has high extraction efficiency of 65 ± 4%. As a contrast, the extraction efficiencies of anionic tetraalkylguanidinium-based ILs are relatively low, with the values around 20%. [TMG]CHCHCOOH-MCGO and [TMG]C(COOH)CHCOOH-MCGO have no adsorption of DNA sodium salt. Thus, the extraction performance of various GIL modified MCGO nanocomposites is highly dependent on specific DNA species.
Optimization of extraction process
[diOTMG]Br-MCGO was selected to optimize extraction condition of the magnetic solid-phase extraction procedure, due to its high DNA extraction efficiency shown in the initial tests. Several factors, such as pH, temperature, extraction time and ionic strength were optimized to achieve the best extraction efficiency. 10 mg GIL-MCGO nanocomposites were used to extract 1 mL DNA sodium salt (7 ng μL−1) in the experiments. The shaker speed was 400 rpm. 0.04 mol L−1 BR buffer was used to adjust the pH of solution.
Effect of pH value on extraction efficiency. In biological or environmental samples, the pH values of DNA solutions are often variable and may have influence on the extraction behavior of DNA with the coexistence of interfering matrix components/contaminants.42 To investigate the effect of pH on DNA extraction efficiency, solutions of DNA sodium salt with pH value ranging from 2–12 were prepared and subjected to magnetic solid-phase extraction with all other factors unchanged (temperature was 35 °C, extraction time was 30 min, information of buffer system used is provided in ESI†). Results are shown in Fig. 4(a). The extraction efficiencies of DNA were higher than 90% when pH varied from 2 to 4. At pH 6, the extraction efficiency decreased to around 80%. These observations could be well explained by the electrostatic interaction between DNA and the GIL-MCGO nanocomposites. As illustrated in our previous work,43 the isoelectric point (pI) of GIL-MCGO nanocomposites is 6.3 (the zeta potential of GIL-MCGO nanocomposites is provided in ESI†). At pH 2–6.3, the surface of GIL-MCGO nanocomposites is positively charged, while the DNA is negatively charged within the same pH range. Therefore, the strong electrostatic attraction between GIL-MCGO nanocomposites and DNA at a lower pH value facilitates the extraction of DNA and finally results in favorable extraction efficiency. At pH > 6.3, the surface of the GIL-MCGO nanocomposites turns to negatively charged and the electrostatic repulsion deteriorates the extraction of DNA. With the increase of pH value, the negative surface charges of GIL-MCGO nanocomposites gradually accumulate, leading to a decrease of DNA extraction efficiency. Thus, pH = 4 was selected for subsequent extraction.
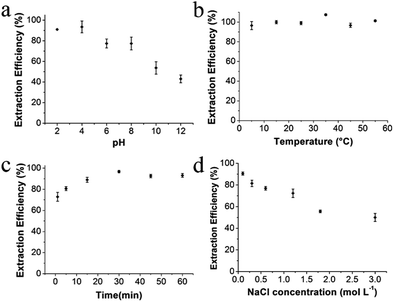 |
| | Fig. 4 Effects of (a) pH, (b) temperature, (c) extraction time and (d) ionic strength. [diOTMG]Br-MCGO nanocomposites: 10 mg; DNA sodium salt: 7 ng μL−1, 1 mL; extraction time: 30 min. | |
Effect of temperature. Temperature is also one of the factors that need to be considered as the extraction properties of adsorbent material might be affected in the case of too high/low temperature. In this work, the DNA sodium salt sample solution was extracted by [diOTMG]Br-MCGO under the same condition (pH was 4, extraction time was 30 min) except temperature. Extraction results are shown in Fig. 4(b). It can be seen from the graph that the extraction efficiencies were almost the same and all higher than 96% from 5 to 55 °C. That is, GIL-MCGO nanocomposites in this work are stable and the extraction process is not susceptible to temperature within this range. Comprehensive consideration, 35 °C was selected for subsequent extraction.
Effect of extraction time. Extraction time is an important indicator to evaluate the performance of adsorbent materials. Good adsorbent should achieve high extraction efficiency in a short period of time. In order to investigate the relationship between extraction time and efficiency of GIL-MCGO nanocomposites, the DNA sodium salt sample was subjected to extraction for 1 to 60 min (temperature was 35 °C, pH was 4). Fig. 4(c) shows the results. It can be seen that the extraction efficiency reached 78 ± 4% within 1 minute. After 15 minutes, the extraction efficiency became higher than 90%. At ∼30 min, absorption and desorption of DNA reached an equilibrium, resulting in a maximum extraction efficiency. Thus, 30 min was used for subsequent extraction.
Effect of ionic strength. Usually, ionic strength shows an important effect on biomacromolecules extraction performance, and electrostatic interaction plays a major role in the extraction process. In this work, the effect of ionic strength was investigated by adding NaCl (0.1–3.0 mol L−1) into the DNA sodium salt sample solution (temperature was 35 °C, extraction time was 30 min, pH was 4). From Fig. 4(d), we can see that the extraction efficiency is highest (91 ± 1%) at NaCl concentration of 0.1 mol L−1. When NaCl increased to 0.3 and 0.6 mol L−1, the extraction efficiencies dropped to 82 ± 3% and 77 ± 2% respectively. As further increase of ionic strength, an obviously decrease was observed on the extraction efficiency of DNA. At NaCl concentration of 3.0 mol L−1, only 50 ± 4% of DNA has been extracted by GIL-MCGO nanocomposites. This observation indicates that increase of ionic strength diminished electrostatic interaction between GIL-MCGO nanocomposites and DNA.
Extraction capacity of GIL-MCGO nanocomposites to DNA
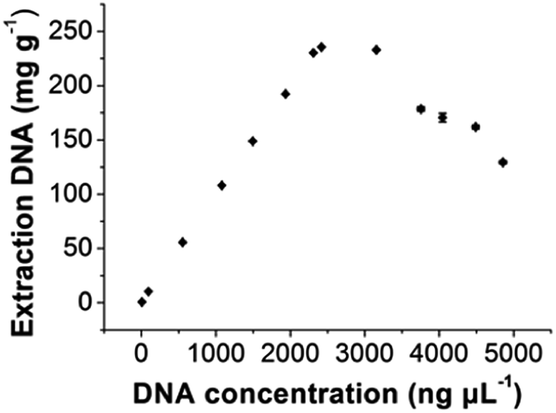
In order to evaluate the extraction capacity of the GIL-MCGO nanocomposites to DNA, 1.0 mL sample solution with various DNA concentrations (7–5000 ng μL−1) were prepared in a BR buffer with pH 4 and treated with 10 mg GIL-MCGO nanocomposites under 35 °C. The amount of the extracted DNA at each concentration level was derived and illustrated in Fig. 5. It can be seen from Fig. 5 that the binding amount of DNA on GIL-MCGO nanocomposites increases quickly with DNA concentration. When DNA concentration increased to 2500 ng μL−1, the extraction capacity reached a plateau with a maximum extraction capacity of 233.0 ± 0.4 mg g−1. What needs to be mentioned is that floccule was observed when DNA concentration exceeds 3000 ng μL−1, and the corresponding extraction capacity started to drop under such high concentrations. It was speculated that the GIL-MCGO nanocomposites get aggregated under very high DNA concentration, resulting in decreased extraction capacity. This phenomenon should not affect the application of GIL-MCGO nanocomposites, in general, the concentrations of DNA in biological samples are much lower. Table 1 compares the maximum DNA extraction capacity of the present composite with those of other materials reported in the literatures. It is obvious that the GIL-MCGO nanocomposites offers the highest extraction capacity for DNA.
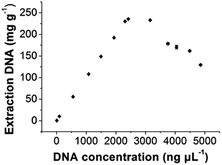 |
| | Fig. 5 Extraction capacity of GIL-MCGO nanocomposites for DNA. [diOTMG]Br-MCGO nanocomposites: 10 mg; DNA sodium salt: 7–5000 ng μL−1, 1 mL; pH: 4; extraction time: 30 min. | |
Table 1 An overview on recently reported methods for DNA extraction
| Materials |
Method |
Extraction DNA (mg g−1) |
References |
| M-MSN |
NanoDrop 1000 spectrophotometer |
121.6 |
44 |
| Hb modified Fe3O4@SiO2–NH2 |
UV-visible spectroscopy |
27.7 |
45 |
| IL-Fe3O4 |
UV-visible spectroscopy |
19.8 |
46 |
| PEI-FePO4 |
PCR |
61.9 |
47 |
| Fe&Ni-mc-poly(HEMA-AdeM) |
UV-visible spectroscopy |
91.8 |
48 |
| DES-mCS/MWCNTs |
UV-visible spectroscopy |
177.6 |
3 |
| GIL-MCGO |
NanoDrop 2000 spectrophotometer |
233.0 |
This work |
Comparison of Fe3O4, MC, MCGO and GIL-MCGO
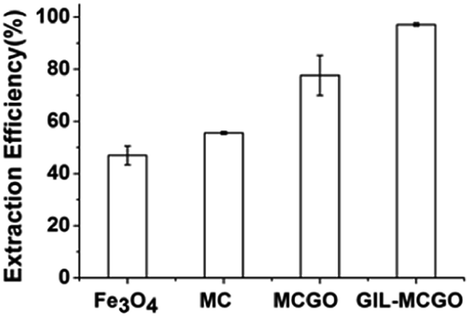
In order to compare the DNA extraction performance of the GIL-MCGO nanocomposites, commercial Fe3O4 particles, magnetic chitosan particles and magnetic chitosan-graphene oxide composites, 1 mL DNA sodium salt (7 ng μL−1) has been extracted for 30 min by using these composites/particles under 35 °C at pH 4, separately. As shown in Fig. 6, the GIL-MCGO nanocomposites extracted a much higher amount of DNA compared to Fe3O4 under the same condition. One of the reasons should be, unlike the Fe3O4 particles, the GIL-MCGO nanocomposites possess cationic framework that is capable of engaging in electrostatic interactions with the negatively charged phosphate backbone of DNA. Another reason is the surface area. Compare to magnetic chitosan (MC), the introduction of graphene oxide (GO) enlarged surface area of the composites. In the presence of catalysts, carboxyl group of GO chemically reacts with amine group of chitosan and consequently form chemical bond between GO and chitosan. But MCGO composites are easily aggregated and will affect its extraction performance. Immobilization of ionic liquids on the material enables them to have electrostatic repulsion accordingly prevent aggregation and promote the dispersion of the nanocomposites. Therefore, the extraction efficiency of GIL-MCGO nanocomposites are higher than both MC and MCGO composites.
 |
| | Fig. 6 DNA extraction by using different materials. Nanocomposites: 10 mg; DNA sodium salt: 7 ng μL−1, 1 mL; pH: 4; extraction time: 30 min. | |
The GIL-MCGO nanocomposites extraction preference on DNA with different bases
In order to investigate extraction preference between the system and different basic groups, 2 mg magnetic composite modified by different GILs have been used to extract 1 mL of 1000 nM single strand DNAs with different sequence (same base number) under the same condition. The results are shown in Table 2. It can be seen that the structure of GIL modified on the surface of the nanocomposites influences extraction preference of ATCG ssDNA. For example, 88.5 ± 0.02% of dT21 has been extracted by [TMG]CHC(CH3)COOH-MCGO while only 36.9 ± 0.01% has been extracted by [diBTMG]Br-MCGO. Also, extraction efficiencies of ATCG ssDNA are different even when using the same GIL-MCGO nanocomposites as absorbent. For example, 95.00 ± 0.01% of dG21 have been extracted by [TMG]CH2CH2COOH-MCGO while only 54.9 ± 0.03% of C ssDNA have been extracted. Different structure of GIL-MCGO nanocomposites have different extraction preference of basic groups. Therefore, we can select the most suitable GIL-MCGO nanocomposites to extract DNA with different sequences according to this table. For example, [TMG]CH2CH2COOH-MCGO can be used to extract DNA that has high percentage of base dG21, while [TMG]CHC(COOH)CH2COOH-MCGO can be used to extract DNA with high percentage of base dC21.
Table 2 Extraction efficiencies of ATCG by using different GIL-MCGO nanocomposites
| GIL-MCGO nanocomposites |
Extraction efficiencies (%) |
| dA21 |
dT21 |
dC21 |
dG21 |
| [TMG]COOH |
63.9 ± 0.02 |
76.6 ± 0.04 |
66.7 ± 0.03 |
74.7 ± 0.05 |
| [TMG]CH2COOH |
79.9 ± 0.03 |
88.1 ± 0.03 |
93.7 ± 0.08 |
85.5 ± 0.01 |
| [TMG]CH2CH2COOH |
55.9 ± 0.06 |
66.4 ± 0.02 |
54.9 ± 0.03 |
95.0 ± 0.01 |
| [TMG]CH2CH(OH)COOH |
102.3 ± 0.03 |
117.3 ± 0.05 |
118.3 ± 0.08 |
18.4 ± 0.08 |
| [TMG]CHCHCOOH |
60.8 ± 0.06 |
68.3 ± 0.02 |
72.2 ± 0.07 |
24.1 ± 0.01 |
| [TMG]CHC(CH3)COOH |
81.4 ± 0.02 |
88.5 ± 0.02 |
106.4 ± 0.05 |
100.3 ± 0.03 |
| [TMG]CHC(COOH)CH2COOH |
68.3 ± 0.1 |
73.4 ± 0.07 |
96.5 ± 0.02 |
56.6 ± 0.2 |
| [TMG]C(COOH)CHCOOH |
97.7 ± 0.05 |
78.5 ± 0.06 |
83.3 ± 0.1 |
55.1 ± 0.05 |
| [diBTMG]Br |
63.2 ± 0.06 |
36.9 ± 0.01 |
32.6 ± 0.06 |
30.5 ± 0.07 |
| [diHTMG]Br |
41.4 ± 0.06 |
47.8 ± 0.01 |
43.7 ± 0.1 |
54.5 ± 0.05 |
| [diOTMG]Br |
62.0 ± 0.03 |
88.8 ± 0.02 |
85.2 ± 0.07 |
62.8 ± 0.2 |
Method validation
The proposed method was validated by precision experiment and repeatability experiment. Apparatus precision was researched by analyzing DNA solution for three times by NanoDrop under the same condition. The results indicate that the RSD was 4.9% (n = 3), showing the precision of the NanoDrop is excellent. Repeatability experiment was performed by taking three copies of the same sample measured under the same condition, respectively. The value of RSD was 5.1% (n = 3), showing the method has good repeatability.
Regeneration studies
A series of extraction–desorption experiments were carried out to evaluate the possibility of reusability and regeneration of GIL-MCGO nanocomposites. 0.04 mol L−1 BR buffer (pH = 10) was selected as stripping reagent (The desorption efficiency is provided in ESI†). After desorption, the regenerated GIL-MCGO nanocomposites has been utilized to extract DNA again. Four consecutive extraction–desorption cycles were taking. The results are illustrated in Fig. 7. Only a slight loss in the extraction efficiency of DNA after four cycles, proving good performance and recyclability of the GIL-MCGO nanocomposites in the DNA extraction.
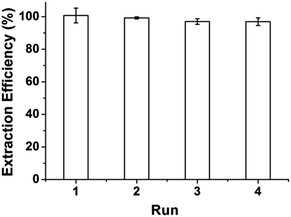 |
| | Fig. 7 Extraction efficiency of DNA for different cycles. [diOTMG]Br-MCGO nanocomposites: 10 mg; DNA sodium salt: 7 ng μL−1, 1 mL; pH: 4; extraction time: 30 min. | |
Extraction of DNA from a complex matrix
Highly accurate and reliable DNA analysis is the foundation to various biological applications. Interfering components or contaminants in biological samples, such as metal ions and proteins, are known to reduce the sensitivity and reproducibility of DNA analysis. If the sample is not sufficiently purified from contaminants, the feasibility of downstream experiments may be affected in some cases. Therefore, it is important to determine the performance of GIL-MCGO nanocomposites for extracting DNA from complex samples.
The extraction performance of the GIL-MCGO nanocomposites was evaluated for 2000 bp DNA sodium salt in the presence of NaCl, KCl, CaCl2, MgCl2. Results are shown in Fig. 8(a). It can be seen from Fig. 8(a) that the extraction efficiencies of DNA from the metal ions matrix sample are similar to those from the neat solution, only a very small to negligible variation in extraction efficiencies was observed for the GIL-MCGO nanocomposites ([TMG]CH2CH2COOH-MCGO and [diOTMG]Br-MCGO as representatives).
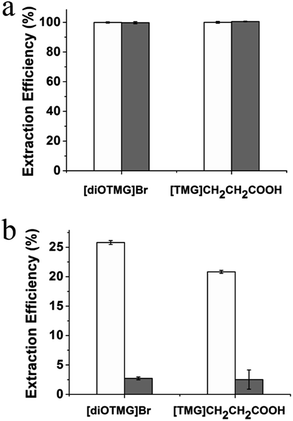 |
| | Fig. 8 (a) Comparison of DNA extraction efficiencies from both a neat solution (black bars) and a matrix containing metal ions (NaCl, KCl, CaCl2, MgCl2, grey bars); (b) extraction results of mixed sample. Black bars represent the extraction efficiencies of DNA, while grey bars represent the extraction efficiencies of BHb. Nanocomposites: 10 mg; DNA sodium salt: 7 ng μL−1 (a), DNA sodium salt and BHb: 1000 ng μL−1 (b), 1 mL; pH: 4; extraction time: 30 min. | |
The effect of protein on the extraction efficiency of DNA was researched by preparing aqueous 2000 bp DNA sodium salt solution containing bovine hemoglobin (BHb) as a model protein. The extraction efficiencies of both DNA and BHb were investigated at pH 4. As shown in Fig. 8(b), GIL-MCGO nanocomposites exhibit different extraction behavior on DNA and BHb. When BHb spiked into the solution, the extraction efficiencies of both DNA and BHb decreased in some extent. But DNA still showed relatively high extraction efficiencies while BHb were almost unabsorbed in this work. At pH 4, electrostatic attraction has taken place between the opposite-charged DNA and GIL-MCGO nanocomposites (pI 6.3). However, BHb (pI 6.8) possesses the same positive charge with GIL-MCGO nanocomposites in the buffer, which hinders the extraction of BHb. Therefore, GIL-MCGO nanocomposites may be used to purify DNA from BHb under this experimental condition.
Extraction of DNA from human whole blood and bacterial cell lysate
Before DNA was extracted from the bacterial cell lysate actual sample, there was a DNA purification process that removes proteins and cell membranes. After the purification was completed, most of the protein in the cell solution will be removed, and then GIL-MCGO was used to extract the DNA. Under strong alkaline conditions, plasmid DNA and genomic DNA are simultaneously released from the cells and denatured. In the presence of neutral pH and high salt concentration conditions, plasmid DNA was rapidly refolded to a soluble state, and genomic DNA cross-links to form an insoluble network structure, while under high salt conditions, sodium dodecyl sulfate (SDS) and denatured proteins combine to form a precipitate, and the average two amino acids bind to one SDS molecule, while the K+ in the solution replaces Na+ in the SDS to form an insoluble potassium dodecyl sulfate (PDS), and the genomic DNA was easily coprecipitated by PDS. Genomic DNA and denatured proteins and cell debris will form a precipitate under the action of detergent SDS. At this point most of the protein in the solution has precipitated completely. When nanoparticles were extracted from plasmid DNA, impurities such as proteins have been removed.
The yield and quality of isolated DNAs from the biological sample matrices were estimated by measuring the absorbance at 260 nm (A260) and the absorbance ratio at A260 nm and A280 nm (A260/A280). The concentration of the isolated DNA was detected according to NanoDrop 2000 spectrophotometer and the yield of DNA was calculated based on the concentration and the volume of the eluate. 8.65 μg of human blood genomic DNA and 19.6 μg of plasmid DNA were isolated from 200 μL of human whole blood and 1.5 mL of E. coli cell culture using GIL-MCGO nanocomposites. The A260/A280 ratio of DNA recovered from human whole blood and E. coli cell lysate were ca. 1.87 and 1.85, respectively, indicating to the isolated DNA template was of high purity and favorable quality.
Fig. 9 illustrates the electrophoretograms for the PCR products. It can be seen that the 543 bp and 415 bp amplified products from human whole blood gene and E. coli cell lysate are clearly from the corresponding samples by using the GIL-MCGO nanocomposite as the adsorbent is comparable to those obtained using the commercial DNA extraction kit. The successful PCR amplifications demonstrate that the DNAs isolated from both human whole blood and E. coli cell lysate are of high purity, indicating the favorable efficiency of GIL-MCGO nanocomposites for DNA extraction.
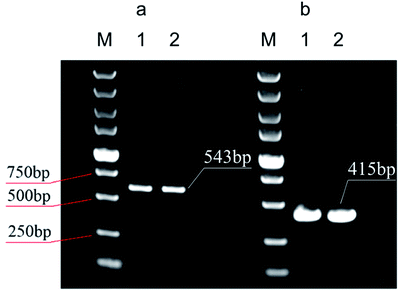 |
| | Fig. 9 The electrophotograms for the PCR products. (a) Human whole blood sample. M: DNA molecular weight marker, lane 1: PCR product from blood DNA extracted by commercial kits, lane 2: PCR products from blood DNA extracted by GIL-MCGO nanocomposites; (b) E. coli cell lysate sample. M: DNA molecular weight marker, lane 1: PCR product from E. coli cell lysate extracted by commercial kits, lane 2: PCR products from E. coli cell lysate extracted by GIL-MCGO nanocomposites. | |
Conclusions
The GIL-MCGO nanocomposite based solid phase extraction provides an efficient method for DNA extraction/purification. The retained DNAs can be readily recovered by simply using BR buffer as stripping reagent. The GIL-MCGO nanocomposite can be regenerated and reused without any degradation of DNA extraction efficiency. The solid phase extraction method based on GIL-MCGO nanocomposites have been demonstrated with the extraction of DNA from a series of real sample matrices, including ssDNA sample, salmon sperm DNA sodium salt, human whole blood and E. coli cell lysate. The DNA extracted by using the GIL-MCGO nanocomposites are well suitable for PCR amplifications. In addition, an initial study on the interaction between GIL-MCGO and DNA is conducted and the preference of GIL-MCGO absorbing DNA with varying base composition is investigated. Such work can guide the future selection process of optimum GIL-MCGO nanocomposite for extraction of any specific DNA sequence.
Conflicts of interest
There are no conflicts to declare.
Acknowledgements
The authors greatly appreciate the financial supports by the Natural Science Foundation of Hunan Province (No. 2018JJ3342).
References
- K. D. Clark, O. Nacham, H. Yu, T. Li, M. M. Yamsek, D. R. Ronning and J. L. Anderson, Anal. Chem., 2015, 87, 1552–1559 CrossRef CAS PubMed.
- O. Nacham, K. D. Clark and J. L. Anderson, Anal. Chem., 2016, 88, 7813–7820 CrossRef CAS PubMed.
- K. Xu, Y. Wang, H. Zhang, Q. Yang, X. Wei, P. Xu and Y. Zhou, Microchim. Acta, 2017, 184, 4133–4140 CrossRef CAS.
- J. Wen, L. A. Legendre, J. M. Bienvenue and J. P. Landers, Anal. Chem., 2008, 80, 6472–6479 CrossRef CAS PubMed.
- E. He, T. Cao, L. Cai, D. Guo, Y. Zhou, X. Zhang and Z. Li, RSC Adv., 2018, 8, 39561–39566 RSC.
- L. Monteiro, D. Bonnemaison, A. Vekris, K. G. Petry, J. Bonnet, R. Vidal, J. Cabrita and F. Mégraud, J. Clin. Microbiol., 1997, 35, 995–998 CAS.
- A. Ziegler, A. Koch, K. Krockenberger and A. Großhennig, Hum. Genet., 2012, 131, 1627–1638 CrossRef CAS PubMed.
- R. Patel, J. T. Kvach and P. Mounts, Microbiology, 1986, 132, 541–551 CAS.
- C. W. Price, D. C. Leslie and J. P. Landers, Lab Chip, 2009, 9, 2484–2494 RSC.
- L. Dauphin, K. Stephens, S. Eufinger and M. Bowen, J. Appl. Microbiol., 2010, 108, 163–172 CrossRef CAS PubMed.
- J. Löffler, H. Hebart, U. Schumacher, H. Reitze and H. Einsele, J. Clin. Microbiol., 1997, 35, 3311–3312 Search PubMed.
- M. Šafaříková and I. Šafařík, J. Magn. Magn. Mater., 1999, 194, 108–112 CrossRef.
- Y. Huang, Y. Wang, Q. Pan, Y. Wang, X. Ding, K. Xu, N. Li and Q. Wen, Anal. Chim. Acta, 2015, 877, 90–99 CrossRef CAS PubMed.
- K. Xu, Y. Wang, X. Ding, Y. Huang, N. Li and Q. Wen, Talanta, 2016, 148, 153–162 CrossRef CAS PubMed.
- A. Rimola, D. Costa, M. Sodupe, J. F. Lambert and P. Ugliengo, Chem. Rev., 2013, 113, 4216–4313 CrossRef CAS PubMed.
- M. Deng, C. Jiang and L. Jia, Anal. Chim. Acta, 2013, 771, 31–36 CrossRef CAS PubMed.
- J. P. Chen, P. C. Yang, Y. H. Ma and T. Wu, Carbohydr. Polym., 2011, 84, 364–372 CrossRef CAS.
- Y. C. Chang and D. H. Chen, J. Colloid Interface Sci., 2005, 283, 446–451 CrossRef CAS PubMed.
- P. E. Podzus, M. E. Daraio and S. E. Jacobo, Phys. B, 2009, 404, 2710–2712 CrossRef CAS.
- A. P. Tiwari, R. K. Satvekar, S. S. Rohiwal, V. A. Karande, A. V. Raut, P. G. Patil, P. B. Shete, S. J. Ghosh and S. H. Pawar, RSC Adv., 2015, 5, 8463–8470 RSC.
- W. Ma, F. Q. Ya, M. Han and R. Wang, J. Hazard. Mater., 2007, 143, 296–302 CrossRef CAS PubMed.
- G. Y. Li, Y. R. Jiang, K. L. Huang, P. Ding and J. Chen, J. Alloys Compd., 2008, 466, 451–456 CrossRef CAS.
- L. Li, C. Luo, X. Li, H. Duan and X. Wang, Int. J. Biol. Macromol., 2014, 66, 172–178 CrossRef CAS PubMed.
- N. Zhang, H. Qiu, Y. Si, W. Wang and J. Gao, Carbon, 2011, 49, 827–837 CrossRef CAS.
- E. Hashemi, O. Akhavan, M. Shamsara, S. Valimehr and R. Rahighi, RSC Adv., 2014, 4, 60720–60728 RSC.
- Q. Liu, J. Shi, J. Sun, T. Wang, L. Zeng and G. Jiang, Angew. Chem., Int. Ed., 2011, 50, 5913–5917 CrossRef CAS PubMed.
- J. Wu, H. Zhao, D. Xiao, P. H. Chuong, J. He and H. He, J. Chromatogr. A, 2016, 1454, 1–8 CrossRef CAS PubMed.
- S. D. Pan, L. X. Zhou, Y. G. Zhao, X. H. Chen, H. Y. Shen, M. Q. Cai and M. C. Jin, J. Chromatogr. A, 2014, 1362, 34–42 CrossRef CAS PubMed.
- R. D. Rogers and K. R. Seddon, Science, 2003, 302, 792–793 CrossRef PubMed.
- K. D. Clark, M. Sorensen, O. Nacham and J. L. Anderson, RSC Adv., 2016, 6, 39846–39851 RSC.
- M. D. Joshi and J. L. Anderson, RSC Adv., 2012, 2, 5470–5484 RSC.
- Y. Gao, S. W. Arritt, B. Twamley and J. n. M. Shreeve, Inorg. Chem., 2005, 44, 1704–1712 CrossRef CAS PubMed.
- X. Ding, L. Li, Y. Wang, J. Chen, Y. Huang and K. Xu, J. Sep. Sci., 2014, 37, 3539–3547 CrossRef CAS PubMed.
- Q. Zeng, Y. Wang, N. Li, X. Huang, X. Ding, X. Lin, S. Huang and X. Liu, Talanta, 2013, 116, 409–416 CrossRef CAS PubMed.
- X. Ding, Y. Wang, Q. Zeng, J. Chen, Y. Huang and K. Xu, Anal. Chim. Acta, 2014, 815, 22–32 CrossRef CAS PubMed.
- L. Vidal, M. L. Riekkola and A. Canals, Anal. Chim. Acta, 2012, 715, 19–41 CrossRef CAS PubMed.
- E. Wanigasekara, S. Perera, J. A. Crank, L. Sidisky, R. Shirey, A. Berthod and D. W. Armstrong, Anal. Bioanal. Chem., 2010, 396, 511–524 CrossRef CAS PubMed.
- H. Yang, C. Shan, F. Li, D. Han, Q. Zhang and L. Niu, Chem. Commun., 2009, 45, 3880–3882 RSC.
- Y. Huang, Y. Wang, Y. Wang, Q. Pan, X. Ding, K. Xu, N. Li and Q. Wen, RSC Adv., 2016, 6, 5718–5728 RSC.
- A. S. K. Kumar and N. Rajesh, RSC Adv., 2013, 3, 2697–2709 RSC.
- L. Fan, C. Luo, X. Li, F. Lu, H. Qiu and M. Sun, J. Hazard. Mater., 2012, 215, 272–279 CrossRef PubMed.
- N. Li, Y. Wang, K. Xu, Q. Wen, X. Ding, H. Zhang and Q. Yang, RSC Adv., 2016, 6, 84406–84414 RSC.
- X. Ding, Y. Wang, Y. Wang, Q. Pan, J. Chen, Y. Huang and K. Xu, Anal. Chim. Acta, 2015, 861, 36–46 CrossRef CAS PubMed.
- X. Li, J. Zhang and H. Gu, Langmuir, 2011, 27, 6099–6106 CrossRef CAS PubMed.
- X. W. Chen, Q. X. Mao, J. W. Liu and J. H. Wang, Talanta, 2012, 100, 107–112 CrossRef CAS PubMed.
- M. Ghaemi and G. Absalan, Microchim. Acta, 2014, 181, 45–53 CrossRef CAS.
- L. L. Hu, B. Hu, L. M. Shen, D. D. Zhang, X. W. Chen and J. H. Wang, Talanta, 2015, 132, 857–863 CrossRef CAS PubMed.
- K. Köse, Process Biochem., 2016, 51, 1644–1649 CrossRef.
Footnote |
| † Electronic supplementary information (ESI) available. See DOI: 10.1039/c9ra01505a |
|
| This journal is © The Royal Society of Chemistry 2019 |
Click here to see how this site uses Cookies. View our privacy policy here. 
 Open Access Article
 This Open Access Article is licensed under a Creative Commons Attribution-Non Commercial 3.0 Unported Licence
 *,
Xuelian Wang,
Jianzhong Li*,
Huansheng Yang and
Yulong Yin
*,
Xuelian Wang,
Jianzhong Li*,
Huansheng Yang and
Yulong Yin