DOI:
10.1039/C9RA04198B
(Paper)
RSC Adv., 2019,
9, 22883-22890
Heavy metal removal from aqueous systems using hydroxyapatite nanocrystals derived from clam shells
Received
3rd June 2019
, Accepted 18th July 2019
First published on 24th July 2019
Abstract
Hydroxyapatite (HA) was synthesized by wet chemical precipitation, using clam shell (CS) waste as feedstock. SEM and TEM observation of the produced hydroxyapatite revealed the presence of rod-shaped nanocrystals, while XRD and EDS analyses confirmed the characteristic patterns of hydroxyapatite molecules. This material was subsequently employed as a sorbent for heavy metal removal from aqueous solutions, both in batch and column equilibrium procedures. In batch studies, higher sorption efficiencies were obtained at pH 5, with the highest adsorption capacities of 265, 64, and 55 mg g−1 for Pb(II), Cd(II), and Cu(II), respectively. In addition, an adsorption capacity of 42.5 mg g−1 was determined using a CS-HA packed bed column fed with a solution of Pb(II). Finally, the breakthrough curve was fitted with Thomas model in order to predict column behavior and scaling up.
1 Introduction
Safe and clean drinking water is essential for human life. However, its availability is becoming scarce as a consequence of the contamination of clean resources and the effects of global warming.1,2 Water pollution due to the presence of heavy metals represents a serious threat to living organisms and to the environment, since they are toxic, non-degradable, and they tend to bio-accumulate. Lead can severely impact the central nervous, renal, reproductive, hematopoietic and hepatic systems.3 Cooper is toxic at high concentrations, since it could produce cellular and tissue damage leading to Wilson disease in humans.4 Cadmium is an established human carcinogen, which has been associated with the development of prostate, kidney, liver, hematopoietic system and stomach cancer.4 Anthropogenic activities, such as mining and other industrial processes may introduce these contaminants into the water.5 Likewise, natural dissolution of heavy metals is also an important source of contamination, because they are widely distributed in the Earth's surface.6 Thus, the removal of metal ions is paramount to contribute to maintain these contaminants under safe concentrations. Traditional purification technologies include reverse osmosis, ion-exchange, precipitation, membrane technology, and adsorption.7–10 However, adsorption-based technologies have emerged as simple, efficient and economic alternatives.5
The use of mollusk shells to produce low cost sorbents is an attractive approach, especially given its high content of calcium carbonate that makes these waste materials excellent feedstock candidates to produce hydroxyapatite (HA; Ca10(PO4)6(OH)2).11,12 We previously showed that clam shells have higher calcium carbonate content compared with mussel shells and eggshells,11 enabling thus a higher conversion rate into HA. In addition, because synthetic HA is produced through stoichiometric conversion from calcium carbonate, the resulting product is highly pure, with no residual content of reactants or by products.11 By contrast, HA extracted from bones or other natural sources is non-stoichiometric, since it contains trace elements such as Na+, Zn2+, Mg2+, K+, Si2+, Ba2+, F−, and CO32−.12–14 Up to date, synthetic and natural HAs have been reported for different applications including biosorption for removing of heavy metals.15,16 Heavy metal sorption studies have been performed using commercial HA17–22 or HA produced from chemical reagents,23–26 while some studies account for the employment of bio-wastes for HA synthesis and sorption applications, using as raw material Persian Gulf corals,27 eggshell,28–31 bone char,32 mammalian bone meal,25 fish scales33 and microbial precipitated calcite.34 However, only a few studies focus on batch and column equilibrium procedures for heavy metal sorption studies using HA synthetized from biogenic sources. In addition, regeneration studies with synthetic HA, either pure or composites, have shown only slight loss of adsorption efficiency after consecutive adsorption–desorption cycles, proving the material can be reused for long term applications in water treatment.35,36
In the present study, HA was synthesized from clam shells as starting material (CS-HA) using wet chemical precipitation. Material characterization was performed through X-ray diffraction (XRD), transmission electron microscopy (TEM), and scanning electron microscopy (SEM) coupled with energy-dispersive X-ray spectroscopy (EDX). The effect of pH, contact time (kinetic studies), maximum sorption capacity, and selectivity were tested on CS-HA using Pb(II), Cd(II), and Cu(II) solutions in batch procedure. A column equilibrium procedure was also included using a CS-HA packed bed system. The results were fitted using Thomas Model.
2 Experimental
2.1 Production of calcium oxide from clam shells
Clam shells were collected from local markets in the province of Concepción, Chile. The shells were grinded with a laboratory mill (A11 basic Analytical mill, IKA) and sieved using a 100 Mesh stainless steel screen. The fine sieved fraction of the powdered shells was calcined in a furnace (Thermolyne F6010, Thermoscientific), firstly at 550 °C for 1 h and then at 900 °C for 3 h, to remove organic material in the shell and to convert the calcium carbonate content into calcium oxide (CaO). Finally, the calcined powder was triturated in a ceramic mortar.
2.2 Synthesis of nano-hydroxyapatite
CS-HA was prepared by wet chemical precipitation using 100 mL of 0.6 M phosphoric acid (H3PO4 85% p.a.) and 100 mL of 1 M calcium hydroxide (5.6 g of CaO were dissolved in 100 mL of water). The solution of H3PO4 was added to the Ca(OH)2 solution dropwise at a flow rate of 2.5 mL min−1 using a syringe pump. The reaction vessel was stirred at 1500 rpm, maintained at 40 °C and the pH was adjusted to 10 using 1 M NaOH. The final suspension was stirred overnight at room temperature. The obtained precipitate was washed three times with distilled water by consecutive centrifugation (10![[thin space (1/6-em)]](https://www.rsc.org/images/entities/char_2009.gif) 000 rpm). Finally, the resulting precipitate was dried at 40 °C for three days.
000 rpm). Finally, the resulting precipitate was dried at 40 °C for three days.
2.3 Characterization of hydroxyapatite powder
The phase composition of CS-HA was determined by X-ray diffractometry (XRD-Bruker, D4 Endeavor) at 40 kV and 20 mA, using Cu Kα radiation (λ = 1.5406 Å). Diffractograms were recorded in a 2θ range 5–70° (step size 0.02°, step time 141 s). The morphology of CS-HA nanocrystals were examined by scanning electron microscopy (SEM) (ETEC Autoscan) equipped with energy-dispersive X-ray spectroscopy (EDX), and transmission electron microscopy (TEM) (JEOL/JEM 1200 EX II).
2.4 Metal solution preparation and analysis
The solutions were prepared using Cu(NO3)2, Cd(NO3)2, and Pb(NO3)2 standard solutions (Merck Co., Germany). Atomic absorption spectroscopy (AAS) (PinAAcle 900F, PerkinElmer) was used for cation concentration analysis. The flame atomizer was supplied with 2.5 L min−1 of acetylene and 10 L min−1 of air. An electrode discharge lamp (EDL) was used as the radiation source for lead and cadmium, and a cathodic lamp for copper. Detection wavelengths were 324.7 nm for copper, 228.8 nm for cadmium, and 283.3 nm for lead.
2.5 Influence of pH on adsorption
The sorption of Cu(II), Cd(II), and Pb(II) was assessed at pHs 3, 4, and 5. Batch experiments were carried out with 40 mg of CS-HA in 10 mL of metal solution (200 mg L−1) for 24 h at 25 °C and 140 rpm. At the end of the contact time, the sample was centrifuged and metal concentration in the supernatant was measured by AAS. The experiments were carried out in triplicate.
2.6 Influence of contact time on adsorption
The effect of the contact time between the sorbent material and the heavy metal solution was assessed at 10, 20, 40, 60, 80, 120, 180, 360, and 1440 min at 25 °C. For each metal (Cu(II), Cd(II), and Pb(II)), a set of 9 solution flasks were prepared using 40 mg of CS-HA with 10 mL of the corresponding heavy metal ion solution (200 mg L−1). The mixtures were subsequently centrifuged and the supernatants were analyzed for heavy metal content by AAS. The experiments were carried out in triplicate.
2.7 Selectivity study
10 mL of a multicomponent solution containing Cu(II), Cd(II), and Pb(II) at concentration of 200 mg L−1 each metal ion were contacted with 40 mg of CS-HA. After 1 h of contact time the solutions were centrifuged and analyzed by AAS for heavy metal content. The experiments were carried out in triplicate.
2.8 Sorption capacity studies
Sorption capacities for Pb(II), Cd(II), and Cu(II) were determined at pH 5 and 25 °C using solutions prepared at the following concentrations: 100, 200, 300, 400, and 500 mg L−1, for Cd(II) and Cu(II), and 100, 200, 300, 400, 500, 750, 1000, and 2000 mg L−1 for Pb(II). 40 mg of CS-HA were contacted with 10 mL of each solution. The sorption capacity at the equilibrium (qe) was calculated using eqn (1).| |
 | (1) |
where qe is the amount of adsorbed metal per weight of adsorbent material at the equilibrium, expressed in mg g−1. C0 and Ce correspond to the initial concentration and the concentration at the equilibrium (mg L−1), respectively. The volume of the solution is represented by V (L) and the dry weight of the sorbent material is denoted by X (g).
2.9 Column study
The removal of Pb(II) was studied at laboratory-scale using a glass column (1 cm Φ × 0.4 cm height) filled with 0.2 g of CS-HA, according to the experimental setup presented in Fig. 1. The system was operated in up flow mode, by feeding a synthetic solution of Pb(II) prepared at 30 mg L−1 and pH 5 at a constant flow rate of 1.2 mL min−1 using peristaltic pump (120 S, Watson Marlow).
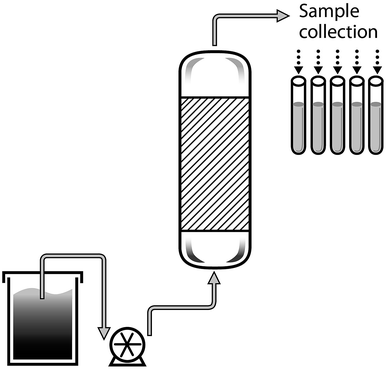 |
| | Fig. 1 Diagram of the packed bed column system. | |
Samples were manually collected every 20 minutes from the outflow. The Pb(II) concentration in the samples was measured by AAS.
3 Results and discussion
3.1 Characterization of the materials
The crystalline structure of synthesized CS-HA was determined from the XRD patterns (see Fig. 2a), confirming the presence of reflections peaks (25.77, 31.87, 33.01, 34.14, 39.98, 46.80, 49.55, and 53.12°) corresponding to its main diffraction planes: (002), (300), (202), (310), (222), (213), and (004).37 The crystalline peaks were identified using the WinXPow software (JCPDS Card No 9-0432). In addition, the size and morphology of synthesized CS-HA was analyzed by electronic microscopy (TEM/SEM), showing the presence of rounded and smooth-surface aggregates composed of rod-like nanocrystals of approximately 80 nm and 20 nm diameter (see Fig. 2b and d). Finally, the elemental composition of CS-HA determined from the EDS spectra confirmed the presence of Ca, O, and P, in agreement with the result of XRD (see Fig. 2c).
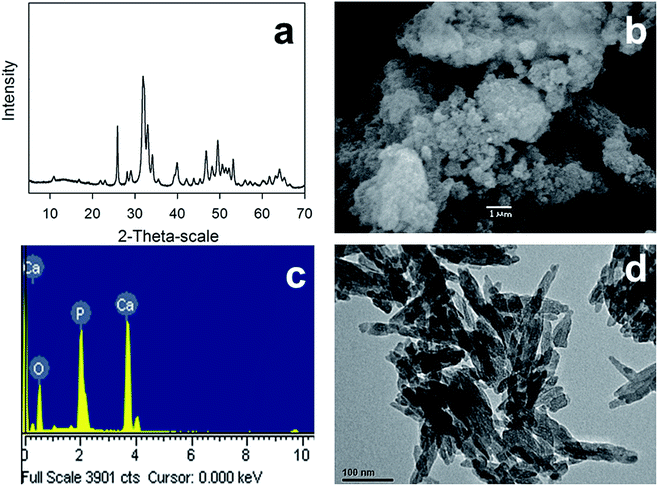 |
| | Fig. 2 Hydroxyapatite nanoparticles characterization using (a) XRD, (b) SEM, (c) EDX, and (d) TEM. | |
3.2 Influence of pH on adsorption
Fig. 3 shows the sorption efficiencies of CS-HA for Cu(II), Cd(II), and Pb(II) at pH 3, 4, and 5 and initial concentration of 200 mg L−1. Higher sorption efficiencies were obtained at pH 5 for Cu(II), Cd(II), while for Pb(II) the sorption efficiency remained over 99% for the three pH conditions tested. At pH 5 the sorption efficiencies were 96.8 ± 0.3 and 96.1 ± 0.6% for Cd(II) and Cu(II), respectively. However, at pH 4 the sorption efficiencies for these metals slightly dropped to 94.5 ± 0.7 and 95.6 ± 0.6%, respectively. At pH 3, the sorption efficiencies also fell to 93.1 ± 1.5 and 93.9 ± 0.6%, respectively. Therefore, given the detrimental effect on the sorption efficiency observed at pH 3 and 4, the pH selected was 5 for the rest of the experiments.
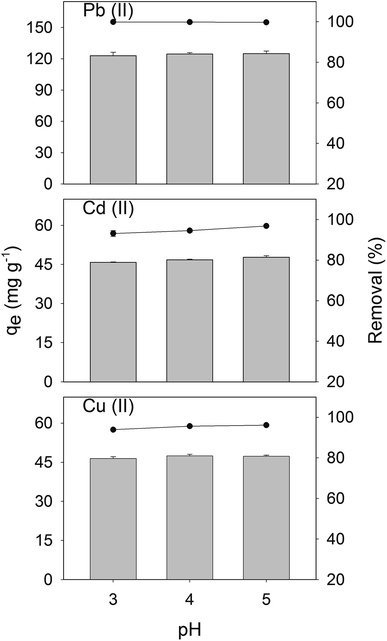 |
| | Fig. 3 Sorption studies of CS-HA for Cu(II), Cd(II), and Pb(II) at pH 3, 4, and 5, with an initial metal concentration of 200 mg L−1. Error bars indicate the standard deviation of triplicate. | |
3.3 Effect of contact time on adsorption
Sorption curves demonstrate that Pb(II) reached 99.0 ± 1.0% of efficiency at the first 10 min and complete removal was achieved after 20 min of contact time (see Fig. 4). For Cu(II) and Cd(II) the sorption efficiencies were, respectively, 65.8 ± 0.4 and 81.3 ± 0.1% respectively at the first 10 min of contact and continued to increase up to 80.9 ± 0.1 and 92.0 ± 0.2% at 60 min of contact time. The highest efficiencies were obtained after 24 h, reaching 93% for Cu(II) and Cd(II). The contact time selected for the experiments was 60 min, since the removal capacity obtained at this time was over 90% of the maximum capacity obtained at 24 h of contact time.
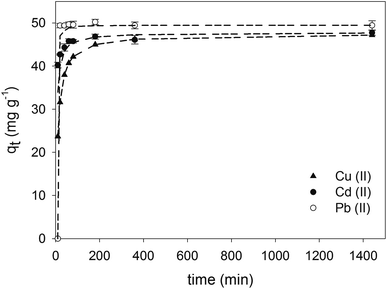 |
| | Fig. 4 Sorption capacities of CS-HA using single metal solutions of Cu(II), Cd(II), and Pb(II) for 10, 20, 40, 60, 80, 180, 360 min, and 24 h of contact time. Error bars correspond to the standard deviation of triplicate. Short dashed line indicates fitting to pseudo second-order kinetics. | |
3.4 Selectivity study
The selectivity of metal removal was studied using a multicomponent solution containing Cu(II), Cd(II), and Pb(II) at a concentration of 200 mg L−1 for each ion (see Fig. 5). The removal efficiency of Pb(II) was not affected by the presence of the other metal ions, reaching nearly complete removal under this condition. However, a detrimental effect on the sorption capacity was observed for Cd(II) and Cu(II) in the presence of other metal ions, which results consistent with other works showing a competitive effect among certain metal ions.21 By contrast, the favorable sorption of Pb(II) can been attributed to its high electronegativity (2.33, Pauling) and ionic radius (1.19 Å), which is in the range of Ca(II) ionic radius (0.99 Å),38 this phenomenon has been associated with a high sorption selectivity for HA.22,39 The electronegativity of Cu(II), and Cd(II) are 1.9 and 1.69 (Pauling), and their ionic radius are 0.73 Å and 0.97 Å,38 respectively.
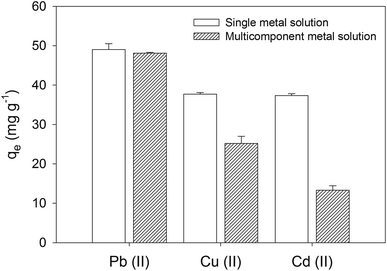 |
| | Fig. 5 Sorption efficiencies and capacities obtained with multi-element solution containing Cu(II), Cd(II), and Pb(II). Error bars correspond to the standard deviation of triplicate. | |
3.5 Sorption capacity studies at different initial concentrations
Pb(II) sorption capacities were higher than those of Cu(II) and Cd(II) in the concentration range investigated (see Fig. 6). This result is consistent with previous reports using pure HA synthesized by wet chemical precipitation.22,25 The sorption capacities of Cu(II) and Cd(II) were similar, which could account for the lower electronegativity of Cd(II) but higher ionic radius. The highest sorption capacities were 265, 64 and 55 mg g−1, for Pb(II), Cd(II), and Cu(II), respectively.
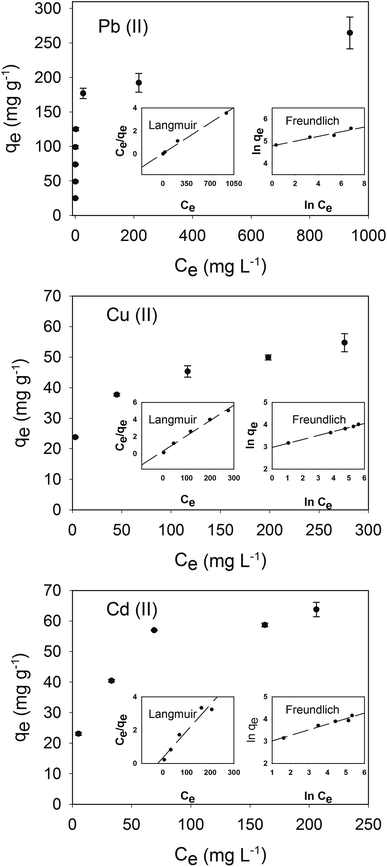 |
| | Fig. 6 Sorption capacities of Pb(II), Cu(II), and Cd(II). Error bars correspond to the standard deviation of triplicate. Langmuir and Freundlich isotherms are presented inside main graph for each metal. | |
3.6 Adsorption kinetics
The adsorption mechanisms of CS-HA were studied employing pseudo-first-order and pseudo-second-order kinetic methods. Lagergren pseudo-first-order equation is written as:| |
ln(qe − qt) = ln![[thin space (1/6-em)]](https://www.rsc.org/images/entities/char_2009.gif) qe − k1t qe − k1t
| (2) |
Ho pseudo-second-order equation is written as:
| |
 | (3) |
where
qe (mg g
−1) and
qt (mg g
−1) are the removal capacity of pollutants at equilibrium and at time
t (min) respectively.
k1 (min
−1) and
k2 (g mg
−1 min
−1) are the velocity constant of first-order kinetics and second-order, respectively. The Lagergren's
k1 and
qe constants are calculated from plotting ln(
qe −
qt)
versus t, while
k2 and
qe are calculated from plotting
t/
qt versus t.
The pseudo-second-order kinetics is the best fitting model (see Fig. 6; Table 1), indicating that the rate limiting step describing the adsorption process may be chemisorption rather than physical sorption.40 The correlation factor (R2) for the pseudo-first order kinetics for the adsorption of Pb(II), Cd(II), and Cu(II) were lower than that obtained for the pseudo-second order kinetics, 0.42, 0.92, 0.96 respectively (data not shown). Differences between the theoretical capacity at the equilibrium and experimental values are marginal using pseudo-second-order kinetics.
Table 1 Pseudo-second-order kinetics parameters for the sorption of Pb(II), Cd(II), and Cu(II)
| |
qe experimental (mg g−1) |
qe calculated (mg g−1) |
k2 (g mg−1 min−1) |
R2 |
| Pb(II) |
49.4 |
49.5 |
0.03781 |
1 |
| Cd(II) |
47.7 |
47.8 |
0.00513 |
0.9999 |
| Cu(II) |
47.2 |
47.5 |
0.00209 |
0.9999 |
3.7 Adsorption isotherms
The distribution of metal ions between liquid and solid phases can be described by Langmuir and Freundlich isotherm models. Experimental data was fitted using linear regressions to determine the best fit to these isotherms (see Fig. 6).
The Langmuir adsorption isotherm quantitatively describes the deposition of a large layer of molecules on an adsorbent surface as a function of the concentration of the adsorbed material in the liquid with which it is in contact.41 The Langmuir isotherm is described by the equation:
| |
 | (4) |
The Freundlich isotherm is represented by the equation:
| |
 | (5) |
where
qe is the amount of the adsorbate on the surface of the adsorbent at the equilibrium (mg g
−1),
Ce is the equilibrium concentration of the adsorbate in solution (mg L
−1),
qm is the maximum adsorption capacity (mg g
−1), and
kL is the Langmuir adsorption constant (L mg
−1) related to the affinity of the binding sites and also indicates the binding energy of the adsorption reaction between adsorbate and adsorbent.
kF is the Freundlich adsorption constant ((mg g
−1) (mg L
−1)
−n), which is a relative indicator of adsorption capacity and
n represents the intensity of the reaction and indicating the favorability and capacity of the adsorbent/adsorbate system.
kL and
qm are calculated by plotting
Ce/
qe versus Ce for the Langmuir isotherm. Thus,
kF and
n are calculated by plotting ln(
qe)
versus ln(
Ce) for the Freundlich isotherm.
The Langmuir model showed better fitting than the Freundlich model (see Table 2 and Table 3). The Langmuir constant accounts for better adsorption affinity of CS-HA for Pb(II), than that for Cd(II) and Cu(II), while affinities for Cd(II) and Cu(II) were similar. In addition, differences between the maximal theoretical adsorption capacity and the highest adsorption capacity experimentally determined are minimal.
Table 2 Langmuir parameters for the sorption of Pb(II), Cd(II), and Cu(II) on CS-HA
| |
q experimental (mg g−1) |
qm (mg g−1) |
kL (L mg−1) |
R2 |
| Pb(II) |
265 |
263.2 |
0.089 |
0.99 |
| Cd(II) |
64 |
62.5 |
0.058 |
0.97 |
| Cu(II) |
55 |
55.9 |
0.060 |
0.99 |
Table 3 Freundlich parameters for the sorption of Pb(II), Cd(II), and Cu(II) on CS-HA
| |
n |
KF (mg g−1) (mg L−1)−n |
R2 |
| Pb(II) |
0.11 |
3.6 × 10⁻¹⁹ |
0.95 |
| Cd(II) |
4.01 |
15.86 |
0.96 |
| Cu(II) |
5.59 |
19.48 |
0.99 |
The highest sorption capacity for Cd(II) obtained herein is similar to that reported by Smiciklas et al.,22 Cheung et al.32 and Xu et al.17 using chemically produced HA, bone char and commercial HA, respectively (see Table 4). However, this value is lower than the sorption capacities obtained by Dybowska et al.25 and Corami et al.,21 using chemically produced HA and commercial HA, respectively. In terms of Cu(II) sorption, the capacities obtained in our study are higher than those obtained by Smiciklas et al.,22 Xu et al.,17 Corami et al.21 and Wang et al.,26 but lower than sorption capacities reported by Dybowska et al.25 Finally, the Pb(II) maximal removal capacity experimentally determined in this study with CS-HA was 2-3 times lower than the values reported by Smiciklas et al.,22 Dybowska et al.25 and Ibrahim et al.28 (see Table 4).
Table 4 Cu(II), Cd(II), and Pb(II) sorption capacities obtained from different sources of HA
| Cu(II) (mg g−1) |
Cd(II) (mg g−1) |
Pb(II) (mg g−1) |
HA source |
Ref. |
| |
68 |
676 |
Chemical wet precipitation, Ca(OH)2–H3PO4 |
22 |
| 470 |
151 |
563 |
Chemical wet precipitation, Ca(CH3COO)2–(NH4)2HPO4 |
25 |
| |
64 |
|
Bone char |
32 |
| |
68 |
|
Commercial |
17 |
| 49 |
|
|
Commercial |
20 |
| |
189 |
|
Commercial |
21 |
| 27 |
|
|
Wet chemical precipitation, Ca(NO3)2 H3PO4 |
26 |
| |
|
1001 |
Wet chemical precipitation, eggshells H3PO4 |
28 |
| 55 |
64 |
265 |
Wet chemical precipitation, clam shells H3PO4 |
This study |
3.8 Column studies
The behavior of the adsorption column packed with CS-HA was studied for 400 min using a solution of Pb(II) prepared at 30 mg L−1 and pH 5. The breakthrough curve plotted in Fig. 7 shows the outflow concentration of the metal that increases constantly until around 60% of the initial concentration, after which it starts to decline at about 280 min of operation.
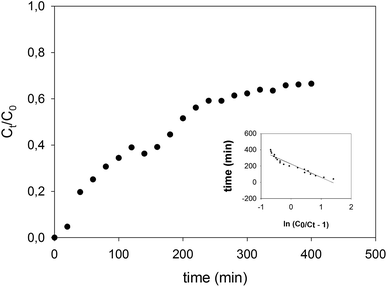 |
| | Fig. 7 Breaking through curve of the CS-HA packed bed column operated at 1.3 mL min−1, using a solution of 30 mg L−1 of Pb(II) at pH 5. Inside graph indicates fitting to Thomas model (R2 = 0.92). | |
The adsorption capacity of the column was calculated according to the eqn (6) and (7), and the efficiency of the column was calculated using eqn (8).
| |
 | (6) |
| |
 | (7) |
| |
 | (8) |
where, the total amount of the adsorbed metal is expressed as
qtotal (mg), the total amount of the adsorbed metal per amount of adsorbent material is indicated by
qeq (mg g
−1), and
C0 is the initial concentration,
Q is the operational flow,
Ct is the concentration at time
t, and
X is the amount of the CS-HA loaded into the column (g).
The adsorption capacity reached a value of 42.5 mg g−1 during the total time of operation of the CS-HA packed bed column (see Table 5).This capacity is lower than the value calculated in batch experiments, since the contact time between the liquid and solid phase in the column is significantly lower (empty bed residence time = 1 min) than the contact time employed in batch mode (60 min). The column removal efficiency determined from eqn (8) was 52.6% of the total amount of metal ion fed in the solution.
Table 5 Operational parameters of Pb(II) adsorption in a column system packed with CS-HA
| Total volume fed (mL) |
Adsorption capacity (mg g−1) |
Column efficiency (%) |
| 993 |
42.5 |
52.6 |
Experimental data was fitted to the Thomas model, which is used to predict column performance under different operational conditions. The Thomas model equation42 is described in eqn (9).
| |
 | (9) |
where
Ct (mg L
−1) is the outlet concentration at the time
t,
C0 (mg L
−1) is the inlet concentration,
Kth (mL h
−1 mg
−1) is the Thomas adsorption constant,
qm (mg g
−1) is the maximum equilibrium capacity of the adsorbent,
X (g) is the mass of the adsorbent packed in the column, and
Q (mL min
−1) is the operational flow.
The Thomas model showed good linear relation for Pb(II) for the packed bed column system (R2 = 0.92, Kth = 1.9 × 10⁻⁴). This model considers that the sorption process is controlled by the mass transfer at the interface; it allows the scaling up of the process by predicting the column behavior.
4 Conclusion
HA nanocrystals produced from clam shells as starting material showed excellent sorption capacities to remove Pb(II), Cu(II) and Cd(II) from aqueous solution. The experiment carried out in column equilibrium procedure showed good performance, reaching up to 42.5 mg g−1 of removal capacity in shorter residence time when compared with batch experiments. Additionally, Thomas model showed good fitting to the experimental data and, therefore, could be used to predict column behavior and scaling up the adsorption process.
Conflicts of interest
The authors declare no conflicts of interest.
Acknowledgements
The present research was funded by the National Commission of Scientific Research and Technology (CONICYT, Chile): PAI Grant No 7815020005, FONDECYT Grant No 1150510 and CONICYT Regional Grant No R16F10013. The authors also acknowledge the scholarship given to Aritz Mancisidor and Jon Ander Serrano by the Global Training Internationalization Program from the Basque Government (Spain); and CIPA, CONICYT Regional, GORE BIO BIO, R17A10003.
References
- M. A. Shannon, P. W. Bohn, M. Elimelech, J. G. Georgiadis, B. J. Mariñas and A. M. Mayes, Nature, 2008, 452, 301–310 CrossRef CAS PubMed.
- P. K. Samantaray, S. Baloda, G. Madras and S. Bose, J. Mater. Chem. A, 2018, 6, 16664–16679 RSC.
- G. Flora, D. Gupta and A. Tiwari, Interdiscip. Toxicol., 2012, 5, 47–58 CAS.
- P. B. Tchounwou, C. G. Yedjou, A. K. Patlolla and D. J. Sutton, Exper. Suppl., 2012, 101, 133–164 Search PubMed.
- F. L. Fu and Q. Wang, J. Environ. Manage., 2011, 92, 407–418 CrossRef CAS PubMed.
- J. G. Dean and F. L. Bosqui, Environ. Sci. Technol., 1972, 6, 518–522 CrossRef CAS.
- D. Prabhakaran and M. S. Subramanian, Talanta, 2003, 59, 1227–1236 CrossRef CAS PubMed.
- M. M. Jadhao, L. J. Paliwal and N. S. Bhave, Desalination, 2009, 247, 456–465 CrossRef CAS.
- B. L. Rivas and I. Moreno-Villoslada, J. Appl. Polym. Sci., 1998, 69, 817–824 CrossRef CAS.
- B. L. Rivas, L. N. Schiappacasse, U. E. Pereira and I. Moreno-Villoslada, Polymer, 2004, 45, 1771–1775 CrossRef CAS.
- D. Nunez, E. Elgueta, K. Varaprasad and P. Oyarzun, Mater. Lett., 2018, 230, 64–68 CrossRef CAS.
- M. Akram, R. Ahmed, I. Shakir, W. A. W. Ibrahim and R. Hussain, J. Mater. Sci., 2014, 49, 1461–1475 CrossRef CAS.
- D. Milovac, G. Gallego Ferrer, M. Ivankovic and H. Ivankovic, Mater. Sci. Eng. C Mater. Biol. Appl., 2014, 34, 437–445 CrossRef CAS PubMed.
- N. A. S. Mohd Pu'ad, P. Koshy, H. Z. Abdullah, M. I. Idris and T. C. Lee, Heliyon, 2019, 5, e01588 CrossRef PubMed.
- D. Prema, S. Gnanavel, S. Anuraj and C. Gopalakrishnan, Mater. Today: Proc., 2018, 5, 8868–8874 CAS.
- F. Ye, H. Guo, H. Zhang and X. He, Acta Biomater., 2010, 6, 2212–2218 CrossRef CAS PubMed.
- Y. P. Xu, F. W. Schwartz and S. J. Traina, Environ. Sci. Technol., 1994, 28, 1472–1480 CrossRef CAS PubMed.
- J. A. Gomez del Rio, P. J. Morando and D. S. Cicerone, J. Environ. Manage., 2004, 71, 169–177 CrossRef CAS PubMed.
- I. Smiciklas, S. Dimovic, I. Plecas and M. Mitric, Water Res., 2006, 40, 2267–2274 CrossRef CAS PubMed.
- A. Corami, S. Mignardi and V. Ferrini, J. Hazard. Mater., 2007, 146, 164–170 CrossRef CAS PubMed.
- A. Corami, S. Mignardi and V. Ferrini, J. Colloid Interface Sci., 2008, 317, 402–408 CrossRef CAS PubMed.
- I. Smiciklas, A. Onjia, S. Raicevic, D. Janackovic and M. Mitric, J. Hazard. Mater., 2008, 152, 876–884 CrossRef CAS PubMed.
- D. Gogoi, A. G. Shanmugamani, S. V. S. Rao, T. Kumar and S. Velmurugan, Desalin. Water Treat., 2015, 57, 6566–6574 CrossRef.
- V. N. Narwade, M. P. Mahabole, A. K. Bogle and R. S. Khairnar, Int. J. Innov. Sci. Mod. Eng., 2014, 3, 324–329 Search PubMed.
- A. Dybowska, D. A. C. Manning, M. J. Collins, T. Wess, S. Woodgate and E. Valsami-Jones, Sci. Total Environ., 2009, 407, 2953–2965 CrossRef CAS PubMed.
- Y. J. Wang, J. H. Chen, Y. X. Cui, S. Q. Wang and D. M. Zhou, J. Hazard. Mater., 2009, 162, 1135–1140 CrossRef CAS PubMed.
- S. Zamani, E. Salahi and I. Mobasherpour, Can. Chem. Trans., 2013, 1, 173–190 CrossRef CAS.
- A. R. Ibrahim, Y. L. Zhou, X. Y. Li, L. Chen, Y. Z. Hong, Y. Z. Su, H. T. Wang and J. Li, Mater. Res. Bull., 2015, 62, 132–141 CrossRef CAS.
- S. Meski, S. Ziani and H. Khireddine, J. Chem. Eng. Data, 2010, 55, 3923–3928 CrossRef CAS.
- D. X. Liao, W. Zheng, X. M. Li, Q. Yang, X. Yue, L. Guo and G. M. Zeng, J. Hazard. Mater., 2010, 177, 126–130 CrossRef CAS PubMed.
- W. Zheng, X.-m. Li, Q. Yang, G.-m. Zeng, X.-x. Shen, Y. Zhang and J.-j. Liu, J. Hazard. Mater., 2007, 147, 534–539 CrossRef CAS PubMed.
- C. W. Cheung, J. F. Porter and G. McKay, Water Res., 2001, 35, 605–612 CrossRef CAS PubMed.
- S. Kongsri, K. Janpradit, K. Buapa, S. Techawongstien and S. Chanthai, J. Chem. Eng., 2013, 215, 522–532 CrossRef.
- M. Wang, S. Wu, J. Guo, X. Zhang, Y. Yang, F. Chen and R. Zhu, J. Hazard. Mater., 2018, 366, 684–693 CrossRef PubMed.
- W. Wei, L. Yang, W. H. Zhong, S. Y. Li, J. CUI and Z. G. Wei, Dig. J. Nanomater. Bios., 2015, 10, 1343–1363 Search PubMed.
- A. Ansari, S. Vahedi, O. Tavakoli, M. Khoobi and M. A. Faramarzi, Appl. Organomet. Chem., 2019, 33, e4634 CrossRef.
- Z. Chen, Y. Liu, L. Mao, L. Gong, W. Sun and L. Feng, Ceram. Int., 2018, 44, 6002–6009 CrossRef CAS.
- Periodic Table of Elements Sorted by Electronegativity (Pauling), http://EnvironmentalChemistry.com/yogi/periodic/electronegativity.html, (accesed June 2 2018).
- T. Suzuki, T. Hatsushika and M. Miyake, J. Chem. Soc., Faraday Trans. 1, 1982, 78, 3605–3611 RSC.
- Y. S. Ho, J. C. Y. Ng and G. McKay, Sep. Sci. Technol., 2001, 36, 241–261 CrossRef CAS.
- K. Y. Foo and B. H. Hameed, Chem. Eng. J., 2010, 156, 2–10 CrossRef CAS.
- H. T. Van, L. H. Nguyen, V. D. Nguyen, X. H. Nguyen, T. H. Nguyen, T. V. Nguyen, S. Vigneswaran, J. Rinklebe and H. N. Tran, J. Environ. Manage., 2018, 241, 535–548 CrossRef PubMed.
|
| This journal is © The Royal Society of Chemistry 2019 |
Click here to see how this site uses Cookies. View our privacy policy here.  Open Access Article
 *a,
Jon Ander Serranoa,
Aritz Mancisidora,
Elizabeth Elguetaa,
Kokkarachedu Varaprasad
 a,
Patricio Oyarzúnb,
Rodrigo Cáceresa,
Walther Idea and
Bernabé L. Rivasc
![[thin space (1/6-em)]](https://www.rsc.org/images/entities/char_2009.gif) 000 rpm). Finally, the resulting precipitate was dried at 40 °C for three days.
000 rpm). Finally, the resulting precipitate was dried at 40 °C for three days.


![[thin space (1/6-em)]](https://www.rsc.org/images/entities/char_2009.gif) qe − k1t
qe − k1t


