 Open Access Article
Insights into the interaction of potent antimicrobial chalcone triazole analogs with human serum albumin: spectroscopy and molecular docking approaches
Priyanka
Yadav
 a,
Jitendra Kumar
Yadav
b,
Alka
Agarwal
*b and
Satish K.
Awasthi
 *a
*a
aChemical Biology Laboratory, University of Delhi, Delhi-110007, India. E-mail: satishpna@gmail.com
bDepartment of Medicinal Chemistry, Institute of Medical Sciences, Banaras Hindu University, Varanasi-221005, UP, India. E-mail: agarwal.dralka@gmail.com
First published on 8th October 2019
Abstract
Mechanistic insights into the interaction of five previously chemically synthesized triazole-linked chalcone analogs (CTs) with human serum albumin (HSA) were sought using various spectroscopic techniques (UV-visible absorption, fluorescence, and circular dichroism) and molecular docking. The fluorescence quenching experiments performed at three different temperatures (288, 298 and 308 K) revealed the static mode of quenching and the binding constants (Kb ∼ 106–9) obtained indicated the strong affinity of these analogs for HSA. Furthermore, significant changes in the secondary structure of HSA in the presence of these analogs were also confirmed by far UV-CD spectroscopy. The thermodynamic properties such as the enthalpy change (ΔH°), Gibbs free energy change (ΔG°) and entropy change (ΔS°) revealed that the binding process was spontaneous and exothermic. Theoretical studies, viz., DFT and molecular docking corroborated the experimental results as these five analogs could bind with HSA through hydrogen bonding and hydrophobic interactions. The present study provides useful information regarding the interaction mechanism of these analogs with HSA, which can provide a new avenue to design more potent chalcone triazole analogs for use in the biomedical field.
Introduction
Human serum albumin (HSA) being the most abundant protein in blood plasma behaves as an important factor for the transportation and homing of drugs to the target molecules.1 HSA is a globular monomeric, hydrophilic, and non-glycosylated protein, accounting for 60% of total plasma proteins; it is composed of three structurally similar domains (I, II, and III). Each domain is further divided into two subdomains (A and B) with numerous requisite ligands.2 After the entry of a drug into systemic circulation, it is exposed to serum albumin, leading to the division of the drug into two types: free drug and drug–HSA complexes. This drug–HSA complex formed provides the supply of free drug and extends the duration of the drug's action.3 This binding of the drug to HSA influences the pharmacokinetic properties of the drug such as half-life, solubility, metabolism and distribution. This binding also affects its efficacy, stability, toxicity and delivery.4 Thus, the study of the mechanism of the interaction between a drug and serum albumin is crucial to evaluate the transportation and distribution of the drug in the body.3Organic compounds containing chalcone and flavone scaffolds are of interest to both synthetic and medicinal chemists. These compounds are the precursors for numerous synthetic and naturally available heterocycles such as isoxazolines, pyrazolines, pyrimidines, quinoxalines, aurones, benzalcoumaranones and anthocyanins.5 In chalcones, two aromatic rings are fused together through a three-carbon α,β-unsaturated carbonyl system.6 Chalcones and flavones containing various functional groups possess a wide range of biological and pharmacological activities such as antitumor,7 antitubercular,8 antiviral,9 antiplatelet,10 antifungal,11 and cytotoxic12 properties as well as enzyme inhibition.13
1,2,3-Triazoles are nitrogen-rich five-membered heterocycles and are preferred as structural components in various biologically active molecules due to their chemotherapeutic value.14 These compounds have attracted interest from the scientific community all over the world owing to their various biological activities such as antiviral,15 antimicrobial,16 antimalarial,17 antitubercular,18 and anti-HIV properties.19 In the last few years, 1,2,3-triazoles have received particular consideration in drug discovery as a large number of drug molecules are included in this group such as tazobactam, cefatrizine, carboxyamidotriazole, and rufinamide, which are used for the treatment of bacterial diseases and cancer. Our group has synthesized chalcone and flavone triazole hybrids for obtaining potent antibacterial and antifungal lead compounds.20
To extend our research, we chose 5 compounds (Fig. 1) showing the best antimicrobial activity from the pool of 25 compounds and studied their interaction with human serum albumin using various spectroscopic techniques such as UV-vis, fluorescence and circular dichroism spectroscopies. The experimental data were validated by theoretical studies such as molecular docking methods. This study may provide beneficial information regarding the biological and therapeutic effects of chalcones and flavones in pharmacology and pharmacodynamics.
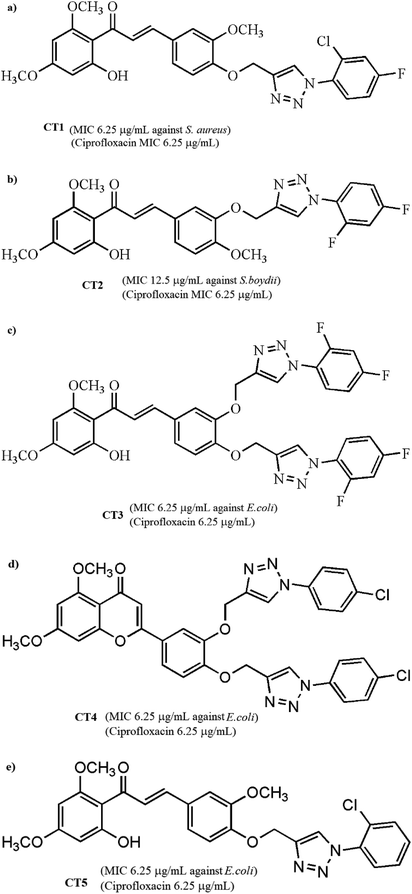 | ||
| Fig. 1 Chemical structures of five pharmacologically important chalcone-triazole analogs: (a) CT1, (b) CT2, (c) CT3, (d) CT4 and (e) CT5. | ||
Materials and methods
Materials
All the materials and chemicals used during the experiments were of analytical grade. HSA was purchased from Sigma Aldrich, India. The stock solution of HSA (15 μM) was prepared in phosphate buffered solution (10 mM, pH 7.4) and kept in the dark at 2–6 °C. The concentration of HSA was estimated spectrophotometrically using E1%280 nm = 5.3.21 Double distilled water was used in all the experiments.UV-visible absorption spectrum experiments
At room temperature, UV-visible absorption spectra were recorded on a double slit UV-visible spectrophotometer (JASCO V-670) by using a quartz cuvette with the dimensions of 1.0 × 1.0 cm. The HSA concentration was kept constant at 15 μM while varying the ligand concentration from 0 to 60 μM throughout the experiment.21bFluorescence spectroscopy experiments
A Varian Cary Eclipse spectrophotometer was used to record fluorescence spectra using a 1.0 cm quartz cuvette within the range of 290–500 nm. The excitation wavelength was kept at 280 nm. The slit width was kept at 5 nm for both excitation and emission. The scanning speed was set to 200 nm min−1. For the removal of the inner-filter effect, the fluorescence intensity data were corrected by the following equation:22| Fcorr = FobsXe(Aex+Aem)/2 |
![[thin space (1/6-em)]](https://www.rsc.org/images/entities/char_2009.gif) :
:![[thin space (1/6-em)]](https://www.rsc.org/images/entities/char_2009.gif) 1 to 10
1 to 10![[thin space (1/6-em)]](https://www.rsc.org/images/entities/char_2009.gif) :
:![[thin space (1/6-em)]](https://www.rsc.org/images/entities/char_2009.gif) 1.
1.
To elucidate the binding forces, thermodynamic parameters and quenching mechanism, quenching experiments were carried out at three different temperatures, i.e., at 288, 298 and 308 K.
Circular dichroism spectroscopy
An automatic recording circular dichroism (CD) spectrometer (JASCO-810) equipped with a thermostated cell holder at 20 °C was employed using a quartz cell of 10 mm path length and 200–300 nm spectral range. Nitrogen was continuously fluxed into spectropolarimeter for absorbing the moisture before and during the experiment. Each spectrum was obtained after correction with a baseline, and the scan speed was kept at 100 nm min−1 with 1 s response time.21b,23 The average of three accumulations was used for the final spectra.Computational studies
Docking was performed using the PatchDock server and Hex 8.0.0 Cuda.24 The 3D crystal structure of HSA (PDB ID: 1BM0, 2.5 Å resolution) was obtained from the Protein Data Bank.25 All water and ligand molecules were removed from the crystal structure for docking analysis, and the atomic coordinates of chain A of the crystal structure were stored in a separate file and were used as the input for molecular docking. The 3D crystal structure of HSA was predicted by homology modelling and validated thorough RAMPAGE and PDBSum server. Active binding sites of HSA were recognised using the MetaPocket server. The structures of CTs were designed using ChemDraw Ultra 7.0; the geometries and energies were optimized using Gaussian09W software and then converted in PDB format using Discovery Studio 3.0. The docking complexes of CT–HSA were visualized by Discovery Studio 3.0 and Ligplot+ software.Results and discussion
UV-vis absorbance
UV-visible absorption spectroscopy is a widely employed technique to detect the conformational changes occurring due to drug–protein interactions.26 HSA exhibited an absorption peak at 280 nm due to the π–π* transitions of Trp, Tyr and Phe amino acids.27 The interaction of CTs and HSA was evaluated by recording the spectra of the protein in the absence and presence of various concentrations of CTs. The incremental change in the absorption spectra (Fig. 2) in all cases suggested ground state stable complex formation between HSA and CTs.28 Furthermore, it was confirmed that quenching is static as dynamic quenching had no effect on the absorption spectra.25b In the absorption spectra, blue shifts in case of CT1 and CT5 were observed, suggesting that their binding to HSA led to some changes in the dielectric environments of the residues of the proteins.29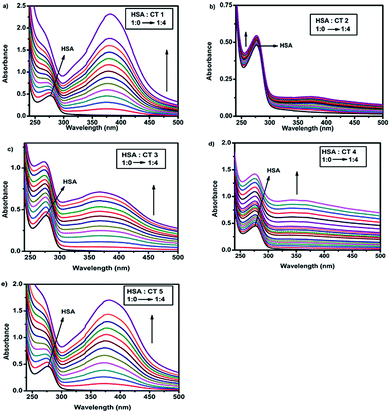 | ||
| Fig. 2 UV absorbance of HSA (15 μM) with varying concentrations (0–60 μM) of (a) CT1, (b) CT2, (c) CT3, (d) CT4 and (e) CT5 (T = 298 K, pH = 7.4). | ||
Analysis of fluorescence quenching
Fluorescence spectroscopy is a simple, sensitive and frequently used technique to provide insights into the binding mode and the mechanism of the binding of a protein with various small molecules.30 HSA has unique intrinsic fluorescence properties due to the presence of three amino acids, i.e., Trp, Tyr and Phe having a relative fluorescence intensity ratio of 100![[thin space (1/6-em)]](https://www.rsc.org/images/entities/char_2009.gif) :
:![[thin space (1/6-em)]](https://www.rsc.org/images/entities/char_2009.gif) 9
9![[thin space (1/6-em)]](https://www.rsc.org/images/entities/char_2009.gif) :
:![[thin space (1/6-em)]](https://www.rsc.org/images/entities/char_2009.gif) 0.31 The quenching experiment was performed by fixing the excitation wavelength at 280 nm.32 It was observed that the gradual addition of CTs to HSA led to a decrease in its emission signal at 340 nm, suggesting that a Trp residue in the protein is situated at or nearby the ligand binding site.33 The impact of the different concentrations of CTs on the emission spectra of HSA is shown in Fig. 3. This decrease in intensity implied that the binding of CTs to HSA occurred and was concentration-dependent.34
0.31 The quenching experiment was performed by fixing the excitation wavelength at 280 nm.32 It was observed that the gradual addition of CTs to HSA led to a decrease in its emission signal at 340 nm, suggesting that a Trp residue in the protein is situated at or nearby the ligand binding site.33 The impact of the different concentrations of CTs on the emission spectra of HSA is shown in Fig. 3. This decrease in intensity implied that the binding of CTs to HSA occurred and was concentration-dependent.34
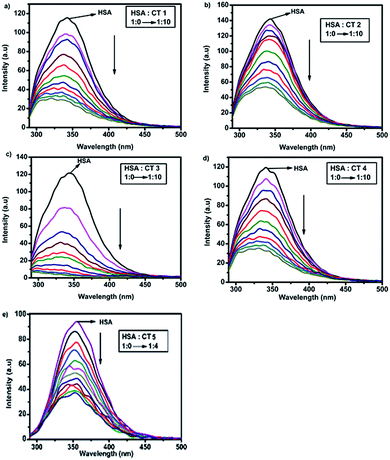 | ||
Fig. 3 Fluorescence spectra of HSA (15 μM) in the presence of different concentrations of CTs (a) CT1, (b) CT2, (c) CT3, (d) CT4 and (e) CT5 (HSA![[thin space (1/6-em)]](https://www.rsc.org/images/entities/char_2009.gif) : :![[thin space (1/6-em)]](https://www.rsc.org/images/entities/char_2009.gif) CT ratio = 1 CT ratio = 1![[thin space (1/6-em)]](https://www.rsc.org/images/entities/char_2009.gif) : :![[thin space (1/6-em)]](https://www.rsc.org/images/entities/char_2009.gif) 0 → 1 0 → 1![[thin space (1/6-em)]](https://www.rsc.org/images/entities/char_2009.gif) : :![[thin space (1/6-em)]](https://www.rsc.org/images/entities/char_2009.gif) 10) excited at 280 nm at 288 K. 10) excited at 280 nm at 288 K. | ||
The blue shift in λmax in the fluorescence emission maximum was due to the changes in the polarity around the chromophore. This shift indicates that amino acid residues are located in a more hydrophobic environment and are less exposed to the solvent.35 The fluorescence spectra were recorded at three temperatures (288, 298 and 308 K) in order to determine the mechanism of quenching. The fluorescence quenching data were evaluated using the Stern–Volmer equation:
The Stern–Volmer plots of the titrations of HSA with CTs are depicted in Fig. 4.
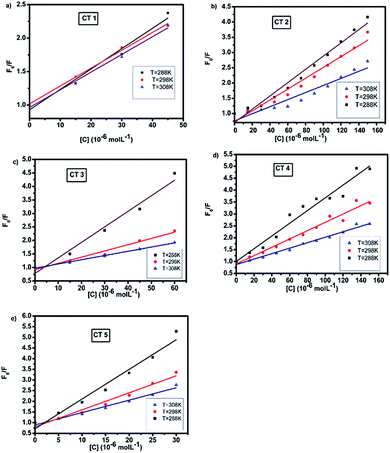 | ||
| Fig. 4 Stern–Volmer plots of the fluorescence quenching of HSA with CTs at 288, 298 and 308 K (λex = 280 nm, pH = 7.4). | ||
At all three temperatures, a good linear relationship was found, as shown in Fig. 4. It was observed that the quenching constant decreased with the rise in temperature, indicating the static mode of quenching.38 The kq values were calculated assuming the τo value to be 10−8 s. Furthermore, the value of the quenching rate constant at all the temperatures was found to be much greater than the maximum diffusion rate constant of a biomolecule, i.e., 2 × 10¹⁰ M s−1 (Table 1), suggesting that the fluorescence quenching of HSA by CTs led to the formation of a static complex.26
| HSA | |||||||
|---|---|---|---|---|---|---|---|
| pH = 7.4 | K SV × 104 (L mol−1) | k q × 1012 (L mol−1 s−1) | K b (L mol−1) | ΔG° (kJ mol−1) | ΔH° (kJ mol−1) | ΔS (J mol−1 K−1) | |
| CT1 | T = 288K | 4.44 | 4.44 | 3.78 × 10⁹ | −49.525 | −171.265 | −408.523 |
| T = 298K | 4.18 | 4.18 | 0.953 × 10⁹ | ||||
| T = 308K | 4.01 | 4.01 | 0.035 × 10⁹ | ||||
| CT2 | T = 288K | 2.17 | 2.17 | 1.059 × 10⁶ | −33.197 | −32.659 | 1.80749 |
| T = 298K | 1.78 | 1.78 | 0.632 × 10⁶ | ||||
| T = 308K | 1.16 | 1.16 | 0.437 × 10⁶ | ||||
| CT3 | T = 288K | 5.75 | 5.75 | 28.125 × 10⁹ | −55.917 | −127.041 | −238.669 |
| T = 298K | 2.31 | 2.31 | 11.418 × 10⁹ | ||||
| T = 308K | 1.56 | 1.56 | 0.88 × 10⁹ | ||||
| CT4 | T = 288K | 2.67 | 2.67 | 1.041 × 10⁶ | −29.519 | −108.443 | −264.843 |
| T = 298K | 1.75 | 1.75 | 0.062 × 10⁶ | ||||
| T = 308K | 1.15 | 1.15 | 0.056 × 10⁶ | ||||
| CT5 | T = 288K | 13.8 | 13.8 | 30.478 | −38.14 | −55.798 | −59.254 |
| T = 298K | 7.98 | 7.98 | 23.334 | ||||
| T = 308K | 5.82 | 5.82 | 19.99 | ||||
Further fluorescence data were analysed to determine the binding sites by using the modified Stern–Volmer equation:39
The plots of log[(F0 − F)/F] against log[Q] at the three temperatures are shown in Fig. 5. The plots showed a linear relationship with the slope equal to n and log![[thin space (1/6-em)]](https://www.rsc.org/images/entities/char_2009.gif) Kb as the intercept. The calculated values of Kb were of the order of 109, indicating a strong interaction between HSA and CTs.3 As the temperature was increased, a noticeable decrease in the binding constant was observed owing to the lower stability of the HSA–CT complex at higher temperatures. The value of n was nearly equal to 1 for all the CTs at all three temperatures. Hence, on the basis of the quenching experiments and the calculated binding parameters, it could be concluded that the CTs formed a static complex with HSA in 1
Kb as the intercept. The calculated values of Kb were of the order of 109, indicating a strong interaction between HSA and CTs.3 As the temperature was increased, a noticeable decrease in the binding constant was observed owing to the lower stability of the HSA–CT complex at higher temperatures. The value of n was nearly equal to 1 for all the CTs at all three temperatures. Hence, on the basis of the quenching experiments and the calculated binding parameters, it could be concluded that the CTs formed a static complex with HSA in 1![[thin space (1/6-em)]](https://www.rsc.org/images/entities/char_2009.gif) :
:![[thin space (1/6-em)]](https://www.rsc.org/images/entities/char_2009.gif) 1 stoichiometry.
1 stoichiometry.
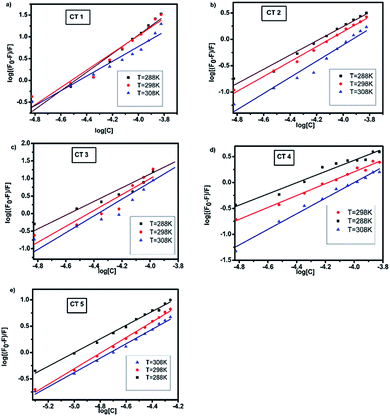 | ||
| Fig. 5 Modified Stern–Volmer plots of the fluorescence quenching of HSA with CTs at 288, 298 and 308 K (λex = 280 nm, pH = 7.4). | ||
Thermodynamic parameters and binding forces
The interaction between a ligand and a biological macromolecule can be classified into four types of forces: hydrogen bonds, van der Waals interactions, hydrophobic forces and electrostatic interactions. These forces can be differentiated by the signs and magnitudes of enthalpy and entropy.3 The fluctuations in entropy and enthalpy during the binding phenomena were identified by the van't Hoff's plot using the given equation:Here, Kb is the binding constant, T is the temperature in kelvin and R is the universal gas constant (8.314 mol−1 K−1).
The Gibbs free energy change (ΔG°) of a drug–protein interaction can be calculated from the following relationship:40
| ΔG° = ΔH° − TΔS° |
The thermodynamics at all three temperatures were calculated and shown in Table 1. The negative value of ΔG° (free energy) suggested the spontaneity of the interaction between CTs and HSA. The negative values of ΔH° and ΔS° implied that the existence of hydrogen bonds and van der Waals interactions played an important role in the CT–HSA interactions. Also, the negative ΔH° value showed that the binding process of CTs to HSA was an exothermic process, which was in line with the decrease in the binding constant with the rise in the temperature.3
Circular dichroism spectroscopy
Circular dichroism is a very sensitive and informative method frequently used to elucidate even minor conformational changes upon drug–protein interactions.41 The CD spectrum of native HSA in a phosphate buffer solution at pH 7.4 was recorded in the range of 190–250 nm, which revealed two significant negative peaks centred at 208 nm and 222 nm in the UV region. The negative bands at 208 nm and 222 nm indicated the π–π* and n–π* transfer for the peptide bonds in the α-helical structure of the protein.42When HSA (15 μM) was titrated with 5 CTs by varying their molar concentration ratios from 1![[thin space (1/6-em)]](https://www.rsc.org/images/entities/char_2009.gif) :
:![[thin space (1/6-em)]](https://www.rsc.org/images/entities/char_2009.gif) 0 to 1
0 to 1![[thin space (1/6-em)]](https://www.rsc.org/images/entities/char_2009.gif) :
:![[thin space (1/6-em)]](https://www.rsc.org/images/entities/char_2009.gif) 1 with regular increments of 3 μM each time, a gradual shift towards 222 nm was observed in all CD spectra (Fig. 6). This decrease in ellipticity indicated disruption in helicity as well as the destabilization of the protein by these CTs.23 It was observed that upon the gradual addition of CTs, the percentage of α-helix decreased abruptly along with an increase in the random percentage. The unfolding of α-helices was predominant with the increase in concentration and this correlated very well with the fluorescence and UV-absorption studies.
1 with regular increments of 3 μM each time, a gradual shift towards 222 nm was observed in all CD spectra (Fig. 6). This decrease in ellipticity indicated disruption in helicity as well as the destabilization of the protein by these CTs.23 It was observed that upon the gradual addition of CTs, the percentage of α-helix decreased abruptly along with an increase in the random percentage. The unfolding of α-helices was predominant with the increase in concentration and this correlated very well with the fluorescence and UV-absorption studies.
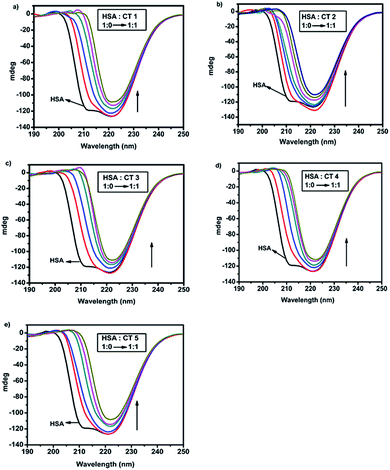 | ||
Fig. 6 CD spectra of HSA (15 μM) in the presence of different concentrations of CTs (a) CT1, (b) CT2, (c) CT3, (d) CT4 and (e) CT5 (HSA![[thin space (1/6-em)]](https://www.rsc.org/images/entities/char_2009.gif) : :![[thin space (1/6-em)]](https://www.rsc.org/images/entities/char_2009.gif) CT ratio = 1 CT ratio = 1![[thin space (1/6-em)]](https://www.rsc.org/images/entities/char_2009.gif) : :![[thin space (1/6-em)]](https://www.rsc.org/images/entities/char_2009.gif) 0 → 1 0 → 1![[thin space (1/6-em)]](https://www.rsc.org/images/entities/char_2009.gif) : :![[thin space (1/6-em)]](https://www.rsc.org/images/entities/char_2009.gif) 1). 1). | ||
Computational methodology
Theoretical calculations for all five chalcone triazole analogs (CTs) were carried out using DFT studies. Computational calculations based on the hybrid functional DFT/B3LYP/6-31+G(d) method were performed using Gaussian software for good accuracy and calculation speed.43 The geometries of CT1-5 were optimized in the ground electronic state, and the energies were minimized. The optimized geometries were used to calculate the energies of the frontier molecular orbitals (HOMO and LUMO). Due to the importance of the molecular orbitals (HOMO and LUMO) and their properties, to predict the reactivity and charge delocalization within the molecule, Gauss-View 5.0 was employed to visualize and construct the shape of the frontier molecular orbitals of the CTs (Fig. 7).44 It is well-known that molecules with large and small HOMO–LUMO gaps correspond to less and more reactive species.44 The HOMO–LUMO gaps of the present CTs were found to have approximately the same value. However, the lowest HOMO–LUMO gap obtained in the case of CT3 supported that it is the most bioactive molecule among all five CTs, which is in good agreement with the experimental results.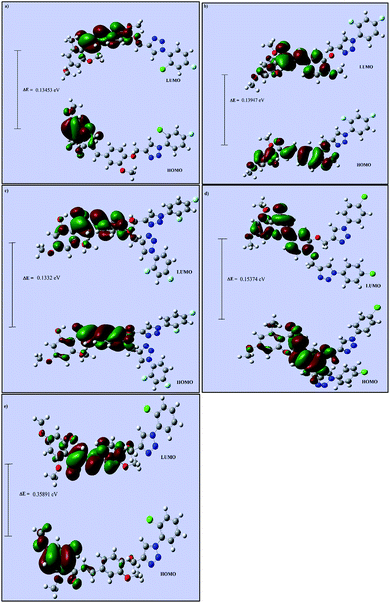 | ||
| Fig. 7 Frontier molecular orbital diagrams of (a) CT1, (b) CT2, (c) CT3, (d) CT4 and (e) CT5 calculated at the B3LYP/6-31+G(d) level. | ||
| Ligand | Receptor | Interacting residues | Residues involved in hydrogen bonding | H-bond distance | Docking score obtained by PatchDock server |
|---|---|---|---|---|---|
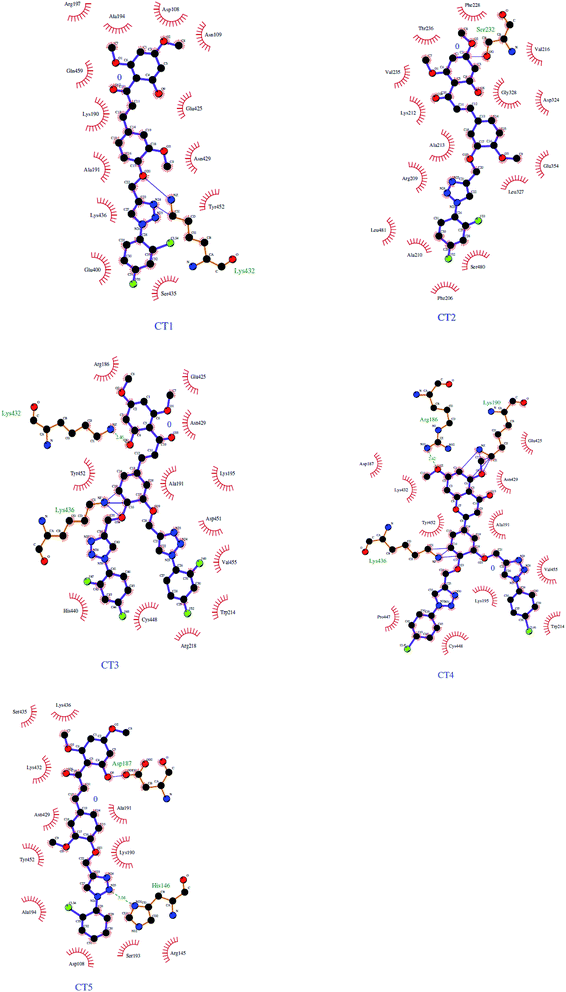
| CT1 | 1BM0 | ASN109, ASP108, SER193, GLU425, GLN459, ASN429, LYS432, GLU400, SER435, LYS436, TYR452, ALA191, LYS190, ARG197, ALA194 | GLU425, LYS432 | 3.13128 Å, (1.83914 Å, 1.91677 Å, 3.04265 Å) | 8114 |
| CT2 | 1BM0 | THR236, VAL235, SER232, GLY328, ASP324, PHE228, VAL325, GLU354, LEU481, LYS351, SER480, GLU479, PHE206, LEU327, VAL216, ARG209, ALA213, ALA210, LYS212 | SER232, ASP324, LEU481, SER480 | 2.18901 Å, 2.88953 Å, 2.9984 Å, 2.04531 Å | 7348 |
| CT3 | 1BM0 | ARG186, LYS432, ASN429, LYS436, TYR452, CYS448, HIS440, ARG222, LYS444, PRO447, ASP451, TRP214, VAL343, ARG218, ALA191, LYS195, VAL455, GLU425, LYS190 | ARG186, LYS190, LYS432, LYS436, ARG218 | 2.79513 Å, (1.73611 Å, 3.19943 Å), 2.4555 Å, 1.81871 Å, 2.67318 Å | 8276 |
| CT4 | 1BM0 | ARG186, LYS432, LYS190, ASP187, GLU425, ASN429, ALA191, LYS436, ASP451, CYS448, VAL343, TRP214, ARG218, PRO447, LEU198, VAL455, LYS195, TYR452 | ARG186, LYS432, LYS190, LYS436, TRP214 | 2.61968 Å, 3.01815 Å, 2.32394 Å, 1.9734 Å, 3.09564 Å | 7206 |
| CT5 | 1BM0 | SER435, ASP187, LYS190, ALA191, SER193, HIS146, ARG145, GLN459, ASP108, ALA194, ASN429, LYS432, TYR452, LYS436 | ASP187, HIS146, LYS436 | 2.66012 Å, 3.03735 Å, 3.06898 Å | 7104 |
Molecular docking studies
The 3D crystal structure of HSA was obtained from the Protein Data Bank for docking analysis. All water and ligand molecules were removed from the structure, and the atomic coordinates of chain A were used as the input for molecular docking. The 3D structure of HSA was predicted by homology modelling and validated through RAMPAGE and the PDBSum server. Active binding sites were identified by the MetaPocket server. Docking was performed using the PatchDock server and Hex 8.0.0 Cuda,24 while docking complexes were visualized by Discovery Studio 3.0 and Ligplot+. The criteria for the selection of the indicated structures were based on PDB advance BLAST analysis, and the structures used in this study were those displaying the maximum score and query cover in BLAST.The interactions between CTs and serum albumin were confirmed by in silico experiments, where the compounds were docked to the crystal structure of HSA to predict its binding mode at the two major ligand binding sites on the protein, i.e., Sudlow's sites I and II.25b The docking results (Fig. 8 ,9 and Table 2) showed that compound CT3 was the most active compound. All these amino acid residues including alanine are believed to be a factor in the formation of the H-bonds, ionic bonds, van der Waals forces, charged interactions and hydrophobic interactions. The GSC score and AI area of the docked complexes made it easy to analyse their binding potency.
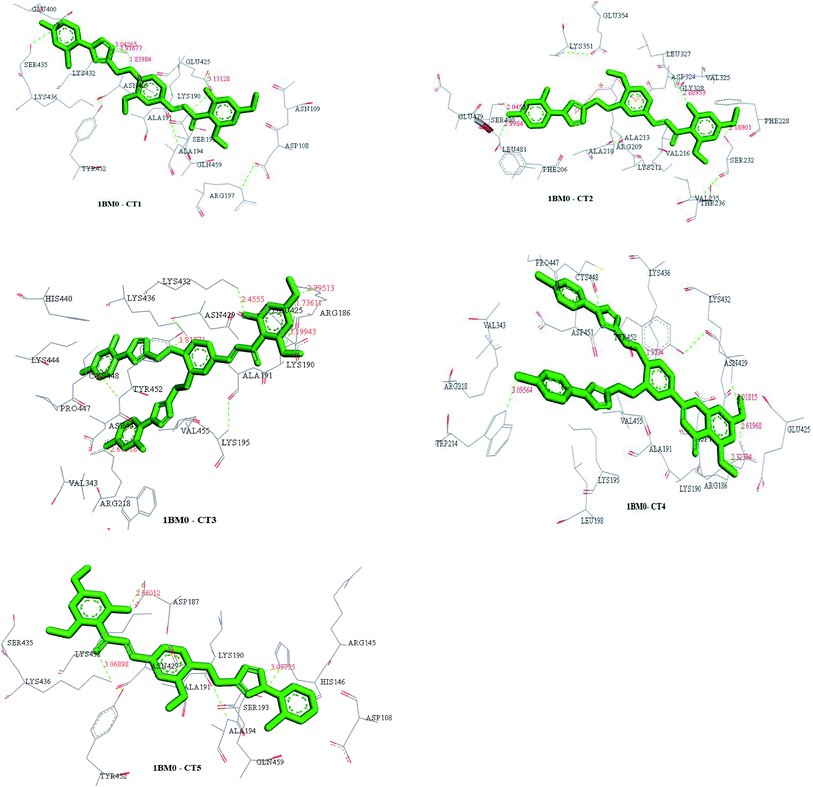 | ||
| Fig. 9 Structures of docked complexes showing the interactions of CT1, CT2, CT3, CT4 and CT5 with the target protein 1BM0. | ||
Conclusion
This study presented a systematic investigation of the interaction mechanism of chalcone triazole (CT) analogs to HSA using different spectroscopic techniques. The increased absorbance in the UV-vis spectra showed the interaction of the chalcone triazole analogs with HSA. Furthermore, the fluorescence results confirmed the static mode of quenching as the values of the quenching constants (∼1012) were greater than those of scatter collision. The values of the binding constants (∼109) showed strong binding with HSA in all the cases, revealing that their clearance from the kidneys and diffusion into the tissues decreased. Also, the analogs having more number of triazole moieties and fluorine atoms showed greater values of binding constants (Kb) as compared to other analogs. The obtained negative values of ΔH and ΔS implied the involvement of hydrogen bonds and van der Waals interactions in the CT–HSA interactions. The results of circular dichroism studies confirmed that the ligands induced some conformational changes in the secondary structure of HSA. These experimental results were validated by theoretical studies such as DFT and molecular docking studies. Molecular docking concluded that these analogs could bind with strong affinity in the Sudlow site II of HSA through H-bonding and hydrophobic interactions. Overall, this study reveals that there is still scope for the further design of 2nd generation chalcone triazole analogs for obtaining even better antimicrobial activities. We believe that this paper will give wider knowledge to the researchers working on similar areas.Conflicts of interest
There are no conflicts of declare.Acknowledgements
PY is thankful to UGC for financial support. JKY and AA are thankful to Banaras Hindu University, Varanasi, India, for the financial support. SKA is thankful to the DST Purse Grant Phase II and University of Delhi, Delhi, India for financial assistance under Research funds. Authors are thankful to University Science and Instrumentation Centre (USIC), University of Delhi, India for instrumental facilities.References
- M. P. Czub, B. S. Venkataramany, K. A. Majorek, K. B. Handing, P. J. Porebski, S. R. Beeram, K. Suh, A. G. Woolfork, D. S. Hage, I. G. Shabalin and W. Minor, Chem. Sci., 2019, 10, 1607–1618 RSC.
- S. Yasmeen and G. Rabbani, J. Therm. Anal. Calorim., 2017, 127, 1445–1455 CrossRef CAS.
- S. Z. Moradi, S. Moradi, A. Nowroozi, K. Sadrjavadi, N. Farhadian, H. Ehzari and M. Shahlaei, RSC Adv., 2018, 8, 40663–40675 RSC.
- X. Xiong, R. Gan, Z. Suo, P. Tang, S. Zhang, Y. Zhu, Q. Sun and H. Li, New J. Chem., 2018, 42, 9791–9800 RSC.
- P. Yadav, K. Lal, A. Kumar, S. K. Guru, S. Jaglan and S. Bhushan, Eur. J. Med. Chem., 2017, 126, 944–953 CrossRef CAS.
- S. Syam, S. I. Abdelwahab, M. A. A. Mamary and s. Mohan, Molecules, 2012, 17, 6179–6195 CrossRef CAS.
- R. H. Hans, E. M. Guantai, C. Lategan, P. J. Smith, B. Wan, S. G. Franzblau, J. Gut, P. J. Rosenthal and K. Chibale, Bioorg. Med. Chem. Lett., 2010, 20, 942–944 CrossRef CAS.
- Y.-M. Lin, Y. Zhou, M. T. Flavin, L. M. Zhou, W. Nie and F. C. Chen, Bioorg. Med. Chem., 2002, 10, 2795–2802 CrossRef CAS.
- J. C. Trivedi, J. B. Bariwal, K. D. Upadhyay, Y. T. Naliapara, S. K. Joshi, C. C. Pannecouque, E. D. Clercq and A. K. Shah, Tetrahedron Lett., 2007, 48, 8472–8474 CrossRef CAS.
- M. F. Mohamed, H. M. Hassaneen and I. A. Abdelhamid, Eur. J. Med. Chem., 2018, 143, 532–541 CrossRef CAS.
- Y. H. Wang, H. H. Dong, F. Zhao, J. Wang, F. Yan, Y. Y. Jiang and Y. S. Jin, Bioorg. Med. Chem. Lett., 2016, 26, 3098–3102 CrossRef CAS.
- A. Modzelewska, C. Pettit, G. Achanta, N. E. Davidson, P. Huang and S. R. Khan, Bioorg. Med. Chem., 2006, 14, 3491–3495 CrossRef CAS.
- S. J. Won, C. T. Liu, L. T. Tsao, J. R. Weng, H. H. Ko, J. P. Wang and C. N. Lin, Eur. J. Med. Chem., 2005, 40, 103–112 CrossRef CAS.
- (a) Z. Zheng and L. Shi, Tetrahedron Lett., 2016, 57, 5132–5134 CrossRef CAS; (b) B. S. Holla, M. Mahalinga, M. S. Karthikeyan, B. Poojary, P. M. Akberali and N. S. Kumari, Eur. J. Med. Chem., 2005, 40, 1173–1178 CrossRef CAS.
- R. Kharb, M. S. Yar and P. C. Sharma, Curr. Med. Chem., 2011, 18, 3265–3297 CrossRef CAS.
- M. R. E. S. Aly, H. A. Saad and M. A. M. Mohamed, Bioorg. Med. Chem. Lett., 2015, 25, 2824–2830 CrossRef CAS.
- K. Kumar, B. Pradines, M. Madamet, R. Amalvict and V. Kumar, Eur. J. Med. Chem., 2014, 86, 113–121 CrossRef CAS.
- M. H. Shaikh, D. D. Subhedar, L. Nawale, D. Sarkar, F. A. Khan, J. N. Sangshetti and B. B. Shingate, Med. Chem. Commun., 2015, 6, 1104–1116 RSC.
- R. Anej, A. A. Rashad, H. Li, R. V. K. Sundaram, C. Duffy, L. D. Bailey and I. Chaiken, J. Med. Chem., 2015, 58, 3843–3858 CrossRef.
- R. Kant, D. Kumar, D. Agarwal, R. D. Gupta, R. Tilak, S. K. Awasthi and A. Agarwal, Eur. J. Med. Chem., 2016, 113, 34–49 CrossRef CAS.
- (a) G. Rabbani, E. J. Lee, K. Ahmad, M. H. Baig and I. Choi, Mol. Pharmaceutics, 2018, 15, 1445–1456 CrossRef CAS PubMed; (b) P. Yadav, J. K. Yadav, A. K. Dixit, A. Agarwal and S. K. Awasthi, Luminescence, 2019 DOI:10.1002/bio.3676.
- J. R. Lakowicz, Principles of Fluorescence Spectroscopy, Springer Science & Business Media, LLC, New York, NY, USA, 2007 Search PubMed.
- D. Sood, N. Kumar, G. Rathee, A. Singh, V. Tomar and R. Chandra, Sci. Rep., 2018, 8, 16964 CrossRef.
- (a) G. Macindoe, L. Mavridis, V. Venkatraman, M. D. Devignes and D. W. Ritchie, Nucleic Acids Res., 2010, 38, W445–W449 CrossRef CAS; (b) D. Actin, Am. J. Biochem. Biotechnol., 2013, 9, 318–328 CrossRef.
- (a) A. N. Nasruddin, S. R. Feroz, A. K. Mukarram, S. B. Mohamad and S. Tayyab, J. Lumin., 2016, 174, 77–84 CrossRef CAS; (b) S. Tayyab, M. M. Izzudin, M. Z. Kabi, S. R. Feroz, W. V. Tee, S. B. Mohamad and Z. Alias, J. Photochem. Photobiol., B, 2016, 162, 386–394 CrossRef CAS.
- X. Cao, Y. He, D. Liu, Y. He, X. Hou, Y. Cheng and J. Liu, RSC Adv., 2018, 8, 25519–25525 RSC.
- Q. Gan, X. Fu, W. Chen, Y. Xiong, Y. Fu, S. Chen and X. Le, J. Fluoresc., 2016, 26, 905–918 CrossRef CAS.
- M. Siddiqi, S. Nusrat, P. Alam, S. Malik, S. K. Chaturvedi, M. R. Ajmal, A. S. Abdelhameed and R. H. Khan, Int. J. Biol. Macromol., 2018, 107, 1414–1421 CrossRef CAS.
- S. Singh, K. Sharma and S. K. Awasthi, RSC Adv., 2015, 5, 85854–85861 RSC.
- C. Albrecht, J. R. Lakowicz: Principles of Fluorescence Spectroscopy, 3rd Edition, Anal. Bioanal. Chem., 2008, 390, 1223–1224 CrossRef CAS.
- G. Vignesh, S. Arunachalam, S. Vignesh and R. A. James, Spectrochim. Acta, Part A, 2012, 96, 108–116 CrossRef CAS.
- O. K. A. Zied and O. I. A. Shihi, J. Am. Chem. Soc., 2008, 130, 10793–10801 CrossRef.
- N. Bijari, Y. Shokoohinia, M. R. A. Kooshk, S. Ranjbar, S. Parvaneh, M. M. Arya and R. Khodarahmi, J. Lumin., 2013, 143, 328–336 CrossRef CAS.
- P. Alam, S. K. Chaturvedi, T. Anwar, M. K. Siddiqi, M. R. Ajmal, G. Badr, M. H. Mahmoud and R. H. Khan, J. Lumin., 2015, 164, 123–130 CrossRef CAS.
- M. G. Wen, X. B. Zhang, J. N. Tian, S. H. Ni, H. D. Bian, Y. L. Huang and H. Liang, J. Solution Chem., 2009, 38, 391–401 CrossRef CAS.
- G. Rabbani, M. H. Baig, E. J. Lee, W. K. Cho, J. Y. Ma and I. Choi, Mol. Pharmaceutics, 2017, 14, 1656–1665 CrossRef CAS.
- R. Subramanyam, M. Goud, B. Sudhamalla, E. Reddeem, A. Gollapudi, S. Nellaepalli, V. Yadavalli, M. Chinnaboina and D. G. Amooru, J. Photochem. Photobiol., B, 2009, 95, 81–88 CrossRef CAS.
- X. Xiong, J. He, H. Yang, P. Tang, B. Tang, Q. Sun and H. Li, RSC Adv., 2017, 7, 48942–48951 RSC.
- G. Rabbani, M. J. Khan, A. Ahmad, M. Y. Maskat and R. H. Khan, Colloids Surf., B, 2014, 123, 96–105 CrossRef CAS.
- S. Huang, J. Xie, J. Cui, L. Liu, Y. Liang, Y. Liu and Q. Xiao, Steroids, 2017, 128, 136–146 CrossRef CAS.
- S. Yadav, I. Yousuf, M. Usman, M. Ahmad, F. Arjmand and S. Tabassum, RSC Adv., 2015, 5, 50673–50690 RSC.
- X. Zhang, L. Li, Z. Xu, Z. Liang, J. Su, J. Huang and B. Li, PLoS One, 2013, 8, 59106 CrossRef.
- G. S. Kumar, A. A. Prabhu, N. Bhuvanesh, X. A. Ronica and S. Kumaresan, Spectrochim. Acta, Part A, 2014, 132, 465 CrossRef PubMed.
- A. Ali, M. Asif, P. Alam, M. J. Alam, M. A. Sherwani, R. H. Khan and S. Ahmad, Bioorg. Chem., 2017, 73, 83–99 CrossRef CAS.
| This journal is © The Royal Society of Chemistry 2019 |


