 Open Access Article
Catalytic fast pyrolysis of lignin to produce aromatic hydrocarbons: optimal conditions and reaction mechanism
Zhongyang
Luo
 *,
Kongyu
Lu
,
Yi
Yang
,
Simin
Li
and
Guoxiang
Li
State Key Laboratory of Clean Energy Utilization, Zhejiang University, Hangzhou 310027, China. E-mail: zyluo@zju.edu.cn; Tel: +86-571-87952440
First published on 8th October 2019
Abstract
Catalytic fast pyrolysis of lignin with zeolite catalysts is a promising method to produce aromatic hydrocarbons. In this paper, alkali lignin was used as a model compound to pyrolyze with HZSM-5 (silica to alumina ratio, SAR = 23), HZSM-5(50), HZSM-5(80), HY and Hβ. Non-condensable vapours and condensable fractions were determined and quantified by GC/FID and GC/MS respectively. 7.63 wt% of aromatic hydrocarbons and 3.34 wt% of C1–C4 alkanes and alkenes were acquired. The effects of catalysts and pyrolysis parameters were studied in this work. Different reaction pathways were compared and discussed by combining density functional theory (DFT) calculations. Cyclization reactions to form aromatic hydrocarbons were thought to be the main reaction pathway, while direct demethylation, demethoxylation and dehydration reactions were the secondary reaction pathway to convert phenolic lignin monomers to non-oxygenated aromatic hydrocarbons.
1. Introduction
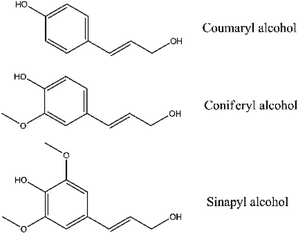
BTEX (benzene, toluene, ethyl benzene and xylenes), four monocyclic aromatic hydrocarbons (MAH), are important petrochemical materials in manufacturing numerous organic chemicals, such as plastic resins, synthetic fibres, solvents and plasticizers.2 Polycyclic aromatic hydrocarbons (PAH), for instance naphthalene and anthracene, are used as additives to jet fuel. Nowadays, MAH and PAH are mainly obtained from fossil petroleum. Catalytic fast pyrolysis of lignocellulosic biomass with some zeolite catalysts has been proved to be a renewable approach to produce aromatic hydrocarbons.1,3Lignocellulosic biomass mainly consists of cellulose, hemicellulose and lignin. Cellulose and hemicellulose are typical carbohydrates, while lignin is an aromatic polymer. The monomers of lignin are mainly p-coumaryl, coniferyl and sinapyl alcohols.4 (Fig. 1) Therefore, lignin is often designated as H-lignin (p-hydroxyphenyl subunits), G-lignin (guaiacyl subunits) or S-lignin (syringyl subunits). Because of the aromatic structure of lignin itself, catalytic pyrolysis of lignin should achieve a higher aromatic hydrocarbon yield than cellulose and hemicellulose theoretically. However, some previous works showed contrary results that cellulose and hemicellulose could have a higher aromatic hydrocarbon yield than lignin.5,6
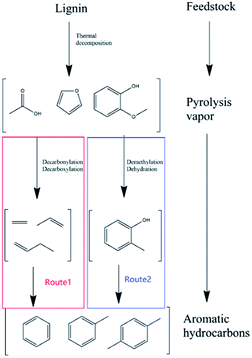
As shown in Fig. 2, the whole process of lignin catalytic fast pyrolysis with zeolite catalysts could be divided into mainly two steps. Firstly, feedstock was thermally decomposed into smaller oxygenated molecules, such as acids, aldehydes, furans, phenols, anhydrosugars and so on.7,8 All these intermediate products then diffused into zeolite pores. Disagreements aroused here. G. W. Huber9–12 believed that these intermediate oxygenates would be deoxygenated firstly due to the acid sites on zeolites to form dehydrate species like ethylene, propylene, butylene and so on. The dehydrate species were called hydrocarbon pool. These C2–C4 dehydrate products would go through a route from olefin to aromatics, to form the aromatic hydrocarbons (Fig. 2 route 1). However, others13,14 believed phenol, guaiacol and other aromatic oxygenates to be the intermediate products. After demethoxylation reactions and demethylation reactions with catalysts, these phenolic were converted to phenol, cresol and ethylphenol.15 Finally, after dehydration reaction, benzene, toluene, xylene were acquired (Fig. 2 route 2).
In order to achieve higher aromatic hydrocarbons yield in catalytic fast pyrolysis of lignin, it is very important to figure out the optimal pyrolysis parameters and illustrate the reaction mechanism. In this paper, catalytic pyrolysis of lignin with five different zeolite catalysts were compared. Influences of catalysts, catalyst to lignin ratio (CLR), heating rate, pyrolysis temperature on both aromatic hydrocarbons and C1–C4 gaseous hydrocarbon were studied. Different reaction pathways were compared and discussed by combining density functional theory (DFT).
2. Experimental setup
2.1 Feedstock
Alkali lignin, an important by-product of pulp and paper industry, was commonly used as a model compound of lignin.16,17 In this work, alkali lignin (low sulfonate content, Sigma Aldrich, USA) was used as pyrolysis feedstock. Ultimate analysis and industrial analysis of the raw material have been carried out in previous work.17 The ultimate analysis result (ash free) of alkali lignin was presenting as C of 62.46%, H of 3.72%, O of 32.37%, N of 0.26%, and S of 1.19%. The proximate analysis result (dry basis) of alkali lignin was presenting as volatiles of 64.66%, fixed carbon of 32.47%, and ash of 2.87%. Prior to the experiment, alkali lignin was dried at 105 °C for more than 4 h to remove moisture.2.2 Catalysts preparation and characterization
HZSM-5(23), HZSM-5(50), HZSM-5(80), HY, Hβ, purchased from Tianjin Nankai catalyst company, were used as catalysts in these catalytic pyrolysis experiments. Prior to all experiments and characterization, all catalysts were dried at 120 °C for 16 h.To obtain surface area and pore size distribution of the catalysts, nitrogen adsorption/desorption isotherms were acquired from a chemical station (Micromeritics ASAP-2010). All samples were degassed in vacuum at 220 °C over 24 hours before physisorption. The surface areas were derived from a standard Brunauer–Emmett–Teller (BET) equation. The average pore diameters were calculated using Barret–Joyner–Halenda (BJH) analysis.18
To compare the acidity of HZSM-5 with different silicon to aluminium ratio (SAR), temperature programmed desorption of ammonia (NH3-TPD) was performed in an AutoChem II 2910 with a mass spectrometry (MS). In a typical run, after degassing at 550 °C in a flow of He (50 ml min−1), 0.1 g catalyst was exposed in a flow of NH3 (15% NH3 + 85% He, 50 ml min−1) at 60 °C for 1 hour. After that, to remove the physically absorbed NH3, the catalyst sample was flushed by He (50 mL min−1) at 100 °C for 2 hours. Then the sample was heated up to 700 °C (10°C min−1). The amount of chemical adsorbed NH3 was recorded by MS.19
2.3 Catalytic pyrolysis procedure and products analysis
In this study, C6–C10 + PAH were identified and quantified (C6-benzene; C7-toluene; C8-xylene, ethyl benzene; C9-trimethyl benzene, methyl ethyl benzene, indane, indene; C10 + PAH-naphthalene, methylnaphthalene, anthracene, phenanthrene). Identification of products was to compare the mass spectra of the peaks with NIST library (version 2014). Pure compounds (Sigma Aldrich, USA) of aromatic hydrocarbons mentioned above were used to conduct the quantification by external standards with a five-point calibration curve.
2.4 Calculation of pyrolysis reactions and catalytic reactions
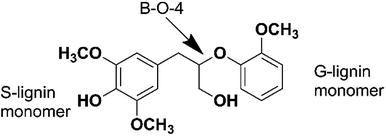
In order to figure out the mechanism of catalytic pyrolysis of lignin, some calculation was carried out using the Gaussian 03 suite of program. 1-(3,5-dimethoxyphenyl)-2-(2-methoxyphenoxy)propane-1,3-diol (DMPD, Fig. 4), a typical β-o-4 ether linkage lignin dimer, contains a G-lignin monomer and a S-lignin monomer.20 In this calculation part, DMPD was designed as the initial lignin dimer to compare the route1 and route2 reaction pathways. The equilibrium geometries of reactants, intermediates, transition states, and products were optimized using density functional theory (DFT) methods employing B3LYP/6-31G(d), and then single point energies were evaluated with a larger 6-311++G(d, p) basis set at the same level of theory. The transition states were located by the TS method and were confirmed by visual inspection of the imaginary frequency using Gauss view and by performing intrinsic reaction coordinate (IRC) calculations. The reactants, intermediates, and products had no imaginary frequencies, whereas each transition state had only one imaginary frequency. Activation energies (the reaction energy barriers) of reaction were estimated based on the energy difference, including the zero-point energy correction, between the transition state and the reactant. For free–radical reactions, the bond dissociation energies were employed as approximations of the activation energies.3. Results and discussion
3.1 Catalyst properties
Table 1 shows the comparison of nitrogen adsorption/desorption properties of the catalysts used in this paper. HZSM-5, as typical microporous catalysts, had an average pore size from 0.498–0.510 nm with different SAR. The BET surface area and the pore volume of different HZSM-5 decreased from 357.74 m2 g−1 to 259.71 m2 g−1 and 0.184 cm3 g−1 to 0.132 cm3 g−1 respectively, with the increase of SAR. It implied that, with a higher SAR, the reaction activities of HZSM-5 decreased. HY had a similar pore size as HZSM-5 of 0.511 nm, a larger surface area of 660.422 m2 g−1 and a larger pore volume of 0.338 cm3 g−1. Hβ had the largest pore size and pore volume among all the five zeolite catalysts. The pore size of three HZSM-5 catalysts and HY were similar to MAHs, which might promote the cyclization reactions (route1). On the other hand, Hβ with a pore size of 0.767 nm might be suitable for demethoxylation reactions and demethylation reactions to convert phenolic oxygenates to aromatic hydrocarbons (route2).| Catalyst | BET Surface area (m2 g−1) | Pore size (nm) | Pore volume (cm3 g−1) |
|---|---|---|---|
| HZSM-(23) | 357.74 | 0.501 | 0.184 |
| HZSM-(50) | 315.08 | 0.498 | 0.157 |
| HZSM-(80) | 259.71 | 0.510 | 0.132 |
| HY | 660.42 | 0.511 | 0.338 |
| Hβ | 527.31 | 0.767 | 0.405 |
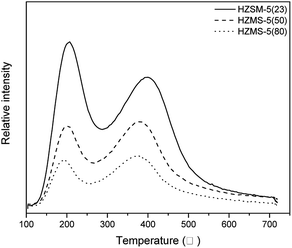
Fig. 5 showed the NH3 desorption amounts of HZSM-5 catalysts with different SAR in NH3-TPD. The NH3 desorption curves illustrated the strength and amount of acid. The curves of three HZSM-5 all had a peak located around 200 °C, which represented weak acid sites. Another peak related to strong acid sites was about 370 °C. With the increase of SAR, the amount and strength of acid sites from HZSM-5 catalyst decrease obviously, which results in the decrease of peak height, peak area and the shift of peak point to low temperature. This phenomenon has been reported in many literatures related to HZSM-5 catalysts.
3.2 Influence of catalyst
| Category | Non-catalytica | Catalyticb |
|---|---|---|
a Non-catalytic: direct pyrolysis of lignin, pyrolysis temperature 600 °C, heating rate 10000 K s−1, resident time 30 s.
b Catalytic: catalytic pyrolysis of lignin with HZSM-5(23), lignin to catalyst ratio 1![[thin space (1/6-em)]](https://www.rsc.org/images/entities/char_2009.gif) : :![[thin space (1/6-em)]](https://www.rsc.org/images/entities/char_2009.gif) 5, pyrolysis temperature 600 °C, heating rate 10000 K s−1, resident time 30 s.
c Based on relative peak area percentage in GC-MS spectra.
d N/A: not detected. 5, pyrolysis temperature 600 °C, heating rate 10000 K s−1, resident time 30 s.
c Based on relative peak area percentage in GC-MS spectra.
d N/A: not detected.
|
||
| Acid | 7.31%c | N/Ad |
| Furan | 11.39% | N/A |
| Sugar | 2.42% | N/A |
| Phenol | 68% | N/A |
| MAHs | N/A | 64.23% |
| PAHs | 3.31% | 31.53% |
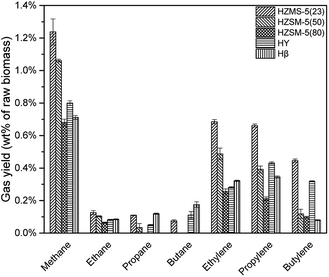
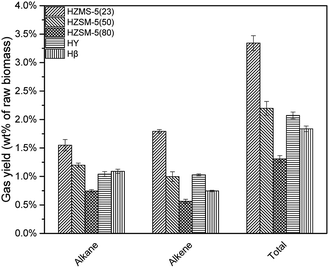
HZSM-5, HY, Hβ are zeolite catalysts with some acid sites and have high activity in deoxygenation reaction. As shown in Fig. 6, deoxygenation reactions produced mainly alkanes and alkenes. Methane had the highest yield due to the demethoxyl reactions from G and S type lignin monomers. HY tended not to break C–C bond, which resulted in a higher selectivity of propylene and butylene when compared to the other catalysts. Comparatively, HZSM-5(23), with the strongest acid sites among three HZSM-5 type catalysts, produced the most alkanes and alkenes (Fig. 7).
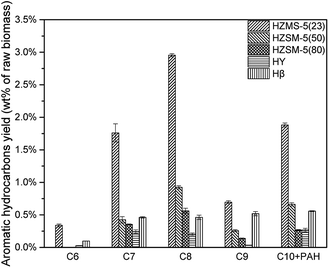
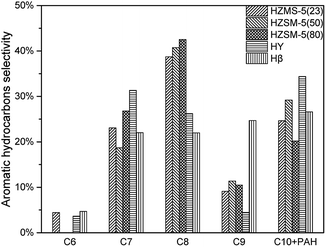
According to Fig. 8, all these five catalysts produced different amount of MAH and PAH in condensable fractions. HY had the lowest reaction activity for aromatic hydrocarbon production. From C7 to C10 + PAH, HY all had the lowest yield. HZSM-5(23) achieved all the highest yield from C6 to C10 + PAH, due to both its strong acid sites and high selectivity in aromatic production reaction. With the increase of HZSM-5 SAR, the yields for MAH and PAH both decreased significantly. HZSM-5 (23) had strongest acidity, which results in higher yield of alkanes and alkenes. Further conversion of these alkanes and alkenes under suitable conditions was able to produce more MAHs by polymerization and cyclization reactions. Fig. 9 showed the selectivity from C6 to C10 + PAH. HZSM-5 series catalysts produced lots of MAHs such as C7 and C8. When the carbon chain continued to increase, HZSM-5 tended to produce more C10 + PAH rather than C9. For Hβ, the selectivity of C6 to C10 + PAH was similar due to its relatively large pore size. In total, HZSM-5(23) produced 5.75% MAH and 1.88% PAH respectively.(Table 3)
| Catalyst | MAH yield | PAH yield | Total yield | MAH selectivityb | PAH selectivityc |
|---|---|---|---|---|---|
| a Weight percent of raw alkali lignin. b MAH selectivity = MAH yield/(MAH yield + PAH yield). c PAH selectivity = PAH yield/(MAH yield + PAH yield). | |||||
| HZMS-(23) | 5.75a% | 1.88% | 7.63% | 75.34% | 24.66% |
| HZSM-(50) | 1.61% | 0.66% | 2.27% | 70.81% | 29.19% |
| HZSM-(80) | 1.06% | 0.27% | 1.32% | 79.82% | 20.18% |
| HY | 0.51% | 0.27% | 0.77% | 65.61% | 34.39% |
| Hβ | 1.54% | 0.56% | 2.10% | 73.40% | 26.60% |
![[thin space (1/6-em)]](https://www.rsc.org/images/entities/char_2009.gif) :
:![[thin space (1/6-em)]](https://www.rsc.org/images/entities/char_2009.gif) 1, 1
1, 1![[thin space (1/6-em)]](https://www.rsc.org/images/entities/char_2009.gif) :
:![[thin space (1/6-em)]](https://www.rsc.org/images/entities/char_2009.gif) 1, 1
1, 1![[thin space (1/6-em)]](https://www.rsc.org/images/entities/char_2009.gif) :
:![[thin space (1/6-em)]](https://www.rsc.org/images/entities/char_2009.gif) 5. Then the mixture was pyrolyzed by the Pyroprobe at 600 °C with a heating rate of 10000 K s−1 and a resident time of 30 s.
5. Then the mixture was pyrolyzed by the Pyroprobe at 600 °C with a heating rate of 10000 K s−1 and a resident time of 30 s.
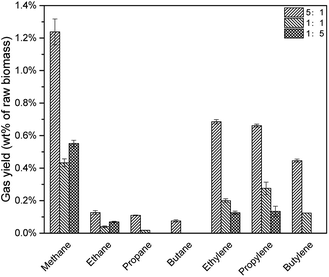
As shown in Fig. 10, with the decrease of CLR, fewer alkenes were produced due to fewer acid sites. However, when CLR decreased from 1![[thin space (1/6-em)]](https://www.rsc.org/images/entities/char_2009.gif) :
:![[thin space (1/6-em)]](https://www.rsc.org/images/entities/char_2009.gif) 1 to 1
1 to 1![[thin space (1/6-em)]](https://www.rsc.org/images/entities/char_2009.gif) :
:![[thin space (1/6-em)]](https://www.rsc.org/images/entities/char_2009.gif) 5, the yields of methane and ethane increased slightly. The reason was not clear but possible explanation might be easier diffusion of gases and fewer coke formation with less catalyst. When CLR decreased from 5
5, the yields of methane and ethane increased slightly. The reason was not clear but possible explanation might be easier diffusion of gases and fewer coke formation with less catalyst. When CLR decreased from 5![[thin space (1/6-em)]](https://www.rsc.org/images/entities/char_2009.gif) :
:![[thin space (1/6-em)]](https://www.rsc.org/images/entities/char_2009.gif) 1 to 1
1 to 1![[thin space (1/6-em)]](https://www.rsc.org/images/entities/char_2009.gif) :
:![[thin space (1/6-em)]](https://www.rsc.org/images/entities/char_2009.gif) 1, total hydrocarbon gas yield decreased from 3.34 wt% to 0.88 wt%, as shown in Table 4.
1, total hydrocarbon gas yield decreased from 3.34 wt% to 0.88 wt%, as shown in Table 4.
| Catalyst to lignin ratio | Alkane yield | Alkene yield | Total |
|---|---|---|---|
5![[thin space (1/6-em)]](https://www.rsc.org/images/entities/char_2009.gif) : :![[thin space (1/6-em)]](https://www.rsc.org/images/entities/char_2009.gif) 1 1 |
1.55% | 1.79% | 3.34% |
1![[thin space (1/6-em)]](https://www.rsc.org/images/entities/char_2009.gif) : :![[thin space (1/6-em)]](https://www.rsc.org/images/entities/char_2009.gif) 1 1 |
0.49% | 0.60% | 1.09% |
1![[thin space (1/6-em)]](https://www.rsc.org/images/entities/char_2009.gif) : :![[thin space (1/6-em)]](https://www.rsc.org/images/entities/char_2009.gif) 5 5 |
0.62% | 0.26% | 0.88% |
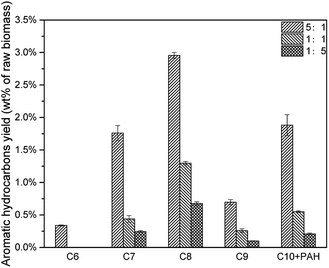
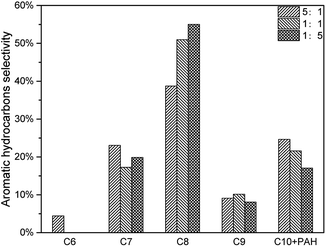
The decrease of CLR resulted in less deoxygenation reaction and less aromatic hydrocarbon formation (Fig. 11), and all the aromatic hydrocarbon yields decreased. On the other hand, MAHs and alkenes were thought to be precursors of C10 + PAH. With a lower CLR, the unstable intermediate products were more dispersed. Thus, the intermediate products were less possible to react with each other to increase the carbon chain, which implied that the increasing of carbon chain became more difficult with the decrease of CLR. The evidence was that, as shown in Fig. 12, the selectivity peak shifted from C10 + PAH to C8, with the decrease of CLR. 5![[thin space (1/6-em)]](https://www.rsc.org/images/entities/char_2009.gif) :
:![[thin space (1/6-em)]](https://www.rsc.org/images/entities/char_2009.gif) 1 had a highest selectivity on C10 + PAH, while 1
1 had a highest selectivity on C10 + PAH, while 1![[thin space (1/6-em)]](https://www.rsc.org/images/entities/char_2009.gif) :
:![[thin space (1/6-em)]](https://www.rsc.org/images/entities/char_2009.gif) 1 and 1
1 and 1![[thin space (1/6-em)]](https://www.rsc.org/images/entities/char_2009.gif) :
:![[thin space (1/6-em)]](https://www.rsc.org/images/entities/char_2009.gif) 5 had the highest on C9 and C8 respectively. Due to the less possibility of carbon chain increasing, MAH selectivity increased from 75.34% to 82.97% with the decrease of CLR. While the PAH selectivity decreased from 24.66% to 17.03%.(Table 5)
5 had the highest on C9 and C8 respectively. Due to the less possibility of carbon chain increasing, MAH selectivity increased from 75.34% to 82.97% with the decrease of CLR. While the PAH selectivity decreased from 24.66% to 17.03%.(Table 5)
| CLR | MAH yield | PAH yield | Total yield | MAH selectivity | PAH selectivity |
|---|---|---|---|---|---|
5![[thin space (1/6-em)]](https://www.rsc.org/images/entities/char_2009.gif) : :![[thin space (1/6-em)]](https://www.rsc.org/images/entities/char_2009.gif) 1 1 |
5.75% | 1.88% | 7.63% | 75.34% | 24.66% |
1![[thin space (1/6-em)]](https://www.rsc.org/images/entities/char_2009.gif) : :![[thin space (1/6-em)]](https://www.rsc.org/images/entities/char_2009.gif) 1 1 |
1.99% | 0.55% | 2.54% | 78.39% | 21.61% |
1![[thin space (1/6-em)]](https://www.rsc.org/images/entities/char_2009.gif) : :![[thin space (1/6-em)]](https://www.rsc.org/images/entities/char_2009.gif) 5 5 |
1.02% | 0.21% | 1.23% | 82.97% | 17.03% |
3.3 Influence of pyrolysis parameter
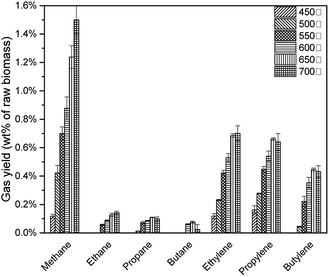
As shown in Fig. 13, with the pyrolysis temperature increased, feedstock was decomposed vigorously to produce more alkanes and alkenes. 22 However, at 650 °C, C3 (propane, propylene) and C4 (butane, butylene) achieved the highest yield. When the pyrolysis temperature increased to 700 °C, although the average value of C3 and C4 decreased, when considering the standard deviation presented, these values were statistically similar.(Table 6)
| Pyrolysis temperature | Alkane yield | Alkene yield | Total |
|---|---|---|---|
| 450 °C | 0.12% | 0.28% | 0.40% |
| 500 °C | 0.44% | 0.55% | 0.99% |
| 550 °C | 0.83% | 1.09% | 1.92% |
| 600 °C | 1.11% | 1.42% | 2.54% |
| 650 °C | 1.55% | 1.79% | 3.34% |
| 700 °C | 1.77% | 1.77% | 3.54% |
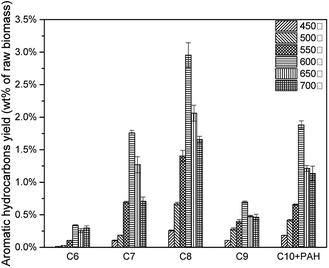
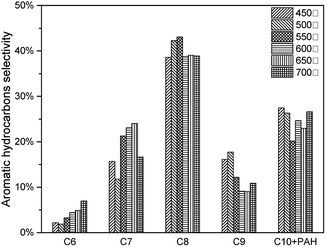
The effects of pyrolysis temperature on condensable fractions were shown in Fig. 14. For all C6–C10 aromatic hydrocarbons, the yield increased from 450 °C to 600 °C, then decreased after 600 °C. As mentioned above, during the catalytic pyrolysis process, lignin was thermally decomposed to produce pyrolysis vapours. With a higher temperature, feedstock was decomposed more severely. Thus more intermediate products would take deoxygenation reactions, and more aromatic hydrocarbons would be generated. When the temperature became higher than 600 °C, it would cause the second decomposition reaction of the intermediate products (acid, furan, phenol and sugar) and final products (MAH and PAH) to form more coke.(Table 7) However, at 600 °C, 7.63 wt% of aromatic hydrocarbon was produced.(Fig. 15)
| Pyrolysis temperature | MAH yield | PAH yield | Total yield | MAH selectivity | PAH selectivity |
|---|---|---|---|---|---|
| 450 °C | 0.49% | 0.18% | 0.67% | 72.54% | 27.46% |
| 500 °C | 1.17% | 0.42% | 1.58% | 73.67% | 26.33% |
| 550 °C | 2.60% | 0.66% | 3.26% | 79.82% | 20.18% |
| 600 °C | 5.75% | 1.88% | 7.63% | 75.34% | 24.66% |
| 650 °C | 4.07% | 1.21% | 5.28% | 77.04% | 22.96% |
| 700 °C | 3.13% | 1.13% | 4.26% | 73.37% | 26.63% |
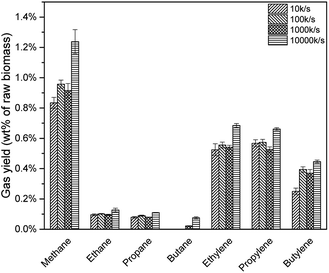
Previous study illustrated that, a higher heating rate was effective to avoid coke formation as well as increase pyrolysis vapour yield.23 Thus, more pyrolysis vapour would be deoxygenated to produce C1–C4 alkanes and alkenes due to HZSM-5 strong acid sites. As shown in Fig. 16, all the alkanes and alkenes increased with a higher heating rate. However, for different heating rate, real resident time was different. Take 10 K s−1 for example, the Pyroprobe was heated up from 20 °C (room temperature) to 600 °C, which might be around 58 s. Considering that the system would be held for another 30 s, the whole reaction time was 88 s. For 100 K s−1 and 1000 K s−1, the real resident time were 35.8 s and 30.6 s. This might be the reason that the yield for 100 K s−1 and 1000 K s−1 were similar in Fig. 16.
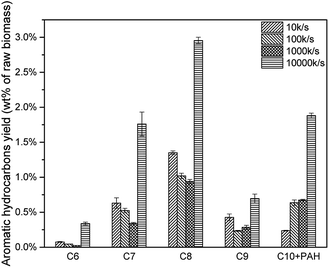
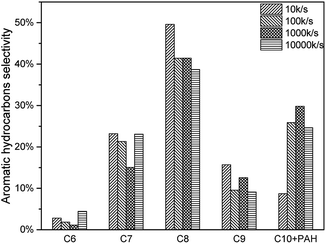
As mentioned above, higher heating rate resulted in an increase of pyrolysis vapour yield. More pyrolysis vapour generated more C6–C10 aromatic hydrocarbon as well as C1–C4 alkanes and alkenes. Results were shown in Fig. 17, for all C6–C10 aromatic hydrocarbon, 10000 K s−1 produced the most. The yield of 10 K s−1, 100 K s−1 and 1000 K s−1 were similar, which might be influenced by the “real resident time” issue.(Fig. 18, Tables 8 and 9)
| Heating rate | Alkane yield | Alkene yield | Total |
|---|---|---|---|
| 10 K s−1 | 1.01% | 1.34% | 2.35% |
| 100 K s−1 | 1.17% | 1.52% | 2.69% |
| 1000 K s−1 | 1.09% | 1.44% | 2.53% |
| 10000 K s−1 | 1.55% | 1.79% | 3.34% |
| Heating rate | MAH yield | PAH yield | Total yield | MAH selectivity | PAH selectivity |
|---|---|---|---|---|---|
| 10 K s−1 | 2.49% | 0.24% | 2.72% | 91.29% | 8.71% |
| 100 K s−1 | 1.82% | 0.64% | 2.46% | 74.11% | 25.89% |
| 1000 K s−1 | 1.59% | 0.68% | 2.27% | 70.20% | 29.80% |
| 10000 K s−1 | 5.75% | 1.88% | 7.63% | 75.34% | 24.66% |
3.4 Reaction pathways to aromatic hydrocarbons over zeolite catalyst
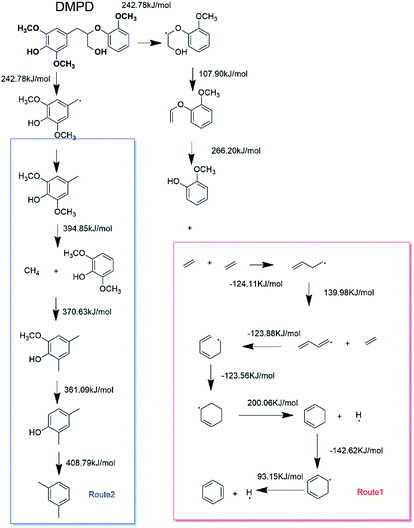
In order to discuss these different reaction pathways for lignin catalytic pyrolysis, density functional theory were used in this section. 1-(3,5-dimethoxyphenyl)-2-(2-methoxyphenoxy) propane-1,3-diol (DMPD, Fig. 4), a typical β-o-4 ether linkage lignin dimer, was used as lignin feedstock.20 DMPD was decomposed firstly.24 Then, C2–C4 dehydrate species would go through the olefin to aromatics route, to form the aromatic hydrocarbons (Fig. 19 route 1). On the other hand, after demethylation reaction, demethoxylation reaction and dehydration reaction, 2,6-dimethoxy-4-methylphenol was conversed into xylene (Fig. 19 route 2). Bond dissociation energy (BDE) for each step was shown in Fig. 19. As for route 1, the olefin to aromatics route, the BDEs for each step varied from 93.15 kJ mol−1 to 200.06 kJ mol−1. As for route 2, BDEs for demethylation reaction, demethoxylation reaction and dehydration reaction were 394.85 kJ mol−1, 370.63 kJ mol−1, 361.09 kJ mol−1 and 408.79 kJ mol−1, which were significantly higher than route 1. Comparatively, route 1 was a more favourable reaction pathway than route 2. However, C2–C4 dehydrate products in route 1 mainly came from substituents of benzene ring. In some cases, 7.63 wt% of aromatic hydrocarbons and 3.34 wt% of C1–C4 alkanes and alkenes were acquired. Obviously, route1 alone was not able to produce such amount of hydrocarbon products. Thus, part of the aromatic hydrocarbons were formed via route 2, especially when reaction temperature was higher.In section 3.1.2 HZSM-5 serious catalysts and Hβ showed a different products distribution. The pore size of HZSM-5 series catalysts is around 0.5 nm, which is suitable for BTEX (C6, C7, and C8). So, it could be a reasonable speculation that route 1 might be a primary reaction pathway for the pyrolysis vapours with HZSM-5. Consequently, HZSM-5 had a high selectivity in C7 and C8 and relatively low selectivity in C9 (Section 3.1.2 Fig. 9). On the contrary, the pore size of Hβ is around 0.767 nm, which is suitable not only for BTEX (C6, C7, C8), but also for C9, C10 and some intermediate products in route 2. Thus, there might be more intermediate products taking demethylation reactions, demethoxylation reactions and dehydration reactions in route 2 to produce more aromatic hydrocarbons. This might be the reason that Hβ had almost the same selectivity for C7, C8, C9, C10 + PAH (Section 3.1.2 Fig. 9).
4. Conclusions
Pyrolysis experiment results proved that lignin catalytic fast pyrolysis with HZSM-5, HY, Hβ was a promising way to obtain aromatic hydrocarbons. Among those catalysts, HZSM-5(23) provided the desired acidity and shape selectivity for aromatic hydrocarbon production. Higher CLR and higher heating rate resulted in higher aromatic hydrocarbon yield. 600 °C was the most suitable pyrolysis temperature for aromatic hydrocarbon production. 7.63 wt% of aromatic hydrocarbons and 3.34 wt% of C1–C4 alkanes and alkenes were acquired by lignin catalytic fast pyrolysis.DFT calculations showed that the BDEs for route 1 (cyclization reactions) were significantly lower than route 2 (demethylation, demethoxylation and dehydration reactions). Route 1 was a more favourable reaction pathway than route 2. Associated with experimental results, route 1 was the primary reaction pathway in catalytic pyrolysis with HZSM-5 series catalysts. As for the catalysts with larger pore size (such as Hβ), both route 1 and route 2 were important reaction pathways.
Conflicts of interest
There are no conflicts to declare.Acknowledgements
The authors of this paper gratefully acknowledge the financial support from the National Key R&D Program of China (2018YFB1501405).References
- T. R. Carlson, G. A. Tompsett, W. C. Conner and G. W. Huber, Top. Catal., 2009, 52, 241–252 CrossRef CAS
.
- Wikipedia, https://en.wikipedia.org/wiki/BTX_(chemistry)) Search PubMed.
- Y. Yang, Z. Luo, W. Chen, G. Li, K. Lu and H. Zhang, Energy Procedia, 2014, 61, 4 Search PubMed
.
- C. A. Mullen and A. A. Boateng, Fuel Process. Technol., 2010, 91, 1446–1458 CrossRef CAS
.
- K. Wang, K. H. Kim and R. C. Brown, Green Chem., 2014, 16, 727–735 RSC
.
- J.-Y. Kim, J. H. Lee, J. Park, J. K. Kim, D. An, I. K. Song and J. W. Choi, J. Anal. Appl. Pyrolysis, 2015, 114, 273–280 CrossRef CAS
.
- D. J. Nowakowski, A. V. Bridgwater, D. C. Elliott, D. Meier and P. de Wild, J. Anal. Appl. Pyrolysis, 2010, 88, 53–72 CrossRef CAS
.
- H. Ben and A. J. Ragauskas, ACS Sustainable Chem. Eng., 2013, 1, 316–324 CrossRef CAS
.
- T. R. Carlson, T. P. Vispute and G. W. Huber, ChemSusChem, 2008, 1, 397–400 CrossRef CAS
.
- T. R. Carlson, J. Jae and G. W. Huber, ChemCatChem, 2009, 1, 107–110 CrossRef CAS
.
- A. J. Foster, J. Jae, Y.-T. Cheng, G. W. Huber and R. F. Lobo, Appl. Catal., A, 2012, 423–424, 154–161 CrossRef CAS
.
- Y. T. Cheng, Z. Wang, C. J. Gilbert, W. Fan and G. W. Huber, Angew. Chem., Int. Ed. Engl., 2012, 51, 11097–11100 CrossRef CAS PubMed
.
- G. Zhou, P. A. Jensen, D. M. Le, N. O. Knudsen and A. D. Jensen, Green Chem., 2016, 18, 1965–1975 RSC
.
- Z. Ma, E. Troussard and J. A. van Bokhoven, Appl. Catal., A, 2012, 423–424, 130–136 CrossRef CAS
.
- S. D. Stefanidis, K. G. Kalogiannis, E. F. Iliopoulou, C. M. Michailof, P. A. Pilavachi and A. A. Lappas, J. Anal. Appl. Pyrolysis, 2014, 105, 143–150 CrossRef CAS
.
- H. Yang, R. Yan, H. Chen, D. H. Lee and C. Zheng, Fuel, 2007, 86, 1781–1788 CrossRef CAS
.
- Z. Ma, Q. Sun, J. Ye, Q. Yao and C. Zhao, J. Anal. Appl. Pyrolysis, 2016, 117, 116–124 CrossRef CAS
.
- J. Zhang, Z. Luo, Q. Dang, J. Wang and W. Chen, Energy Fuels, 2012, 26, 2990–2995 CrossRef CAS
.
- Q. Dang, Z. Luo, J. Zhang, J. Wang, W. Chen and Y. Yang, Fuel, 2013, 103, 683–692 CrossRef CAS
.
- S. Wang, B. Ru, G. Dai, Z. Shi, J. Zhou, Z. Luo, M. Ni and K. Cen, Proc. Combust. Inst., 2017, 36, 2225–2233 CrossRef CAS
.
- M. Zhang, F. L. P. Resende and A. Moutsoglou, Fuel, 2014, 116, 358–369 CrossRef CAS
.
- H. W. Lee, Y.-M. Kim, J. Jae, B. H. Sung, S.-C. Jung, S. C. Kim, J.-K. Jeon and Y.-K. Park, J. Anal. Appl. Pyrolysis, 2016, 122, 282–288 CrossRef CAS
.
- P. Giudicianni, G. Cardone and R. Ragucci, J. Anal. Appl. Pyrolysis, 2013, 100, 213–222 CrossRef CAS
.
- C. Li, X. Zhao, A. Wang, G. W. Huber and T. Zhang, Chem. Rev., 2015, 115, 11559–11624 CrossRef CAS
.
| This journal is © The Royal Society of Chemistry 2019 |

