DOI:
10.1039/C9RA04184B
(Paper)
RSC Adv., 2019,
9, 25189-25198
Electricity generation, salinity, COD removal and anodic biofilm microbial community vary with different anode CODs in a microbial desalination cell for high-salinity mustard tuber wastewater treatment
Received
3rd June 2019
, Accepted 22nd July 2019
First published on 13th August 2019
Abstract
A three-chamber microbial desalination cell (MDC) was constructed for high-salinity mustard tuber wastewater (MTWW) treatment. The effect of anode COD on electricity generation, salinity, COD removal and the anodic biofilm microbial community in MDC for the MTWW treatment was investigated. The results showed that electricity generation was better when the anode COD was 900 mg L−1 versus when it was 400 or 1400 mg L−1. The ionic strength and conductivity of the anolyte were higher than those at 400 mg L−1; thus, the ohmic internal resistance was lower. In addition, the mass transfer internal resistance was lower than that at 1400 mg L−1, which made the system internal resistance the lowest; consequently, the voltage and power density were the highest. The output voltage, power density and coulombic efficiency of the 1000 Ω external resistors were 555 mV, 3.03 W m−3 and 26.5% ± 0.4%, respectively. Desalination was the highest when the anode COD was 400 mg L−1. The lowest ionic strength and osmotic pressure of the anolyte resulted in the strongest osmosis, thereby producing the highest desalination rate; the desalination rate was 5.33 mg h−1. When MDC was coupled with the dual-chamber microbial fuel cell (MFC), the desalinated MTWW could be used as the anode substrate of the MFC; its high COD could be removed continuously, and the COD removal values were 86.2% ± 2.5%, 83.0% ± 2.0% and 84.3% ± 2.4%. High-throughput sequencing analysis indicated that hydrolytic and fermentative bacteria were the core anode bacteria of MDC. The abundances of electrochemically active bacteria in the anode biofilms of the three groups were 11.78% (400 mg L−1 COD), 14.06% (900 mg L−1 COD) and 13.68% (1400 mg L−1 COD). Therefore, the differences in anode CODs impacted the abundance of electrochemically active bacteria, which led to differences in electricity generation performances.
Introduction
A large amount of mustard tuber wastewater (MTWW) is produced during the production and processing of mustard. The quality of MTWW is complex; the salinity and concentration are high, and it is difficult to degrade, which has a great impact on the environment receiving the water.1 As high salinity has an inhibitory effect on microorganisms, it is difficult to efficiently treat MTWW by traditional biological methods. Reverse osmosis, ion exchange and electrodialysis can only remove salinity; it is difficult to remove pollutants from MTWW, and the cost is high. The concept of a microbial desalination cell (MDC) provides a new idea for the desalination of salt water.2 MDC is based on the structure of a microbial fuel cell (MFC) combined with the principle of electrodialysis. It uses a cation exchange membrane and an anion exchange membrane to create a desalination chamber between the anodic and cathodic chambers of MFC. The electrogenic bacteria in the anodic chamber use an organic substrate to generate electrons, which are conducted to the cathodic electrode through an external circuit to contact the electron acceptor and generate an electric current.3 Under the action of the generated electric field and osmosis, Na+ and Cl− from MTWW in the desalination chamber enter the cathodic chamber and the anodic chamber through the cation exchange membrane and the anion exchange membrane, respectively, thereby achieving desalination. Consequently, the salt is ‘‘relocated” into the wastewater stream, which can considerably reduce the salt concentration in seawater.2 Electrodialysis requires an applied electric field; however, MDC uses electric energy that is generated in situ. In addition to being economical compared with electrodialysis, MDCs can achieve desalination without an external electric field,4 which is also an advantage of MDCs in MTWW treatment.
Most studies have used simulated wastewater as the MDC target treatment wastewater;5 however, studies employing actual high-salinity wastewater have not yet been reported. In addition to MTWW desalination, the elimination of high COD from the MTWW systems remains a challenge. High COD concentrations in MTWW are difficult to remove using an MDC. After salinity is addressed, anaerobic digestion, including hydrolysis, hydrogen production and acetic acid production, can be used to eliminate COD.6 In addition, single-chamber or dual-chamber MFCs can be connected in a series, and the COD in the desalinated MTWW can be used as the anode fuel to supply the dual-chamber MFC with electricity, in turn facilitating the elimination of high COD concentrations in MTWW.
The concentration of the anodic substrate is one of the main factors affecting the power generation performance and operation of MDCs.7 Sodium acetate as the single anodic organic substrate had the best effect on the electrogenic bacteria, and the concentration of sodium acetate in this study was 4 g L−1.8 Cao et al.2 set the sodium acetate concentration in the anolyte to 1.6 g L−1 and Mehanna et al.9 set the sodium acetate concentration in the anolyte to 2.0 g L−1. However, none of the three studies compared the effects of different concentrations of the anodic substrate on electricity generation and desalination in MDCs, and there was no comparison of the COD removal rates in the three cases. In addition, the anode COD was not properly optimized. Furthermore, when domestic sewage was used as the anolyte, the anode COD reached 2700 mg L−1 upon the addition of sodium acetate, which could effectively replace the simulated wastewater used to run MDCs.10 Few works have compared the effects of different anode CODs on electricity generation and desalination in MDCs for MTWW treatment. Desalination is an important goal in the MTWW treatment. How to improve the desalination rate of MDCs for the MTWW treatment while ensuring a good electricity generation performance of MDCs is also important. Also, how the anode COD affects the desalination rate during the operation of MDCs is worth exploring.
This study aimed to examine electricity generation, desalination, and anodic biofilm microbial community composition in MDCs with different anode COD concentrations (400, 900 and 1400 mg L−1) as well as the removal of high COD in MTWW when MDCs were coupled with dual-chamber MFCs while using MTWW as the target treatment wastewater. This study's findings can provide a theoretical basis for the further treatment of MTWW.
Materials and methods
MDC and dual-chamber MFC construction
Three sets of identical three-chamber MDCs were constructed. The anodic, cathodic and desalination chambers had the same effective volume of 250 cm3 with the same physical dimensions: 6 cm × 7 cm × 6 cm. The anodic and desalination chambers were separated by an anion exchange membrane (AMI-7001, Membranes International Inc., USA). The cathodic and desalination chambers were separated by a cation exchange membrane (CMI-7000, Membranes International Inc., USA). The anode electrode material was carbon felt (PAN-based carbon fibre felt, Beihai Carbon Co., Ltd.), and the cathode electrode material was carbon cloth (W1S1005, CeTech Co., Ltd). Both electrodes had an effective area of 30 cm2. The electrodes were connected through a titanium wire to a variable external resistor (0–9999.9 Ω), which formed a closed loop. In addition, three sets of identical dual-chamber MFCs were constructed. The only difference between the dual-chamber MFCs and MDCs in this test was that there was no desalination chamber in the dual-chamber MFCs. The structures of the anodic and cathodic chambers in the dual-chamber MFCs and the materials were the same as those of MDCs. The initial external resistors of the MDCs and the dual-chamber MFCs were set to 1000 Ω and remained constant during their operation.
Preparation of materials
The influent of the desalination chamber (MTWW) was taken from a mustard processing plant in Chongqing City. The MTWW was effluent from an anaerobic tank. The anolyte was based on domestic sewage, and three COD concentrations (400, 900, and 1400 mg L−1) were prepared by adding sodium acetate, as shown in Table 1. The use of domestic sewage as the basis for the anolyte could effectively save the cost of using anolyte. Domestic sewage was easily available and contained the elements required for the growth of anode microorganisms. The cathode was a Pt/C air-cathode; the water-facing side of the cathode was coated with the Pt/C catalyst (20%, 2.0 mg cm−2 Pt loading) as an oxygen reduction catalysis layer,11 and the catholyte was ultrapure water (conductivity was 18.25 MΩ cm). An electrolyte containing phosphate buffer is usually used as the catholyte as it facilitates the maintenance of a constant pH at the cathode, which is critical for the stable operation of an MDC.12–14 However, it was not used here because of its toxicity to Pt/C and because it could react with heavy metal ions. Moreover, the Pt/C catalyst without modification is less tolerant to poisoning, which would influence the catalytic reaction at the MDC cathode.15 The cathode of the dual-chamber MFCs was the same as that in the MDCs, and the anolyte of the dual-chamber MFC was the desalinated MTWW from MDC. All the other reagents used in the experiment were of analytical grade.
Table 1 Characteristics of anaerobic reactor effluent and domestic sewage
| Samples |
Salinity (NaCl, g L−1) |
Conductivity (mS cm−1) |
COD (mg L−1) |
NH4+–N (mg L−1) |
NO3− (mg L−1) |
NO2− (mg L−1) |
pH |
| Anaerobic reactor effluent |
19.02 ± 0.05 |
38.1 ± 0.1 |
2000 ± 20 |
160.13 ± 3.4 |
3.00 ± 0.03 |
0.005 ± 0.00 |
7.12 ± 0.11 |
| Domestic sewage |
— |
— |
106 ± 0.88 |
35.03 ± 0.17 |
1.00 ± 0.05 |
0.001 ± 0.00 |
7.67 ± 0.33 |
MDC and dual-chamber MFC operation
The data collector was connected in parallel with the copper wire to both ends of the external resistor to collect the output voltage of MDC. When the reactor was started, anolytes of 400, 900 and 1400 mg L−1 COD and anaerobic mud were added to the anodic chamber; MTWW was added to the desalination chamber, and the cathodic chamber was filled with ultrapure water. The inlet and outlet holes of the anodic chamber were sealed with tape to maintain an anaerobic state. When the output voltage was lower than 50 mV, the anolyte was replaced, and it was considered that a power generation cycle was completed. The start-up was considered successful when the output voltages were not significantly different for three consecutive cycles. Except for the differences in anode COD, the other experimental materials and conditions were the same, and all three systems were operated intermittently. The three groups of desalinated MTWW were respectively used as the anode influents of the dual-chamber MFCs, and the cathodic chambers of the dual-chamber MFCs were also filled with ultrapure water to operate.
Detection indicators and methods
The reactor output voltage was recorded by a data collector (DAS, PISO-813u, Hongge Co. Ltd., Taiwan) every 1 min and stored in a computer, with an external resistor set at 1000 Ω. The current (A) generated in the MDC was calculated as I = U/R, where U (V) is the output voltage, and R (Ω) is the external resistance. The volume power density (W m−3) of the MDC was calculated as Pv = IU/VA, where I (A) is the output current, and U (V) and VA (m3) are the output voltage and effective volume of the anodic chamber, respectively. Coulombic efficiency (%) was calculated using the following equation: CE = Qout/Qin × 100%, where Qout is the anode electron output, and Qin is the anode substrate consumption. Qout was calculated using the following equation: Qout = ∑(It), where I (A) is the output current, and t (h) is the time taken for an anolyte change cycle. Qin was calculated using the following equation: Qin = F × 4 × (CODin − CODout) × VA/32, where F (C mol−1) is the Faraday constant (the value is 96![[thin space (1/6-em)]](https://www.rsc.org/images/entities/char_2009.gif) 485), CODin (g L−1) is the COD concentration in the influent of the anodic chamber, CODout (g L−1) is the COD concentration in the effluent of the anodic chamber, and VA (m3) is the effective volume of the anodic chamber.16 Salinity and conductivity were measured using a conductivity meter (FE-30K, Mettler Toledo), and pH and DO were detected by a portable instrument (Sension1, HACH Co., USA). COD was measured using a fast digestion analyser and an ultraviolet spectrophotometer (DRB200 & DR5000, HACH Co., USA).
485), CODin (g L−1) is the COD concentration in the influent of the anodic chamber, CODout (g L−1) is the COD concentration in the effluent of the anodic chamber, and VA (m3) is the effective volume of the anodic chamber.16 Salinity and conductivity were measured using a conductivity meter (FE-30K, Mettler Toledo), and pH and DO were detected by a portable instrument (Sension1, HACH Co., USA). COD was measured using a fast digestion analyser and an ultraviolet spectrophotometer (DRB200 & DR5000, HACH Co., USA).
High-throughput sequencing analysis
To compare the bacterial communities on the three sets of anodic biofilms, the microbe-enriched electrodes were collected and immediately stored at −80 °C. Microbial DNA was extracted from the anodic biofilm, and electrode samples were prepared using the E.Z.N.A.® soil DNA Kit (Omega Bio-tek, Norcross, GA, USA). The V4–V5 region of the bacterial 16S ribosomal RNA gene was amplified by PCR with the primer set 338F (5′-ACTCCTACGGGAGGCAGCAG-3′) and 806R (5′-GGACTACHVGGGTWTCTAAT-3′).17 PCR was performed in an ABI GeneAmp®9700 (Applied Biosystems, USA) using the following steps: initial denaturation at 95 °C for 3 min, followed by 27 cycles of denaturing at 95 °C for 30 s, annealing at 55 °C for 30 s, extension at 72 °C for 45 s and a final extension at 72 °C for 10 min.18 After the PCR products were purified and quantified, high-throughput sequencing was performed on an Illumina MiSeq platform (Majorbio Bio-Pharm Technology Co., Ltd., Shanghai, China), according to the standard protocols. All sequence reads were clustered into operational tax units (OTU) (the similarity threshold was 97%).
Results and discussions
Effect of anode COD on MDC electricity generation
Under a load with an external resistance of 1000 Ω, the output voltages were measured to determine electricity generation, as shown in Fig. 1. The results showed that there were significant differences in the electricity generation cycles of the three groups of MDCs. The durations of single stable electricity generation cycle were approximately 40 h (400 mg L−1 COD), 60 h (900 mg L−1 COD) and 110 h (1400 mg L−1 COD). In addition, there were some differences in the peak voltages of the three MDCs. The peak voltages were 485 mV (400 mg L−1 COD), 555 mV (900 mg L−1 COD) and 500 mV (1400 mg L−1 COD). The peak voltage did not increase continuously as the concentration of the anode organic substrate increased.19
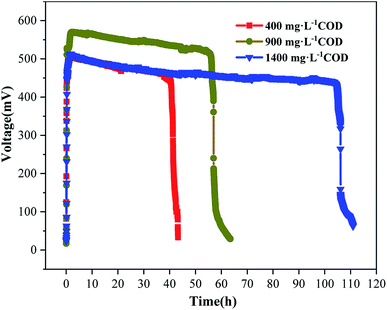 |
| | Fig. 1 Voltage output of single stable electricity generation cycle under 400, 900 and 1400 mg L−1 COD in the anode. | |
After the battery was stably operated for three cycles, the battery power density curves and polarization curves were measured using a method of changing the external resistance by gradient. The maximum power densities of the three groups were 2.01 W m−3, 3.03 W m−3 and 2.79 W m−3 (Fig. 2a). The open circuit voltages and internal resistances of the three systems were 780 mV and 80.56 Ω (400 mg L−1 COD), 783 mV and 55.45 Ω (900 mg L−1 COD) and 785 mV and 63.47 Ω (1400 mg L−1 COD), respectively (Fig. 2a). When the open circuit voltage was substantially the same, the power density of the battery depended on the polarization of the system, which was determined by the combination of anode and cathode polarization.20 There was no significant difference in the cathode polarization of the three systems, but there was a difference in their anode polarization (Fig. 2b). The main reason for this result is the differences in anode CODs. There was no significant difference in the activation internal resistance of the three systems, but the ohmic internal resistance at 400 mg L−1 COD was larger than those at 900 mg L−1 COD and 1400 mg L−1 COD. This might be because the anolyte was based on domestic sewage and prepared by adding sodium acetate. When the anode substrate concentration was low, the ionic strength and conductivity of the solution were also low, and the ohmic internal resistance was greatly affected by the ionic strength of the solution.21 When the ohmic internal resistance of the anode chamber was relatively large, the anode polarization was severe, and the output voltage and power density were low. The internal resistance of the 900 mg L−1 COD anode was lower than that of the 1400 mg L−1 COD anode; the ohmic internal resistances of the two were similar, but the mass transfer internal resistance of the former was lower (Fig. 2a). The reason for this result might be that when the concentration of the anode substrate was high, the materials accumulated, and the resistance was large during transmission. At this time, the internal resistance of the mass transfer accounted for a large proportion of the internal resistance of the system,22 which was relatively large. Therefore, voltage and power density were slightly reduced.
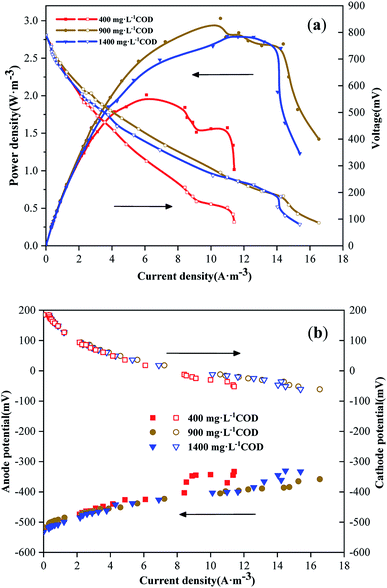 |
| | Fig. 2 (a) Power density curves and polarization curves of the MDCs with different anode CODs. (b) Electrode potential polarization curves of the MDCs with different anode CODs. | |
Anode COD removal and coulombic efficiency in MDCs
When the anode influent CODs were 400, 900 and 1400 mg L−1, the COD removal rates during the typical operation phase after a stable MDC operation were 77.8% ± 1.9%, 81.9% ± 2.1% and 80.8% ± 1.8%, respectively (Fig. 3a). The coulombic efficiencies (CE) under different COD concentrations were 15.7% ± 0.3%, 26.5% ± 0.4% and 23.1% ± 0.4% (Fig. 3b). The COD removal and CE during the stable cycle under different anode CODs were different. When the anode influent COD was 900 mg L−1, the COD removal and CE were higher than those at the other CODs. The reason for this result might be that when the anode biofilm matured, the appropriate COD concentration allowed the electrogenic microorganisms to maintain activity,23 leading to higher COD removal and CE. Lower COD concentrations could not meet the nutritional requirements of anodic microbes. A higher COD concentration also resulted in a longer cycle time; non-electrogenic microorganisms proliferated in this process and CE decreased.
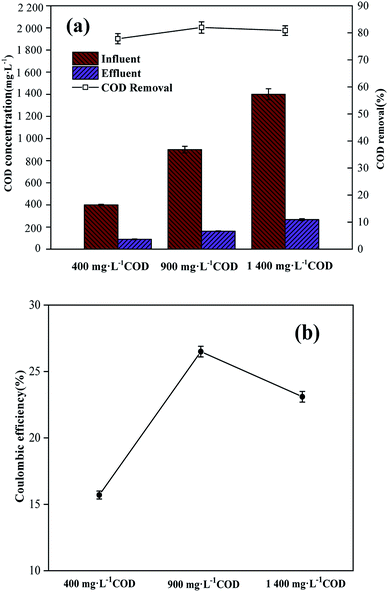 |
| | Fig. 3 (a) Anode COD removal rates during the typical operation phase when the anode influent COD concentrations were 400, 900, and 1400 mg L−1. (b) Coulombic efficiency under different anode CODs. Data are shown as mean ± standard deviation. | |
Effect of anode COD on MDC desalination
Desalination was considered to be complete when the salinity of MTWW dropped to 1 g L−1 (Fig. 4a). The desalination rates at 400, 900 and 1400 mg L−1 CODs were 5.33 ± 0.15, 4.48 ± 0.16 and 4.12 ± 0.21 mg h−1, respectively (Fig. 4b). When the anode COD was low, the desalination rate was high. The decrease in salinity of MTWW was mainly caused by the interaction of osmosis and the electric field.24 The Na+ and Cl− ions in the MTWW migrated to the cathode chamber and the anode chamber under the electric field, respectively. When the conductivity of the anolyte was lower than the conductivity of the MTWW, there was a difference in the osmotic pressures between the anode chamber and the desalination chamber. When the electric field was essentially the same, the effect of osmosis on desalination was greater. When the anode COD was low, the ionic strength and osmotic pressure of the solution were low, the osmotic pressure difference between the anolyte and the MTWW was large, and the osmotic action was enhanced. Therefore, the desalination cycle was short and the desalination rate was high. In addition, with time, we can observe that the slope of the fold line in Fig. 4a gradually becomes low, which means that the desalination rate gradually declines.25 The reason for this result might be that during the desalination process, the conductivity of MTWW continued to decrease, resulting in a large ohmic internal resistance of the desalination chamber,26 decrease in current, slow ion migration and low desalination rate.
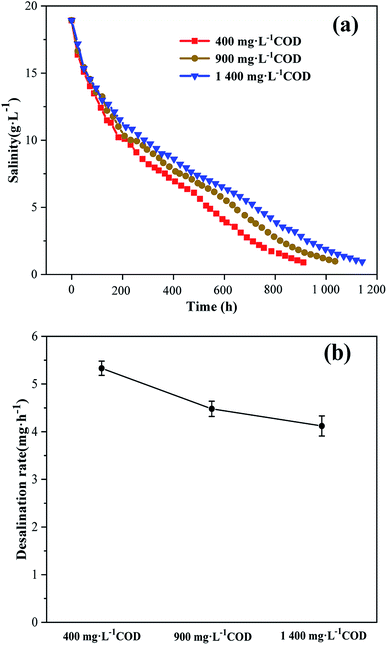 |
| | Fig. 4 (a) The salinity of MTWW under different anode CODs. (b) Desalination rate in MDC under different anode CODs. Data are shown as mean ± standard deviation. | |
Table 2 compares the electricity generation and desalination performance results obtained in this study with those obtained from different reported MDC systems. Wen et al.27 obtained a maximum power density of 5.08 W m−3 in an air-cathode MDC when the anode COD concentration was 800 mg L−1, which was higher than the results obtained in this study at the anode COD concentration of 900 mg L−1. However, the COD removal rate was slightly lower than that observed in this study. The difference in power densities could be attributed to the configuration of the reactor and the volume ratio of the three chambers. The difference in the COD removal rates could be associated with the type of anaerobic sludge inoculated to the anode biofilm, leading to a difference in the microorganisms observed on the anode biofilm, in turn influencing anode COD removal. The desalination rate was slightly lower than the rate observed in this study when the anode COD concentration was 400 mg L−1, which was consistent with the higher osmotic effect and higher desalination rate when the anode COD concentration was lower. Mehanna et al.28 investigated anode COD concentrations at 1000 and 2000 mg L−1 in an air-cathode MDC and obtained the maximum power densities of 2.82 and 2.27 W m−3, respectively. In addition, the COD removal rates were 77% ± 3% and 82% ± 6%, while the desalination rates were 7.63 ± 0.3 and 6.12 ± 0.25 mg h−1. The findings were similar to the results obtained when the anode COD concentrations were 900 and 1400 mg L−1 in the present study. When the anode COD concentration was increased gradually, the maximum power density and coulombic efficiency decreased slightly and the desalination rate decreased owing to the decrease in osmosis. Zhang et al.29 studied a biocathode MDC with an anode COD concentration of 2000 mg L−1 and obtained a maximum power density of 2.14 W m−3. In addition, the COD removal rate was 82% ± 2%, and the desalination rate was 2.40 ± 0.5 mg h−1. The difference between the results mentioned above and those obtained in this study at the anode COD concentration of 1400 mg L−1 is also consistent with the above-mentioned discussion.
Table 2 Comparison of the results of the present study for electricity generation and desalination performance with other reported MDC systems
| MDC configuration |
Anode COD concentration (mg L−1) |
Maximum power density (W m−3) |
COD removal rate (%) |
Coulombic efficiency (%) |
Initial salt concentration (g L−1) |
Desalination rate (mg h−1) |
Reference source |
| Air-cathode MDC |
800 |
5.08 |
76% ± 4% |
30% ± 6% |
20 |
3.37 ± 0.19 |
Wen et al.27 |
| Air-cathode MDC |
1000 |
2.82 |
77% ± 3% |
68% ± 11% |
20 |
7.63 ± 0.3 |
Mehanna et al.28 |
| Air-cathode MDC |
2000 |
2.27 |
82% ± 6% |
66% ± 11% |
20 |
6.12 ± 0.25 |
| Up-flow MDC |
4000 |
30.8 |
80% ± 2% |
58% ± 7% |
30.8 |
12.58 ± 0.3 |
Jacobson et al.8 |
| Biocathode MDC |
2000 |
2.14 |
82% ± 2% |
35% ± 4% |
20 |
2.40 ± 0.5 |
Zhang et al.29 |
| Air-cathode MDC |
400 |
2.01 |
77.8% ± 1.9% |
15.7% ± 0.3% |
18.93 |
5.33 ± 0.15 |
Present study |
| Air-cathode MDC |
900 |
3.03 |
81.9% ± 2.1% |
26.5% ± 0.4% |
18.93 |
4.48 ± 0.16 |
Present study |
| Air-cathode MDC |
1400 |
2.79 |
80.8% ± 1.8% |
23.1% ± 0.4% |
18.93 |
4.12 ± 0.21 |
Present study |
The removal of high COD in MTWW using MDC coupled with dual-chamber MFC
High salinity removal in MTWW was examined simultaneously with high COD removal. The COD removal data in MTWW are illustrated in Fig. 5. In the MDC desalination process, the COD concentration of the MTWW samples in the desalination chambers of the three reactors did not change considerably, and the high COD was not effectively removed (Fig. 5a). The MDC had no obvious effect on the removal of high COD in MTWW. The COD substances could not be transported through the anion–cation exchange membrane, and the COD-depleting substances were absent in the desalination chamber. Therefore, the high COD concentration of MTWW required further treatment. After desalination, MTWW from the three reactors was introduced into the anode of the dual-chamber MFCs as the anolyte. The high COD in MTWW could be used as a fuel for the microorganisms in the anode biofilm, which facilitated COD removal from MTWW after desalination and electricity generation in the MFCs.30 When coupled with the dual-chamber MFCs, the COD of the MTWW after desalination was eliminated, and the COD removal rates were 86.2% ± 2.5%, 83.0% ± 2.0% and 84.3% ± 2.4% (Fig. 5b). The high COD content in MTWW under different anode CODs could be removed by coupling with the dual-chamber MFC. The anode COD in MDCs influenced the subsequent coupling weakly, and the differences in CODs among the three groups of desalinated MTWW were not significant. As a fuel for the dual-chamber MFC anode, the COD in MTWW could be effectively removed. The COD removal times of the three sets of dual-chamber MFCs, which represent the electricity generation cycle by the dual-chamber MFCs, were somewhat similar. The cycle took approximately 5 days.
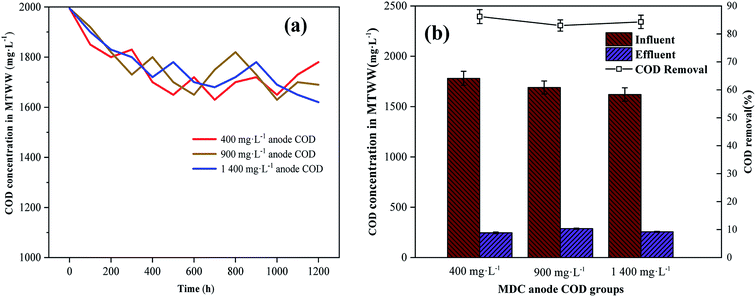 |
| | Fig. 5 (a) COD of MTWW under different anode CODs. (b) COD and COD removal in MTWW after coupling the MDCs with dual-chamber MFCs. Data are shown as mean ± standard deviation. | |
Bacterial diversities of MDC anodic biofilms
The abundance and evenness of biodiversity in the three groups of anode biofilms were determined by high-throughput sequencing analysis, as shown in Table 3. The Shannon index is commonly used to characterise species diversity in a microbial community because it accounts for both the abundance and evenness of the species;17 its values were 4.59, 4.53 and 4.41 for the three groups. The Shannon index of the anode biofilm with 900 mg L−1 COD was larger than those of the other two, suggesting that the OTUs in the anode biofilm community with 900 mg L−1 COD were distributed more evenly than those in the other two. The total numbers of OTUs were 386, 365 and 352 for the three groups. Meanwhile, the highest Simpson index for the anode biofilm community also predicted that there was less diversity compared with the others.18 In this study, the Simpson indices were 0.0265, 0.0273 and 0.0280, indicating that the anode biofilm with 400 mg L−1 COD exhibited less diversity than the other two. The Chao indices were 439.31, 401.22 and 388.70, indicating that different anode CODs led to differences in microbial richness. In summary, the anode biofilm with 900 mg L−1 COD exhibited higher microbial richness and diversity than the other two, which might be one of the reasons for its high electricity generation performance.
Table 3 Bacterial diversities of MDC anodic biofilms
| Samples |
Shannon |
Simpson |
OTU |
Ace |
Chao |
Good's coverage |
| 900 mg L−1 |
4.59 |
0.0265 |
386 |
437.57 |
439.31 |
0.998 |
| 1400 mg L−1 |
4.53 |
0.0273 |
365 |
403.67 |
401.22 |
0.998 |
| 400 mg L−1 |
4.41 |
0.0280 |
352 |
383.99 |
388.70 |
0.996 |
Bacterial community analysis of MDC anodic biofilms at the phylum level
A bacterial phylum with microbiological detection frequency > 1% is considered to be the main bacterial phylum.31 At the level of phylum, the bacterial communities obviously changed among the three groups of the anode biofilms, as shown in Fig. 6. Eight major bacterial phyla were found in the three groups of anode biofilms: Bacteroidetes, Synergistetes, Firmicutes, Proteobacteria, Hyd24-12, Chloroflexi, Spirochaetae, and Actinobacteria. The microbial floras in the anode biofilm with different anode CODs were similar, but the relative abundances differed. Moreover, Bacteroidetes, Synergistetes, Firmicutes and Proteobacteria were the dominant bacterial phyla and also the main electrogenic bacteria,17 which realized the electricity generation process in MDCs. A previous study has suggested the phylum Proteobacteria to be one of the most common electrochemically active bacteria powering MFCs, and their sudden decline might be the main cause for the deterioration of the MFC performance over time.32 The total relative abundances of the four kinds of electrogenic bacteria in the three groups of anode biofilms were 82.03% (900 mg L−1 COD), 80.15% (1400 mg L−1 COD) and 72.89% (400 mg L−1 COD). The total relative abundances of the electrogenic bacteria in the anode biofilms at 900 and 1400 mg L−1 CODs were not very different, but the difference between those at 400 mg L−1 COD and the other two groups was large, which also corresponded to the differences in the output voltages among the three COD concentrations. The difference in the relative abundances of the electrogenic bacteria might be due to the difference in output voltages and power densities.
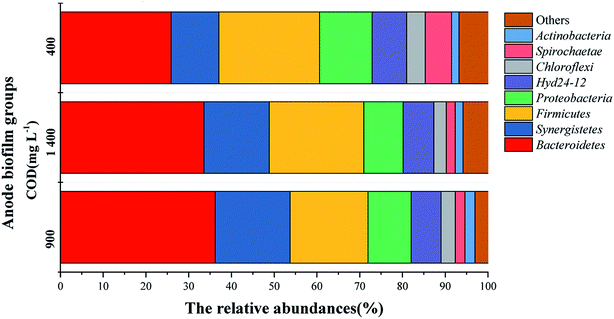 |
| | Fig. 6 Percentage of community abundance at the phylum level in the anodic biofilms formed under different anode CODs. | |
Functional microorganism group analysis of MDC anodic biofilms
The bacterial genus of the relative abundance > 1% is regarded as the main genus. When the anode COD was 400 mg L−1, the dominant bacteria in the anode biofilm were Lentimicrobium (15.73%), Pseudomonas (9.87%) and Hyd24-12_norank (7.00%), as shown in Fig. 7a. When the anode COD was 900 mg L−1, the dominant bacteria in the anode biofilm were WCHB1-69_norank (15.52%), Pseudomonas (9.70%) and Lentimicrobium (7.88%) (Fig. 7b). When the anode COD was 1400 mg L−1, the dominant bacteria in the anode biofilm were Lentimicrobium (16.32%), WCHB1-69_norank (13.56%) and Pseudomonas (10.12%) (Fig. 7c). Lentimicrobium is a strictly anaerobic genus belonging to Bacteroidetes. WCHB1-69_norank is an unclassified genus belonging to Sphingobacteriales and is obtained from a chlorinated-solvent-contaminated aquifer.33 The genus Pseudomonas is a heterotrophic denitrifying genus belonging to the Proteobacteria phylum. Pseudomonas are electrochemically active bacteria. In the BES system, electrochemically active bacteria were capable of delivering the generated electrons to the outside of the cell. Pseudomonas are considered to be one of the most common and efficient electrochemically active bacteria and are widely used in anaerobic bioanodes for beer wastewater treatment.34 Desulfovibrio (belonging to Desulfovibrionaceae), which reduces sulphates, was reported to be electrochemically active in an anaerobic environment.35 The abundances of these two electrochemically active bacteria in the three groups of anode biofilms were 11.78% (400 mg L−1 COD), 14.06% (900 mg L−1 COD) and 13.68% (1400 mg L−1 COD). In the three groups of anode biofilms, the types of electrochemically active bacteria were similar, but their abundances differed, which contributed to differences in the electricity generation performances of the three groups. When the anode COD was 900 mg L−1, the abundance of electrochemically active bacteria in the anode biofilm was higher than those in the other two, which is also the reason for its better electricity generation performance.
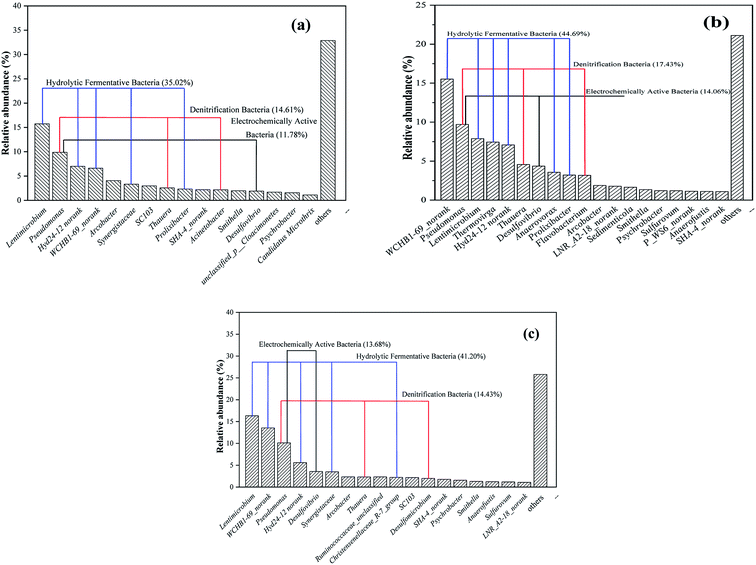 |
| | Fig. 7 Relative abundances of bacterial communities of the MDC anodic biofilms at the genus level when the anode CODs were 400 mg L−1 (a); 900 mg L−1 (b); 1400 mg L−1 (c). | |
In a previous study, Lentimicrobium, Hyd24-12_norank, Synergistaceae, Prolixibacter, and Thermovirga were some of the most common hydrolytic/fermentative bacteria in the anode.36 The main hydrolytic/fermentative bacteria identified here were related to Lentimicrobium, Hyd24-12_norank, WCHB1-69_norank and Thermovirga (Fig. 7). Thermovirga has also been demonstrated to be a type of sulphate-reducing bacteria (SRB) in a previous study.37 The total abundances of the hydrolytic/fermentative bacteria in the three groups of anode biofilms were 35.02% (400 mg L−1 COD), 44.69% (900 mg L−1 COD) and 41.20% (1400 mg L−1 COD). The hydrolytic/fermentative bacteria are the core microorganisms of the anode biofilm.17 In addition, denitrifying bacteria were also detected in the three groups of anode biofilms with total abundances of 14.61% (400 mg L−1 COD), 17.43% (900 mg L−1 COD) and 14.43% (1400 mg L−1 COD). In a previous study, Thauera and Pseudomonas were reported to be the more common denitrification genera. The Thauera bacteria have been proven to be highly efficient hydrogen-oxidizing autotrophic denitrifying bacteria.38 Denitrification bacteria were found on the anode biofilms in this study, suggesting that there might be some degree of denitrification in the anode.
Conclusions
The anode COD affected the electricity generation and desalination performances of MDCs. When the anode COD was 900 mg L−1, the MDC exhibited a better electricity generation performance; the output voltage, power density and coulombic efficiency of the 1000 Ω external resistors were 555 mV, 3.03 W m−3 and 26.5% ± 0.4%, respectively. In terms of desalination, when the anode COD was 400 mg L−1, the desalination rate was better than the other two, i.e., 5.33 mg h−1. The decrease in the salinity of MTWW was mainly caused by the interaction of osmosis and the electric field. The high COD in MTWW could be continuously removed when introduced as the anode substrate in the dual-chamber MFC. When the MDC was coupled with the dual-chamber MFC, the COD of the desalinated MTWW was effectively removed, and the COD removal rates were 86.2% ± 2.5%, 83.0% ± 2.0% and 84.3% ± 2.4%. High-throughput sequencing analysis indicated that hydrolytic/fermentative bacteria were the core anode bacteria of the MDCs. The total abundances of the hydrolytic/fermentative bacteria in the three groups of anode biofilms were 35.02% (400 mg L−1 COD), 44.69% (900 mg L−1 COD) and 41.20% (1400 mg L−1 COD). The electrochemically active bacteria in the anode biofilms were responsible for power generation. The abundances of the electrochemically active bacteria in the three groups of anode biofilms were 11.78% (400 mg L−1 COD), 14.06% (900 mg L−1 COD) and 13.68% (1400 mg L−1 COD). Therefore, different anode CODs affected the abundance of the electrochemically active bacteria of the anode, which led to differences in electricity generation performances.
Conflicts of interest
There are no conflicts to declare.
Acknowledgements
This work has been funded by the Fundamental Research Funds for the Central Universities, China (No. 2019CDXYCH0027), the graduate research and innovation foundation of Chongqing, China (Grant No. CYB18039) and the National Natural Science Foundation of China (No. 51778082). The authors would like to thank the anonymous reviewers for their helpful comments.
References
- P. L. Mccary, J. Bae and J. Kim, Environ. Sci. Technol., 2011, 45, 7100–7106 CrossRef PubMed.
- X. X. Cao, X. Huang, P. Liang, K. Xiao, Y. J. Zhou, X. Y. Zhang and B. E. Logan, Environ. Sci. Technol., 2009, 43, 7148–7152 CrossRef CAS PubMed.
- F. X. Li, Q. X. Zhou and B. K. Li, Chin. J. Appl. Ecol., 2009, 20, 3070–3074 CAS.
- J. Yoon, V. Q. Do, V. S. Pham and J. Han, Water Res., 2019, 159, 501–510 CrossRef CAS PubMed.
- X. L. Cao, B. G. Zhang, Z. J. Wang, S. G. Zhou and C. H. Shi, Technology of Water Treatment, 2015, 41, 7–10 CAS , 16.
- D. N. Ruan, Z. Zhou, H. J. Pang, J. Yao, G. Chen and Z. Qiu, Bioresour. Technol., 2019, 289, 121643 CrossRef CAS PubMed.
- B. Gao, L. J. Yuan and Z. W. Li, Chin. J. Environ. Eng., 2014, 8, 4774–4781 CAS.
- K. S. Jacobson, D. M. Drew and Z. He, Bioresour. Technol., 2011, 102, 376–380 CrossRef CAS PubMed.
- M. Mehanna, P. D. Kiely, D. F. Call and B. E. Logan, Environ. Sci. Technol., 2010, 44, 9578–9583 CrossRef CAS PubMed.
- H. P. Luo, P. E. Jenkins and Z. Y. Ren, Environ. Sci. Technol., 2011, 45, 340–344 CrossRef CAS PubMed.
- Q. Wen, Z. M. Liu, Y. Chen, K. F. Li and N. Z. Zhu, Acta Phys.-Chim. Sin., 2008, 24, 1063–1067 CAS.
- C. Y. Ma and C. H. Hou, Sci. Total Environ., 2019, 675, 41–50 CrossRef CAS PubMed.
- P. Y. Ren, S. Q. Ci, Y. C. Ding and Z. H. Wen, Appl. Surf. Sci., 2019, 481, 1206–1212 CrossRef CAS.
- L. R. Kalankesh and M. A. Zazouli, Desalin. Water Treat., 2019, 147, 83–89 CrossRef.
- P. Kanninen and T. Kallio, J. Energy Chem., 2018, 27, 1446–1452 CrossRef.
- S. J. You, Q. L. Zhao, J. N. Zhang, J. Q. Jiang, C. L. Wan, M. A. Du and S. Q. Zhao, J. Power Sources, 2007, 173, 172–177 CrossRef CAS.
- L. F. Zhang, G. K. Fu and Z. Zhang, Bioelectrochemistry, 2019, 126, 20–28 CrossRef CAS PubMed.
- L. F. Zhang, G. K. Fu and Z. Zhang, Bioresour. Technol., 2019, 272, 105–113 CrossRef CAS PubMed.
- G. C. Gil, I. S. Chang, B. H. Kim, M. Kim, J. K. Jang, H. S. Park and H. J. Kim, Biosens. Bioelectron., 2003, 18, 327–334 CrossRef CAS PubMed.
- G. D. Zhang, K. Wang, Q. L. Zhao, Y. Jiao and D. J. Lee, Bioresour. Technol., 2012, 118, 249–256 CrossRef CAS PubMed.
- A. Tremouli, A. Intzes, P. Intzes, S. Bebelis and G. Lyberatos, J. Appl. Electrochem., 2015, 45, 755–763 CrossRef CAS.
- A. N. Ghadge, D. A. Jadhav, H. Pradhan and M. M. Ghangrekar, Bioresour. Technol., 2015, 182, 225–231 CrossRef CAS PubMed.
- G. K. Fu, L. F. Zhang, F. Guo, J. Liu and Z. Zhang, China Environ. Sci., 2017, 37, 1401–1407 Search PubMed.
- D. D. Ma, R. Y. Li, C. Forrestal, Z. Y. Ren and M. Ji, Acta Sci. Circumstantiae, 2014, 34, 1375–1380 CAS.
- H. P. Luo, P. Xu and Z. Y. Ren, Bioresour. Technol., 2012, 120, 187–193 CrossRef CAS PubMed.
- Y. P. Qu, Y. J. Feng, X. Wang, J. Liu, J. G. Lv, W. H. He and B. E. Logan, Bioresour. Technol., 2012, 106, 89–94 CrossRef CAS PubMed.
- Q. X. Wen, H. C. Zhang, Z. Q. Chen, Y. F. Li, J. Nan and Y. J. Feng, Bioresour. Technol., 2012, 125, 108–113 CrossRef CAS PubMed.
- M. Mehanna, T. Saito, J. L. Yan, M. Hickner, X. X. Cao, X. Huang and B. E. Logan, Energy Environ. Sci., 2010, 3, 1114–1120 RSC.
- L. F. Zhang, G. K. Fu and Z. Zhang, Bioresour. Technol., 2019, 289, 121630 CrossRef CAS PubMed.
- J. C. Sun, Y. Zhang, X. Y. Dong, M. X. Chen and J. T. Zhou, J. Chem. Technol. Biotechnol., 2015, 90, 1692–1698 CrossRef CAS.
- C. Y. Gao, W. M. Wu, Y. H. Zhao, A. J. Wang, N. Q. Ren, M. Wang and Y. G. Zhao, Acta Microbiol. Sin., 2015, 55, 1495–1504 Search PubMed.
- H. Rismani-Yazdi, S. M. Carver, A. D. Christy, Z. Yu, K. Bibby, J. Peccia and O. H. Tuovinen, Bioresour. Technol., 2013, 129, 281–288 CrossRef CAS PubMed.
- M. Xu, X. Chen, M. D. Qiu, X. W. Zeng, J. Xu, D. Y. Deng, J. P. Sun, X. Li and J. Guo, PLoS One, 2012, 7, e30439 CrossRef CAS PubMed.
- A. Sotres, L. Tey, A. Bonmati and M. Vinas, Bioelectrochemistry, 2016, 111, 70–82 CrossRef CAS PubMed.
- A. J. Lewis and A. P. Borole, Biochem. Eng. J., 2016, 116, 95–104 CrossRef CAS.
- Y. Miao, Z. Wang, R. H. Liao, P. Shi and A. M. Li, Chem. Eng. J., 2017, 330, 757–763 CrossRef CAS.
- H. Dahle and N. K. Birkeland, Int. J. Syst. Evol. Microbiol., 2006, 56, 1539–1545 CrossRef CAS PubMed.
- Y. Mao, Y. Xia and T. Zhang, Bioresour. Technol., 2013, 128, 703–710 CrossRef CAS PubMed.
|
| This journal is © The Royal Society of Chemistry 2019 |
Click here to see how this site uses Cookies. View our privacy policy here.  Open Access Article
 ab,
Ping Xiangab,
Zhuang Duanc,
Zhaohui Fuc,
Linfang Zhangab and
Zhi Zhang*ab
![[thin space (1/6-em)]](https://www.rsc.org/images/entities/char_2009.gif) 485), CODin (g L−1) is the COD concentration in the influent of the anodic chamber, CODout (g L−1) is the COD concentration in the effluent of the anodic chamber, and VA (m3) is the effective volume of the anodic chamber.16 Salinity and conductivity were measured using a conductivity meter (FE-30K, Mettler Toledo), and pH and DO were detected by a portable instrument (Sension1, HACH Co., USA). COD was measured using a fast digestion analyser and an ultraviolet spectrophotometer (DRB200 & DR5000, HACH Co., USA).
485), CODin (g L−1) is the COD concentration in the influent of the anodic chamber, CODout (g L−1) is the COD concentration in the effluent of the anodic chamber, and VA (m3) is the effective volume of the anodic chamber.16 Salinity and conductivity were measured using a conductivity meter (FE-30K, Mettler Toledo), and pH and DO were detected by a portable instrument (Sension1, HACH Co., USA). COD was measured using a fast digestion analyser and an ultraviolet spectrophotometer (DRB200 & DR5000, HACH Co., USA).


