
 Open Access Article
 This Open Access Article is licensed under a Creative Commons Attribution-Non Commercial 3.0 Unported Licence
TiO2 nanoparticles generate superoxide and alter gene expression in human lung cells†
Dhanya T. Jayaram a,
Ashwath Kumarb,
Linda E. Kippner‡
c,
Po-Yi Ho‡b,
Melissa L. Kemp*cd,
Yuhong Fan*bd and
Christine K. Payne*a
a,
Ashwath Kumarb,
Linda E. Kippner‡
c,
Po-Yi Ho‡b,
Melissa L. Kemp*cd,
Yuhong Fan*bd and
Christine K. Payne*a
aDepartment of Mechanical Engineering and Materials Science, Duke University, Durham, NC 27708, USA. E-mail: christine.payne@duke.edu
bSchool of Biological Sciences, Georgia Institute of Technology, Atlanta, GA 30332, USA. E-mail: yuhong.fan@biology.gatech.edu
cThe Wallace H. Coulter Department of Biomedical Engineering, Georgia Institute of Technology and Emory University, Atlanta, GA 30332, USA. E-mail: melissa.kemp@bme.gatech.edu
dParker H. Petit Institute for Bioengineering and Biosciences, Georgia Institute of Technology, Atlanta, GA 30332, USA
First published on 12th August 2019
Abstract
TiO2 nanoparticles are widely used in consumer products and industrial applications, yet little is understood regarding how the inhalation of these nanoparticles impacts long-term health. This is especially important for the occupational safety of workers who process these materials. We used RNA sequencing to probe changes in gene expression and fluorescence microscopy to image intracellular reactive oxygen species (ROS) in human lung cells incubated with low, non-cytotoxic, concentrations of TiO2 nanoparticles. Experiments were designed to measure changes in gene expression following an acute exposure to TiO2 nanoparticles and changes inherited by progeny cells. We observe that TiO2 nanoparticles lead to significant (>2000 differentially expressed genes) changes in gene expression following a 24 hour incubation. Following this acute exposure, the response dissipates with only 34 differentially expressed genes in progeny cells. The progeny cells adapt to this initial exposure, observed when re-challenged with a second acute TiO2 nanoparticle exposure. Accompanying these changes in gene expression is the production of intracellular ROS, specifically superoxide, along with changes in oxidative stress-related genes. These experiments suggest that TiO2 nanoparticles adapt to oxidative stress through transcriptional changes over multiple generations of cells.
Introduction
The small size and resulting properties of nanoparticles (NPs) have led to their rapid adoption in consumer products and industrial applications, yet little is known about the long-term impact of NP exposure on human health. TiO2 particles are especially widely used: they are essential for any industry that requires whitening or anti-caking including the paint, plastics, rubber, adhesives, coatings, and paper industries.1 The Department of the Interior reported United States production of TiO2 particles at 1.2 million metric tons in 2018.2 The National Institute of Occupational Safety and Health (NIOSH) provides recommendations for TiO2 particle exposure: 2.4 mg m−3 for fine (primary particle diameter 1 μm–10 μm) and 0.3 mg m−3 for ultrafine (primary particle diameter < 100 nm) particles in the air of the work environment as a time-weighted average over a 10 hour day and a 40 hour work week.3 Based on their review of toxicology and epidemiologic literature,1 NIOSH classifies ultrafine TiO2 NPs as a potential occupational carcinogen. There was insufficient data to classify the fine TiO2 particles. TiO2 NPs have been reported to induce cellular oxidation through the generation of reactive oxygen species (ROS; singlet oxygen, superoxide, hydroxyl radicals, and peroxides).1,4–7 This has important biological consequences both through the immediate cellular effects of ROS, as well as the downstream effects on chromatin modification and the associated epigenetic changes. Here, we define cellular responses as changes in ROS levels and transcriptional up- or down-regulation after NP exposures, with some responses being transient (i.e. return to baseline) whereas sustained changes are indicative of adaptation to protect against a future oxidative insult. Of particular importance is the possibility that sub-cytotoxic doses of TiO2 NPs, which would not raise concern at a regulatory level, could lead to epigenetic imprints. For example, epigenetic modifications could lead to a signature of NP-induced stress long after exposure has passed.TiO2 NPs are very well-studied in terms of ROS generation; the ability to generate ROS has led to their use as photocatalysts.8–10 However, exposure following human inhalation occurs in the dark. Previous work by V. Colvin, et al.,11 showed that low levels of ROS were produced by TiO2 NPs in the absence of UV light resulting in cellular oxidative stress and cytotoxicity. Additional work has found that TiO2 NPs in the absence of light produce classic signatures of oxidative stress in cells including DNA damage, lipid peroxidation, and micronuclei formation.12–14 Recent research from our labs, using a combination of colorimetric and fluorimetric assays and electron paramagnetic resonance (EPR) spectroscopy, demonstrated that TiO2 NPs produce hydroxyl radicals and superoxide in the absence of UV light and that this ROS generation is correlated with TiO2 NP surface defects.15
The experiments described below were designed to identify a non-cytotoxic concentration of TiO2 NPs and then determine if this low concentration resulted in changes in gene expression in human lung cells (A549) in the absence of light. Of particular interest was how the cellular responses changed as a function of cellular propagation. We compared gene expression profiles using RNA-Seq analysis of cells immediately following a 24 h incubation with TiO2 NPs (Generation 1, acute exposure) and after 9 subsequent cell divisions (Generation 10, adaptive response). At each generation, TiO2 NP-treated cells are compared to an untreated control at the same generation to account for any changes due to passaging of cells. All experiments use biological triplicates. We also analyzed the response of the Generation 10 cells to a “re-challenge” with a second TiO2 NP exposure. If there is no adaptive response, we expect the changes in gene expression of the re-challenged cells to be identical to the initial, Generation 1, exposure. Underlying these changes in gene expression is the production of intracellular ROS probed with fluorescence microscopy in combination with ROS scavengers. Overall, these experiments demonstrate that TiO2 NP-mediated ROS is associated with changes in gene expression – including epigenetic modifiers – that lead to long-term cellular effects beyond the initial TiO2 NP exposure.
Experimental
Nanoparticles (NPs) and characterization
TiO2 NPs (21 nm, #718467, Sigma-Aldrich, St. Louis, MO) and carboxylate-modified polystyrene NPs (200 nm, #F8806, Life Technologies, Carlsbad, CA) were used for all experiments.Transmission electron microscopy (TEM) for NP characterization used a FEI Tecnai G2 TWIN at the Shared Materials Instrumentation Facility at Duke University. TiO2 NP images were obtained at 100 kV with 44k× magnification and polystyrene NPs at 120 kV with 20k× magnification. NPs were drop cast on carbon-coated copper grids (#FCF200-Cu, Electron Microscopy Sciences, Hatfield, PA) and dried at room temperature. Particle diameters were measured with ImageJ.16 Average and standard deviation are reported for all measurements. Diameter, polydispersity index, and zeta potential of the TiO2 (400 μg mL−1 in water) and polystyrene NPs (8 pM in water) were measured using dynamic light scattering (Malvern Zetasizer, Nano-Z, Malvern Instruments, Worchestershire, England). Measurements were carried out in triplicate with 3 distinct solutions. Each measurement consisted of 30 runs. Electrophoretic mobility was converted to a zeta potential using the Smoluchowski approximation.
Cell culture
A549 human lung epithelial carcinoma cells (CCL-185, ATCC, Manassas, VA) and HeLa human cervical carcinoma cells (CCL-2, ATCC) were cultured in Minimum Essential Medium (MEM, #61100, Invitrogen) supplemented with 10% fetal bovine serum (FBS, #10437028, Invitrogen) at 37 °C and 5% carbon dioxide. Cells were passaged with trypsin (#25200072, ThermoFisher Scientific) every 2–3 days. In T-25 flasks, TiO2 NPs were used at a concentration of 800 μg mL−1 for A549 cells with the working concentration determined by MTT assay. The ratio of NPs to cells was kept constant for all experiments and is reported throughout the text for experiments in well plates (12-well plates; #62406-165, VWR) and 35 mm optical dishes (#P35G-1.5-20-C, MatTek, Ashland, MA), based on the number of cells forming a confluent monolayer.Cellular viability assay
Mitochondrial activity was quantified using a Vybrant MTT Cell Proliferation Assay Kit (#V13154, Invitrogen). Cells were cultured in 12-well plates and incubated with TiO2 NPs for 24 h at 37 °C and 5% carbon dioxide. MTT absorbance was measured with a SpectraMax iD3 plate reader (Molecular Devices, Sunnyvale, CA) at 540 nm and normalized to cells in the absence of NPs. Each assay was carried out on three separate samples and the significance was determined by a two-tailed Student's t-test.H2DCF reactive oxygen species (ROS) assay
The H2DCF assay (#C6827, Invitrogen/ThermoFisher) was carried out according to the manufacturer's instructions using cells grown in 35 mm optical dishes. TiO2 NP concentrations for incubation (24 h and 48 h 37 °C or 4 °C, 10 min, as noted in the text) were 994 μg mL−1 and 773 μg mL−1 for A549 and HeLa cells, respectively. H2O2 (50 μM, 30 min, 37 °C) and polystyrene NPs (40 pM, 24 h, 37 °C) were used as controls. ROS scavenging experiments used Trolox (0.5 mM, #238813, Sigma-Aldrich), catalase (50 units per mL, #C3556, Sigma-Aldrich), and superoxide dismutase (SOD, 50 units per mL, #S9697, Sigma-Aldrich), which were co-incubated with the NPs at 37 °C for 24 h. For fluorescence microscopy, H2DCF was excited at 488 nm and emission collected at 530 nm.Dihydroethidium (DHE) superoxide assay
The DHE assay (#D11347, ThermoFisher) was carried out according to the manufacturer's instructions using A549 cells grown in 35 mm optical dishes. TiO2 NPs (994 μg mL−1) were incubated with cells for 24 h at 37 °C or 10 min at 4 °C. DHE (10 μM) was incubated with cells for 30 min and the cells were rinsed with clear MEM (x3). Control experiments were carried out with PS NPs (40 pM, 24 h, 37 °C), H2O2 (10 μM, 1 h, 4 °C), and SOD (50 units per mL, 30 min, 37 °C). For fluorescence microscopy, DHE was excited at 515 nm and emission was collected at 606 nm.RNA sequencing
A549 cells at ∼100% confluency were harvested for RNA isolation using a cell scraper (#229311, Cole-Parmer Scientific Experts, Vernon Hills, IL) and mRNA was extracted using a RNeasy Mini Kit (#74104, Qiagen, Hilden, Germany) and QIAshredder (#79656, Qiagen). RNA was further purified using the RNase-Free DNase Set (#79254, Qiagen) to remove genomic DNA. RNA sequencing was carried out by the Duke Center for Genomic and Computational Biology using an Illumina HiSeq 4000 system. All experiments were carried out using biological triplicates at matched passage number.Raw sequencing reads were quality checked and trimmed to remove low quality bases and adaptor sequences using FastQC17 and TrimGalore18 software. Clean sequencing reads of 20nt or longer were aligned to the hg19 human genome using the two pass alignment technique by the STAR RNA-Seq alignment tool.19 Reads with multiple alignments were mapped randomly to one of the possible positions. The sequencing reads alignment for each RNA-Seq library is provided in Table S1.† Gene counts were obtained using HTSeq20 for the Ensemble v75 annotation. Normalization and differential expression analysis was carried out using the DESeq2 (ref. 21) package. Heatmap and hierarchical clustering analysis was performed using Pheatmap (v. 1.0.8) with Pearson correlation.22 The Gene Ontology analysis on differentially expressed genes was done using DAVID.23
Fluorescence microscopy
Cells were imaged with an inverted microscope (Olympus IX-71, Tokyo, Japan) using a 1.20 N.A., 60×, water-immersion objective (UPlanSApo 60×/1.20 w, Olympus) equipped with an EMCCD camera (DU-888E, Andor). DAPI (50 μM, 30 min, #10236276001, Sigma-Aldrich) was used to stain the nucleus.Transmission electron microscopy (TEM) for cellular imaging
A549 cells were incubated with TiO2 NPs (800 μg mL−1, 37 °C for 1 h or 24 h and 4 °C for 10 min). Cells were processed and imaged by the Electron Microscopy Laboratory, Department of Pathology, Duke University. Thin cell sections for analysis were obtained from A549 cells fixed with 3% glutaraldehyde (#16220, Electron Microscopy Sciences, Hatfield, PA) in 0.1 M sodium cacodylate (#12300, Electron Microscopy Sciences). Samples were washed three times with 0.1 M cacodylic acid buffer and post-stained with 1% osmium tetroxide (#19190, Electron Microscopy Sciences, Hatfield, PA) in cacodylic buffer for 1 h. Cells were embedded in 1% agarose (#V2111, Promega Corporation, Madison, WI). The agarose containing the cell sample was pre-stained with 1% uranyl acetate (#22400, Electron Microscopy Sciences, Hatfield, PA) overnight at 4 °C. The samples were dehydrated using acetone. Infiltration was done using the Epon embedding kit (#14120, Electron Microscopy Sciences, Hatfield, PA). Samples were sectioned (60–70 nm) using an ultramicrotome (Ultracut E, Reichert/Leica, Wetzlar, Germany). The sections were stained with 2% uranyl acetate in 50% ethanol for 30 min and SATO's lead stain for 1 min. Samples were then imaged on a TEM (80 kV, C12, Philips, Andover, MA). 12–18 images were collected at each time point: representative images are shown.Results and discussion
NP characterization
The TiO2 NPs used for experiments have a primary particle size of ∼21 nm and consist of a mixture of 80% anatase and 20% rutile crystal phases (values provided by Sigma-Aldrich). Dynamic light scattering (DLS, 3 distinct samples; Table 1) and transmission electron microscopy (TEM, Table 1, a TEM image of this sample was published previously)24 show that the individual particles are fused into larger aggregates or agglomerates that are not separable by sonication. While DLS is not a perfect measurement of these non-spherical NPs, it does provide a comparison to other published values. The TEM diameter was measured along the long axis. Hydrodynamic diameter (dh) and TEM-measured diameter are in agreement; 410 ± 24 nm and 378 ± 50 nm, respectively. The TiO2 NPs have a zeta potential (ZP) of −21 ± 5 mV. Carboxylate-modified polystyrene NPs, which do not produce ROS and do not lead to oxidative stress,15,24 were used for comparison in many experiments. These NPs have a similar diameter (dh = 307 ± 2 nm; TEM d = 241 ± 77 nm) and are also negatively charged (ZP = −36 ± 5 mV). A TEM image of the polystyrene NPs is provided in ESI (Fig. S1†).| NPs | dh (nm) | PDI | ZP (mV) | TEM (nm) |
|---|---|---|---|---|
| TiO2 NPs #718467 | 410 ± 24 | 0.44 ± 0.03 | −21 ± 5 | 378 ± 50 |
| n = 20 | ||||
| PS NPs #F8806 | 307 ± 2 | 0.10 ± 0.02 | −36 ± 0.5 | 241 ± 77 |
| n = 50 |
Changes in gene expression in response to TiO2 NPs
3-(4,5-Dimethylthiazol-2-yl)-2,5-diphenyltetrazolium bromide (MTT) assays were used to determine a sub-cytotoxic working concentration of TiO2 NPs for subsequent experiments. Our goal was to examine the cellular response to TiO2 NPs at a NP concentration at which cells appear healthy based on a standard viability assay. The use of sub-cytotoxic concentrations allows a focus on the mechanism of cellular response rather than cell death. At a concentration of 5400 μg mL−1 (24 h, 37 °C), a 24% ± 8% decrease in MTT activity was observed (Fig. 1), which we defined as measurable cytotoxicity. We then worked at a 10-fold lower concentration (540 μg mL−1), at which no cytotoxicity was observed (Fig. 1). MTT assays were carried out in 12-well plates. For other cell culture formats (35 mm dishes, T-25 flasks), NP concentrations were scaled to maintain the same ratio of NPs![[thin space (1/6-em)]](https://www.rsc.org/images/entities/char_2009.gif) :cells.
:cells.
 | ||
| Fig. 1 MTT assays were used to determine a sub-cytotoxic TiO2 NP dose by measuring cell viability following TiO2 NP incubation (24 h, 37 °C). Experiments were carried out in triplicate. Error bars show standard deviations. *p < 0.05, non-significant comparisons are not shown. | ||
While these TiO2 NPs are fairly large (dh = 410 ± 24 nm), TEM shows rapid internalization of the TiO2 NPs (800 μg mL−1, T-25 flask) into large (3–5 μm) vacuoles following a 1 h incubation and a 24 h incubation at 37 °C (Fig. 2). Previous work using similarly sized TiO2 NPs (dh = 348.9 nm) and flow cytometry also showed internalization into CHO cells following an 8 h incubation.13 No TiO2 NP uptake into A549 cells was observed following a 10 min incubation at 4 °C (Fig. 2), referred to as “cold-binding.”
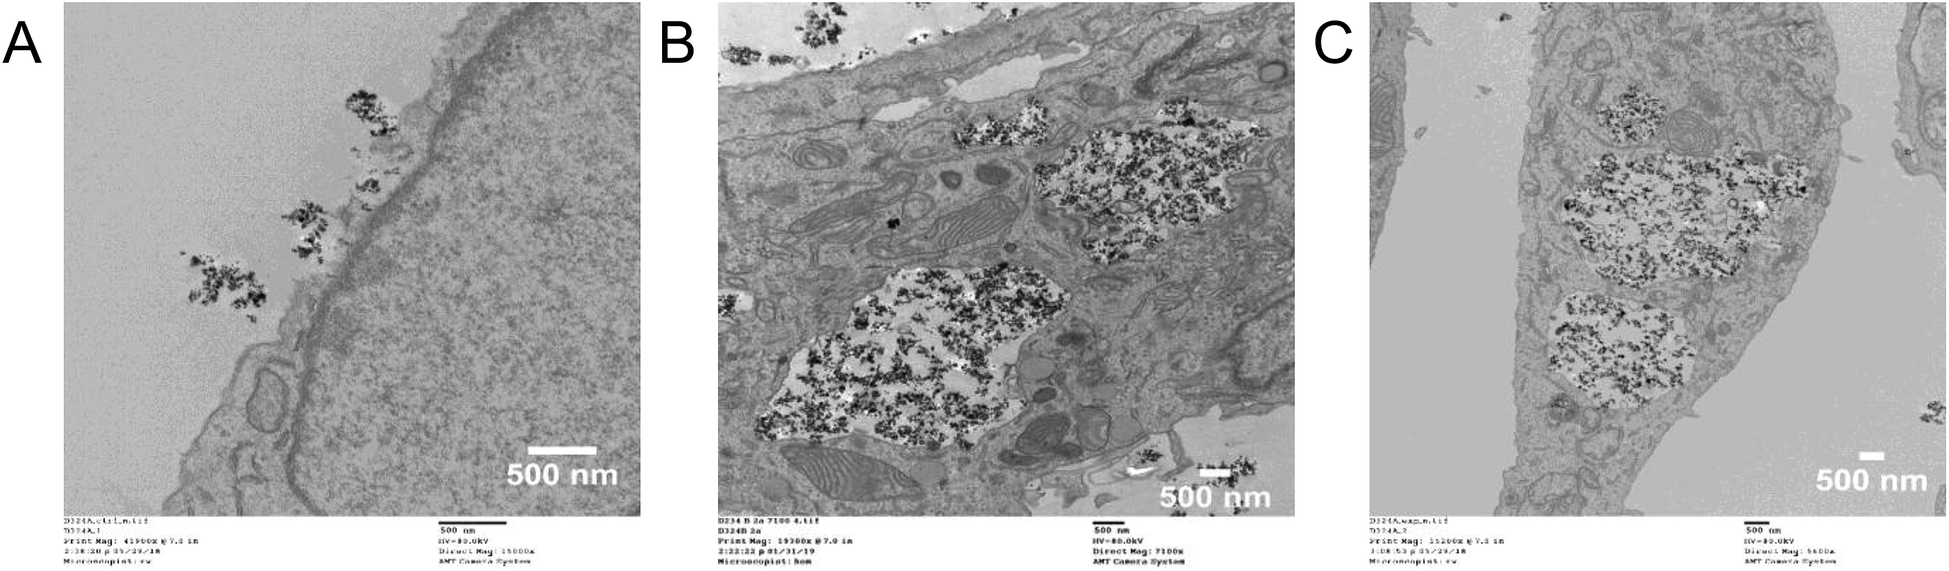 | ||
| Fig. 2 Internalization of TiO2 NPs observed by TEM. A549 cells were incubated with TiO2 NPs (800 μg mL−1, T-25 flasks). (A) Cold-binding (4 °C for 10 min). (B) 1 h incubation at 37 °C. (C) 24 h incubation at 37 °C. In addition to internalization into large (3–5 μm) vacuoles, the TiO2 NPs were also observed associated with myelin-like figures (Fig. S2†). | ||
Previous work has shown that TiO2 NPs, at similarly non-cytotoxic concentrations, lead to oxidative stress in cells (HeLa, BS-C-1).24 These previous experiments focused on oxidative stress-related genes using PCR arrays and Western blotting. To observe the global response of A549 cells to TiO2 NPs, RNA-Seq was used to measure changes in gene expression across the genome. Following a 24 h incubation with TiO2 NPs (800 μg mL−1, T-25 flasks), RNA was isolated and submitted for sequencing. Cells analyzed after this 24 h exposure are defined as Generation 1 cells (G1), representing an acute exposure. Our RNA-Seq analysis indicates 2223 genes are altered (>two-fold change, p < 0.05, compared to an untreated control, n = 3) by this initial exposure to TiO2 NPs (Fig. 3) when compared with untreated control cells. Activated genes include those related to inflammatory response, cell surface signaling, and extracellular organization. Genes that control cell cycle were silenced.
 | ||
| Fig. 3 Global transcriptional changes in response to sub-cytotoxic TiO2 NP exposure. Gene expression profiling of Generation 1 (G1) cells following 24 h of TiO2 NP exposure. Hierarchical clustering (left) and gene ontology (right) analyses of differentially expressed genes (DEGs) that had expression changes greater than 2-fold (p < 0.05, n = 3) are shown. Among the DEGs at Generation 1, 1547 were upregulated and 676 genes were downregulated. | ||
Progeny cell response to TiO2 NPs
In addition to the acute transcriptional response after 24 h of TiO2 NP exposure (Fig. 3), we were also interested in expression changes inherited by progeny cells, as these changes are more indicative of the stabilization of cell phenotype and behaviors contributing to the adaptation of cells to the environment. Identifying the long lasting changes inherited by the progeny cells and characterizing their adapted responses will lead to a better understanding of the effects of sub-cytotoxic NP exposure. We developed a protocol to track expression changes as a function of exposure time including a “re-challenge.” Cells treated with TiO2 NPs for 24 h are referred to as “Generation 1” (G1). After 9 more days in culture, including 3 passages, TiO2 NPs are no longer visible on these 10th generation cells (G10) due to the multiple trypsin treatments for passaging. Any internalized TiO2 NPs, having been diluted through cell division, are present at unobservable concentrations. To assess differentially expressed genes (DEGs) at Generation 10, we compared gene expression (RNA-Seq) at Generation 10 to an untreated control, also at Generation 10, to account for any passage-dependent changes. Examination of DEGs at Generation 1 and Generation 10 identifies the common and distinct features of expression changes caused by TiO2 NP in parental and progeny cells. The Generation 10 cells were also tested for a response to a second TiO2 NP incubation (24 h, 37 °C), identical to the initial exposure, referred to as “re-challenge” (ReC). As with the other RNA-Seq experiments, the re-challenge experiments used matched passage numbers and biological triplicates.In comparison to the >2000 genes altered by the initial TiO2 NP exposure, the response at Generation 10 was muted with only 34 genes altered (>two-fold change, p < 0.05, compared to an untreated control also at Generation 10). Of these 34 genes, 9 genes were also identified as altered in Generation 1 cells (Fig. 4). Interestingly, all of these 9 genes have been shown to be epigenetically regulated, including TM4SF20,25 UNC13a,26 MMP2,27 NPTX1,28 C15orf48,29 CDCP1,30 VGF,31 MUC5AC and MUC5B.32 While many genes in the genome are epigenetically regulated, the enrichment of these genes in Generation 10 DEGs (9 of 34 genes, 26%), suggests TiO2 NP exposure may regulate epigenetic modification. A survey of the epigenetic modifiers in the differentially expressed genes at Generation 1 (Table 2) indicated that histone deacetylases HDAC9, HDAC10, and histone acetylases HAT1, KAT2A and ESCO2 are all altered more than two-fold (p < 0.05), suggesting that TiO2 NP exposure leads to marked changes in the histone acetylation pattern, which could result in activation and silencing of their specific target genes.
 | ||
| Fig. 4 Common gene expression changes in Generation 1 (G1, left) and Generation 10 (G10, right) cells, compared to their respective untreated controls at the same passage number. Gene names and their fold change lines are labelled with corresponding colors. | ||
| Epigenetic modifiers | FC |
|---|---|
| ESCO2 | −2.3 |
| HAT1 | −2.3 |
| HDAC9 | −2.0 |
| KAT2A | 2.1 |
| HDAC10 | 2.4 |
The re-challenge at Generation 10 was identical to the initial TiO2 NP treatment (24 h, 37 °C). If the cells have no adaptive response to the initial exposure, we expect a re-challenge response identical to that observed for Generation 1. Instead we observe only 243 genes altered in response to the TiO2 NP re-challenge including changes in genes related to signaling pathways, cell differentiation, metabolic processes, and biosynthesis (Fig. 5). Of these 243 genes, 47% (115 genes) were also identified as altered at Generation 1 and 6% (16 genes) were altered at Generation 10. The other 48% of altered genes are unique to the re-challenge.
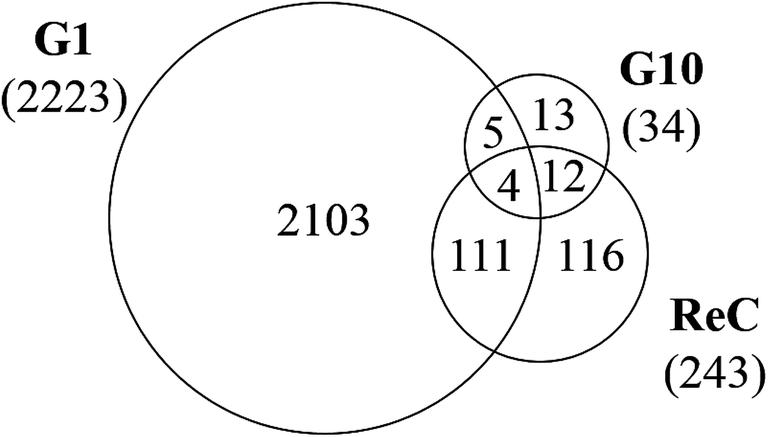 | ||
| Fig. 5 Venn diagram showing overlap of differentially expressed genes (DEG, >2-fold change, p < 0.05, n = 3) at G1, G10, and following the re-challenge at G10 (ReC). Each generation of cells is normalized against untreated controls (n = 3) at the same passage number to account for passage-dependent changes. The numbers in parentheses show the total number of DEGs for each generation. | ||
Interestingly, all 16 differentially expressed genes of greater than two-fold change that are common to the Generation 10 and re-challenged cells had similar or higher fold changes in the re-challenged cells compared with Generation 10 cells (Fig. 6), forming two clusters of genes; UpUp (upregulated in both G10 and ReC cells) and DownDown (downregulated in both G10 and ReC cells) genes. Gene ontology analysis of these two clusters of genes indicated upregulated genes are enriched in intercellular signaling transduction, membrane docking, and endogenous stimuli, while silenced genes are enriched in signal release, regulation of secretion, and exocytosis (Fig. S3†). These results suggest that repeated TiO2 NP exposure augmented adaptive differentially expressed genes and enhanced pathways of internal cell signaling, but reduced secretion and cell–cell communication, which in turn may lead to the increased resistance, observed as the dampened gene expression alteration of Generation 10 cells when re-challenged by TiO2 NPs compared to the Generation 1 cells.
 | ||
| Fig. 6 Common gene expression changes in Generation 10 (G10, left) and re-challenged (ReC, right) cells, compared to their respective untreated controls at the same passage number. Gene names and their fold change lines are labelled with corresponding colors. | ||
Examination of the 115 differentially expressed genes common to Generation 1 and the re-challenged cells revealed that oxidative metabolism, electron transport, the respiratory chain complex, and metabolic process gene function are enriched (Fig. 7). These results support our previous findings that TiO2 NPs cause cellular oxidation without UV exposure.15,24,33
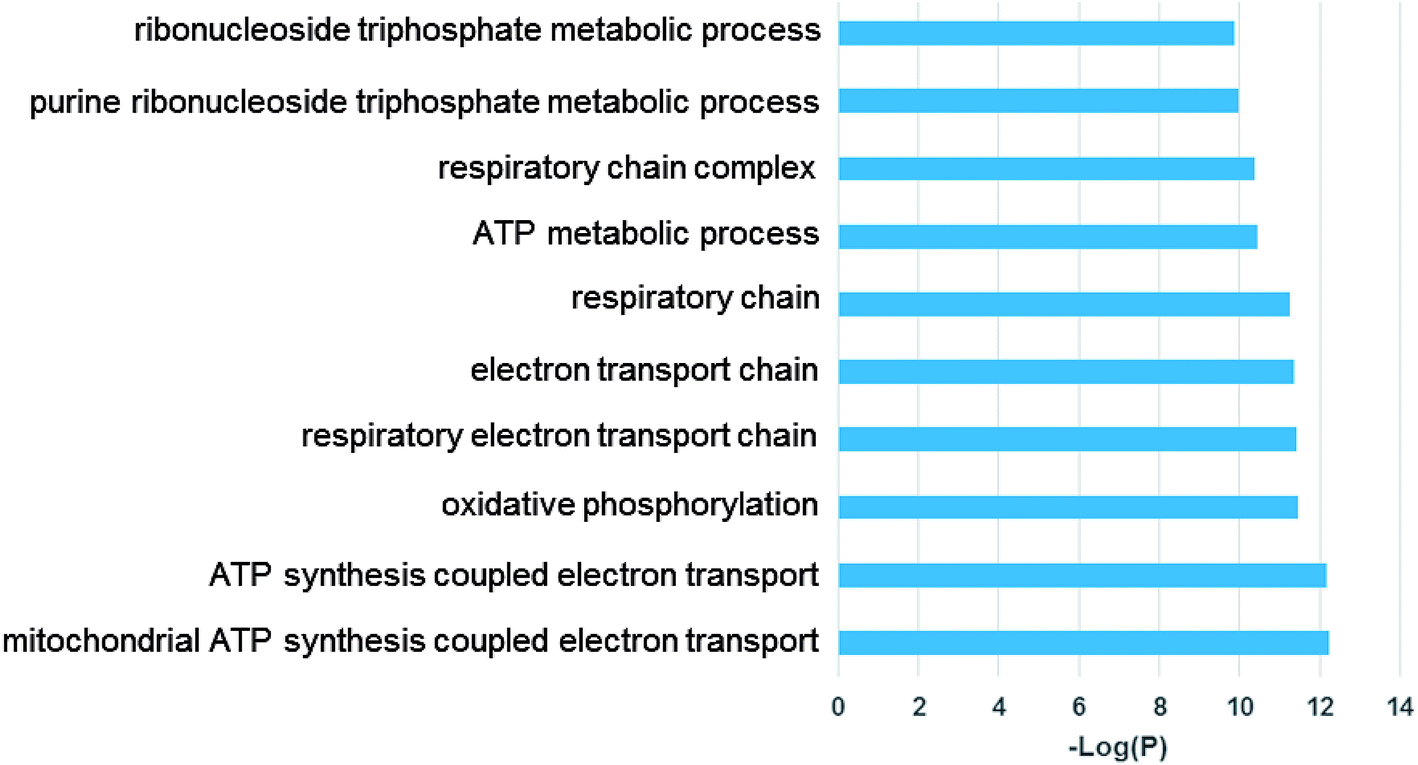 | ||
| Fig. 7 Gene ontology (GO) analysis of common differentially expressed genes of Generation 1 and re-challenged cells. Top enriched GO terms are shown. | ||
Analysis of the RNA-Seq data for Generation 1, Generation 10, and re-challenged cells identified oxidative stress-related genes with greater than two-fold change upon TiO2 NP exposure (Table 3; p < 0.05, compared to an untreated control).
| Oxidative stress-related DEGs | FC | |
|---|---|---|
| G1 | SEPP1 | −2.5 |
| BNIP3 | −2.1 | |
| PRDX3 | −2.1 | |
| HSPA1A | 2 | |
| APOE | 2.7 | |
| SPINK1 | 2.9 | |
| DUSP1 | 2.9 | |
| G10 | GPX2 | −2.4 |
| ReC | SQSTM1 | 2.2 |
| DHCR24 | 3 | |
Our previous PCR experiments using human cervical cancer cells (HeLa) demonstrated that 4 members of the peroxiredoxin family (PRDX 1, 3, 4, 5)34–36 of anti-oxidant enzymes were altered in response to TiO2 NP incubation (24 h, sub-cytotoxic).24 Similarly, the RNA-Seq analysis of the A549 cells demonstrated decreased gene expression for PRDX 1, 3, and 6 (−1.65, −2.05, −1.37, respectively, p < 0.01) in response to TiO2 NP incubation (Table S2†), with changes slightly less than the two-fold cutoff used for screening in the results described above. The slight difference in the peroxiredoxin response in HeLa cervical cancer cells and the A549 lung cells used in these experiments suggests possible cell-type variation.
Intracellular ROS
H2DCFDA, a fluorogenic fluorescein derivative that is enzymatically deacetylated within the cell to H2DCF and then converted to a fluorescent form through oxidation by all forms of ROS, was used to image ROS in A549 cells at Generation 1 and 10. Untreated, control, cells show no fluorescent signal (Fig. 8A). Incubation with TiO2 NPs (994 μg mL−1, 24 h, 37 °C; Generation 1) leads to a diffuse fluorescent signal throughout the cytosol (Fig. 8B). The ratio of NPs to cells was kept constant for all experiments (MTT assays, RNA-Seq, fluorescence and electron microscopy) based on the number of cells forming a confluent monolayer in 35 mm optical dishes, 12-well plates, or T-25 cell culture flasks. Similar H2DCF fluorescence was observed with HeLa cells at Generation 1 (Fig. S4†). Co-incubation of TiO2 NPs with Trolox (0.5 mM), a general ROS scavenger, inhibited fluorescence (Fig. 8C). Incubation with polystyrene NPs (40 pM, 24 h, 37 °C) did not result in a fluorescent signal (Fig. 8D). At Generation 10, no fluorescent signal was visible (Fig. S5†). To determine the type of ROS responsible for the positive signal, we compared images obtained with TiO2 NP co-incubated with either catalase (50 U mL−1), a H2O2 scavenger, or superoxide dismutase (SOD, 50 U mL−1), a superoxide scavenger (Fig. 8E and F). Catalase did not inhibit fluorescence. This catalase treatment successfully inhibited H2O2-induced oxidation of H2DCF under identical conditions (Fig. S6†). SOD did inhibit fluorescence suggesting superoxide, and not H2O2, is responsible for the intracellular oxidation of H2DCF.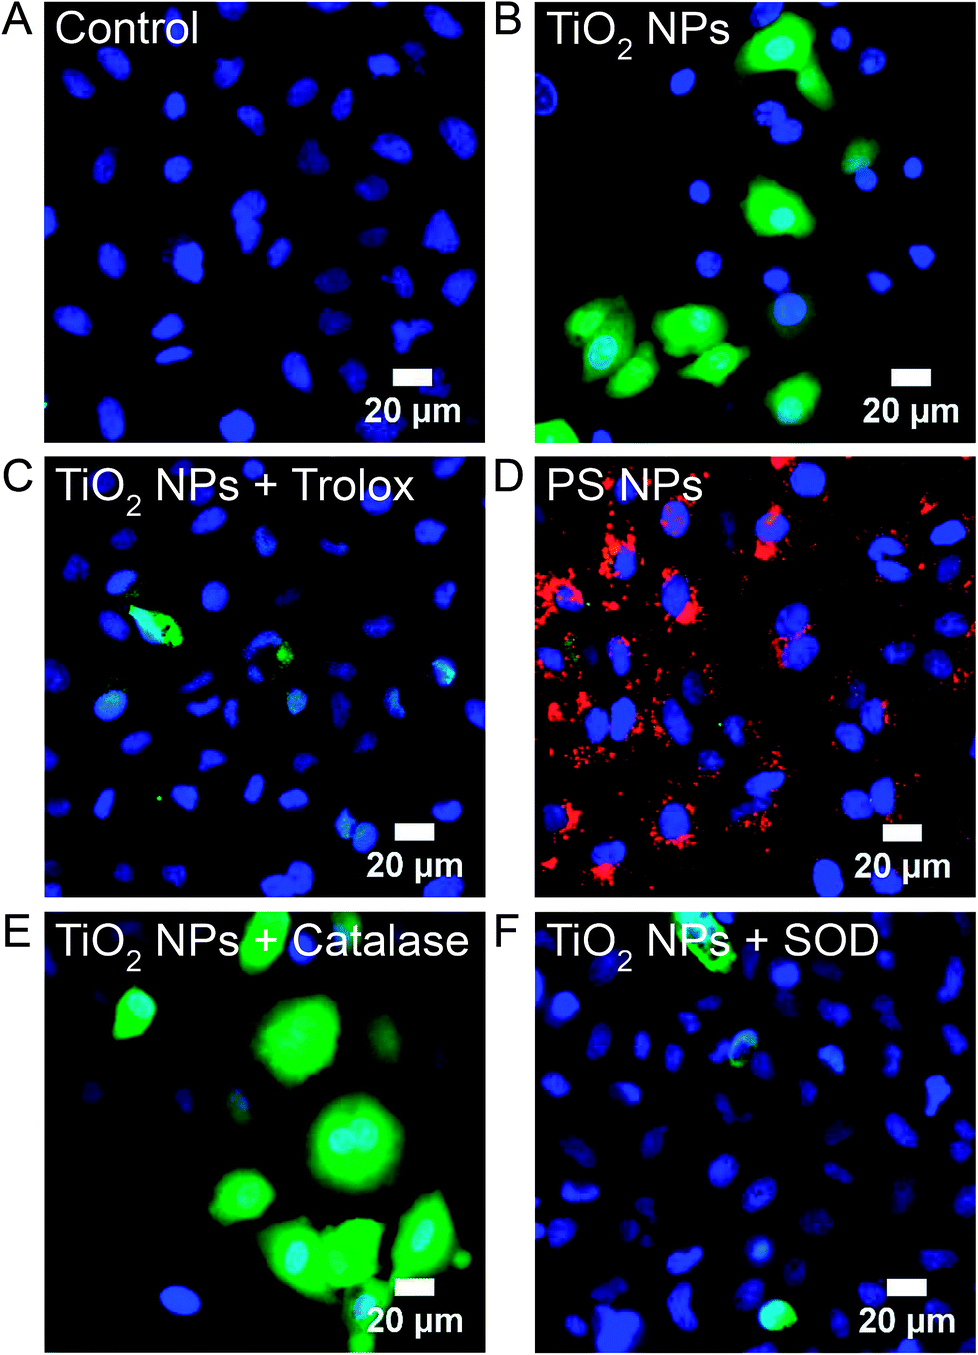 | ||
| Fig. 8 H2DCF, a non-specific probe of intracellular ROS, was used to image ROS in Generation 1 and 10 A549 cells. H2DCFDA (5 μM) was incubated with cells for 30 min prior to imaging and then rinsed with PBS. (A) Untreated control cells. (B) TiO2 NP-treated cells (994 μg mL−1, 24 h, 37 °C; Generation 1). No H2DCF signal was observed at Generation 10 (Fig. S5†) and all subsequent images are at Generation 1. (C) Co-incubation of TiO2 NPs (994 μg mL−1, 24 h, 37 °C) with Trolox (0.5 mM), a general ROS scavenger. (D) Incubation with polystyrene (PS) NPs (red, 40 pM, 24 h, 37 °C). (E) Co-incubation of TiO2 NPs (994 μg mL−1, 24 h, 37 °C) with catalase (50 U mL−1), a H2O2 scavenger. H2O2 was used as a positive control (Fig. S6†). (F) Co-incubation of TiO2 NPs (994 μg mL−1, 24 h, 37 °C) with SOD (50 U mL−1), a superoxide scavenger. DAPI (blue) was used to label nuclei (50 μM, 30 min). | ||
The observation that superoxide dismutase (SOD), but not catalase, inhibits the H2DCF cellular response to TiO2 NPs, suggests the importance of superoxide and the lack of role for H2O2. Superoxide in the cytosol can be detected using dihydroethidium (DHE), which is oxidized specifically by superoxide to form 2-hydroxyethidium. 2-Hydroxyethdium is red-fluorescent when intercalated with DNA. DHE (10 μM) was incubated with cells for 30 min prior to imaging and then rinsed with clear Minimum Essential Medium (MEM). Untreated control cells show a dim red fluorescent background with some punctate spots, likely mitochondria (Fig. 9A). In comparison, TiO2 NP-treated cells (994 μg mL−1, 24 h, 37 °C) show a bright red nuclear signal (Fig. 9B). Co-incubation of TiO2 NPs (994 μg mL−1, 24 h, 37 °C) with SOD (50 U mL−1) inhibited DHE fluorescence (Fig. 9C). Incubation with polystyrene NPs (40 pM, 24 h, 37 °C) did not result in a DHE signal (Fig. 9D). Similarly, cold-bound TiO2 NPs (994 μg mL−1, 10 min, 4 °C), which are not internalized (Fig. 2), did not result in a DHE signal (Fig. S7†).
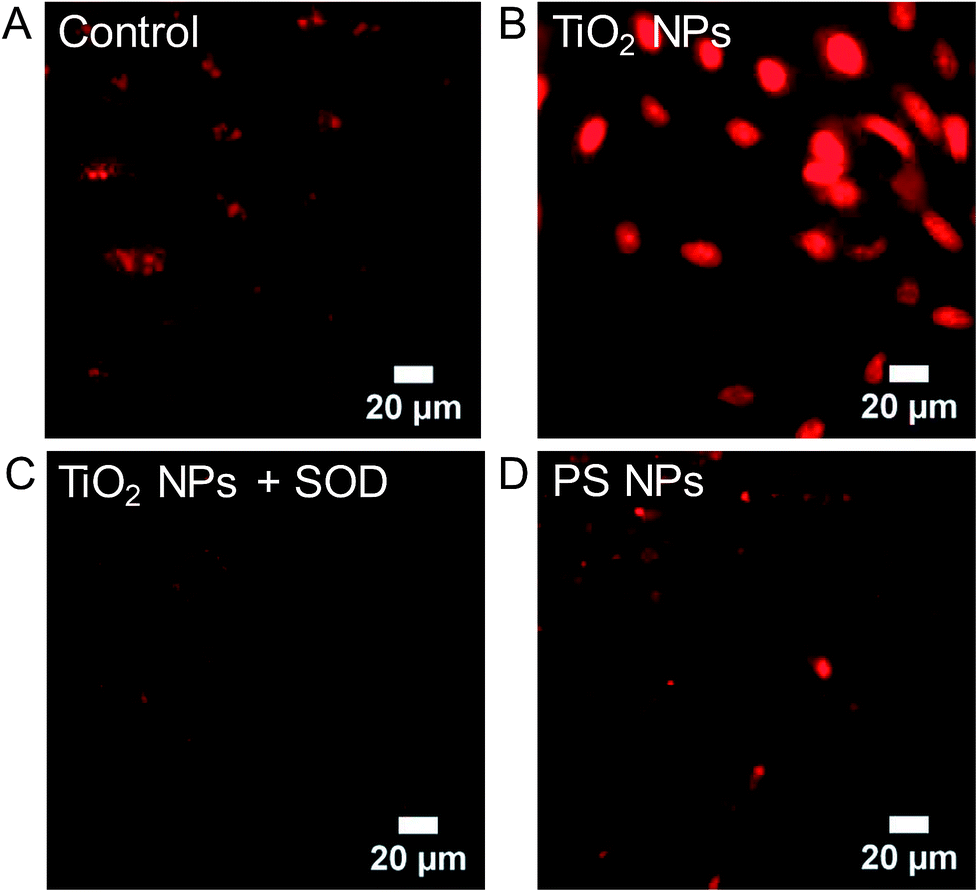 | ||
| Fig. 9 Dihydroethidium (DHE) was used to image superoxide in Generation 1 A549 cells. DHE (10 μM) was incubated with cells for 30 min prior to imaging and then rinsed with clear MEM. (A) Untreated control cells. (B) TiO2 NP-treated cells (994 μg mL−1, 24 h, 37 °C). (C) Co-incubation of TiO2 NPs (994 μg mL−1, 24 h, 37 °C) with SOD (50 U mL−1), a superoxide scavenger. (D) Incubation with polystyrene (PS) NPs (40 pM, 24 h, 37 °C). Cold-bound TiO2 NPs (994 μg mL−1, 10 min, 4 °C) did not result in a DHE signal (Fig. S7†). | ||
The detection of superoxide raises the question of changes in gene expression of superoxide dismutase, specifically cytosolic SOD1.37,38 Oxidative stress-related genes were surveyed using a two-fold cutoff (Table 3). Searching specifically for SODs (Table S2†) showed that SOD1 is decreased (−1.82, p < 0.01) at Generation 1 and at the re-challenge (−1.31, p < 0.01). There was no significant change at Generation 10. SOD2, localized in the mitochondria, and extracellular SOD3 were not altered (Table S2†).
Conclusions
We observe that the incubation of human lung cells, in the dark, with low, non-cytotoxic (Fig. 1), concentrations of TiO2 NPs leads to significant (>2000 differentially expressed genes) changes in gene expression (Fig. 3 and 5, Table S1†). Following this initial acute exposure, the response dissipates with only 34 differentially expressed genes at the Generation 10 (Fig. 4 and 5). However, the cells appear to adapt to this initial exposure, observed when re-challenged with a second TiO2 NP treatment (Fig. 5–7). The specific genes that are altered include epigenetic modifiers (Table 2) that may produce this response in their target genes. The response to TiO2 NP exposure appears to be carried through multiple generations of cells suggesting long-term implications of TiO2 NP exposure.Prior to these changes in gene expression is the production of intracellular ROS (Fig. 8), specifically superoxide (Fig. 9) along with changes in oxidative stress-related genes (Tables 3 and S2†). Co-incubation of cells with TiO2 NPs and ROS scavengers, Trolox, catalase, and SOD, confirms that the cellular response is specific to superoxide (Fig. 8C, E, F and 9C). Additionally, the cellular response is specific to TiO2 NPs and is not observed following incubation with polystyrene NPs (Fig. 8D and 9D). Previous cell-free assays (nitro blue tetrazolium) showed that these TiO2 NPs produced low levels of superoxide.15 The intracellular superoxide observed with the DHE assays (Fig. 9) is possibly a combination of direct superoxide production by the TiO2 NPs and cellular generation from NOXs on organelle membranes and mitochondrial leakage.39–41 SOD1, localized in the cytosol,37,38 is decreased following the acute exposure of Generation 1 and with the re-challenge. Generation 10 cells show no change in SOD1.
Overall, our experiments show that low levels of TiO2 NPs lead to unexpected cellular outcomes including ROS exposure and changes in gene expression signatures. Interestingly, recent work has shown that trout cells exposed to lithium cobalt oxide NPs, present in lithium ion batteries, have increased levels of ROS,42 measured with H2DCF imaging and flow cytometry, and increased expression of genes related to superoxide,43 suggesting that the superoxide response may be general to metal oxide NPs. In addition, macrophage cells (RAW 264.7) incubated with SiO2, Fe3O4, and CoO NPs show a responses to oxidative stress at sub-cytotoxic concentrations of NPs,44 suggesting that cytotoxicity alone is an insufficient indicator of the long-term effects of human exposure. Similar concerns regarding the measurement, standardization, modeling, and mitigation of cytotoxicity have been described for other inorganic nanoparticles; gold, iron oxide, and quantum dots.45,46 Taken together, these results further demonstrate that a full description of the cellular response to NPs must take into account ROS and oxidative stress,47,48 changes in gene expression,43,44 and the long-term effect on progeny cells.
Conflicts of interest
The authors declare no conflict of interest.Acknowledgements
The authors thank NIEHS for support of this research (1R56ES026612), Sabiha Runa and Gregory Whyte for assistance with initial experiments, and Dr Ricardo Vancini for assistance with TEM (Electron Microscopy Laboratory, Duke Pathology, Duke University School of Medicine).References
- Occupational Exposure to Titanium Dioxide, Centers for Disease Control and Prevention and National Institute for Occupational Safety and Health, 2011 Search PubMed.
- U. S. Department of the Interior and U. S. Geological Survey, Mineral Commodity Summaries 2019, Washington D.C., 2019 Search PubMed.
- OSHA Fact Sheet: Working safely with nanomaterials, U.S. Department of Labor, Washington D.C Search PubMed.
- N. Otani, S. Ishimatsu and T. Mochizuki, Am. J. Emerg. Med., 2008, 26, 608–611 CrossRef PubMed.
- B. Sha, W. Gao, X. Cui, L. Wang and F. Xu, J. Appl. Toxicol., 2015, 35, 1086–1101 CrossRef CAS PubMed.
- H. B. Shi, R. Magaye, V. Castranova and J. S. Zhao, Part. Fibre Toxicol., 2013, 10, 15 CrossRef CAS PubMed.
- D. Pelclova, V. Zdimal, Z. Fenclova, S. Vlckova, F. Turci, I. Corazzari, P. Kacer, J. Schwarz, N. Zikova and O. Makes, J. Occup. Environ. Med., 2016, 73, 110–118 CrossRef CAS PubMed.
- A. L. Linsebigler, G. Lu and J. T. Yates Jr, Chem. Rev., 1995, 95, 735–758 CrossRef CAS.
- A. Fujishima, X. Zhang and D. A. Tryk, Surf. Sci. Rep., 2008, 63, 515–582 CrossRef CAS.
- U. Diebold, Surf. Sci. Rep., 2003, 48, 53–229 CrossRef CAS.
- C. M. Sayes, R. Wahi, P. A. Kurian, Y. P. Liu, J. L. West, K. D. Ausman, D. B. Warheit and V. L. Colvin, Toxicol. Sci., 2006, 92, 174–185 CrossRef CAS PubMed.
- J.-R. Gurr, A. S. Wang, C.-H. Chen and K.-Y. Jan, Toxicology, 2005, 213, 66–73 CrossRef CAS PubMed.
- Y. Toduka, T. Toyooka and Y. Ibuki, Environ. Sci. Technol., 2012, 46, 7629–7636 CrossRef CAS PubMed.
- E. Huerta-García, I. Zepeda-Quiroz, H. Sánchez-Barrera, Z. Colín-Val, E. Alfaro-Moreno, M. Ramos-Godinez and R. López-Marure, Molecules, 2018, 23, 1955 CrossRef PubMed.
- D. T. Jayaram, S. Runa, M. L. Kemp and C. K. Payne, Nanoscale, 2017, 9, 7595–7601 RSC.
- C. A. Schneider, W. S. Rasband and K. W. Eliceiri, Nat. Methods, 2012, 9, 671 CrossRef CAS PubMed.
- https://www.bioinformatics.babraham.ac.uk/projects/fastqc/.
- https://www.bioinformatics.babraham.ac.uk/projects/trim_galore/.
- A. Dobin, C. A. Davis, F. Schlesinger, J. Drenkow, C. Zaleski, S. Jha, P. Batut, M. Chaisson and T. R. Gingeras, Bioinformatics, 2013, 29, 15–21 CrossRef CAS PubMed.
- S. Anders, P. T. Pyl and W. Huber, Bioinformatics, 2015, 31, 166–169 CrossRef CAS PubMed.
- M. I. Love, W. Huber and S. Anders, Genome Biol., 2014, 15, 550 CrossRef PubMed.
- R. Kolde, pheatmap, 2015 Search PubMed.
- D. W. Huang, B. T. Sherman and R. A. Lempicki, Nat. Protoc., 2008, 4, 44 CrossRef PubMed.
- S. Runa, D. Khanal, M. L. Kemp and C. K. Payne, J. Phys. Chem. C, 2016, 120, 20736–20742 CrossRef CAS.
- K. Yamanoi, E. Arai, Y. Tian, Y. Takahashi, S. Miyata, H. Sasaki, F. Chiwaki, H. Ichikawa, H. Sakamoto and R. Kushima, Carcinogenesis, 2015, 36, 509–520 CrossRef CAS PubMed.
- Z. Duren, X. Chen, R. Jiang, Y. Wang and W. H. Wong, Proc. Natl. Acad. Sci. U.S.A., 2017, 114, E4914–E4923 CrossRef CAS PubMed.
- C. Song, S. Zhu, C. Wu and J. Kang, J. Biol. Chem., 2013, 288, 28021–28033 CrossRef CAS PubMed.
- C. Zhou, Y. Qin, Z. Xie, J. Zhang, M. Yang, S. Li and R. Chen, Biochem. Biophys. Res. Commun., 2015, 458, 381–386 CrossRef CAS PubMed.
- D. S. Kim, W. K. Lee and J. Y. Park, Oncol. Lett., 2018, 16, 2409–2415 Search PubMed.
- J. i. Ikeda, E. Morii, H. Kimura, Y. Tomita, T. Takakuwa, J. I. Hasegawa, Y. K. Kim, Y. Miyoshi, S. Noguchi and T. Nishida, J. Pathol., 2006, 210, 75–84 CrossRef CAS PubMed.
- S. Marwitz, L. Heinbockel, S. Scheufele, D. Nitschkowski, C. Kugler, S. Perner, M. Reck, O. Ammerpohl and T. Goldmann, Clin. Epigenet., 2017, 9, 123 CrossRef PubMed.
- A. Vincent, M. Perrais, J. Desseyn, J. Aubert, P. Pigny and I. Van Seuningen, Oncogene, 2007, 26, 6566 CrossRef CAS PubMed.
- S. Runa, M. Lakadamyali, M. L. Kemp and C. K. Payne, J. Phys. Chem. B, 2017, 121, 8619–8625 CrossRef CAS PubMed.
- J. Fujii and Y. Ikeda, Redox Rep., 2002, 7, 123–130 CrossRef CAS PubMed.
- S. G. Rhee, H. Z. Chae and K. Kim, Free Radic. Biol. Med., 2005, 38, 1543–1552 CrossRef CAS PubMed.
- Z. A. Wood, E. Schroder, J. R. Harris and L. B. Poole, Trends Biochem. Sci., 2003, 28, 32–40 CrossRef CAS PubMed.
- I. N. Zelko, T. J. Mariani and R. J. Folz, Free Radic. Biol. Med., 2002, 33, 337–349 CrossRef CAS PubMed.
- T. Fukai and M. Ushio-Fukai, Antioxid. Redox Signaling, 2011, 15, 1583–1606 CrossRef CAS PubMed.
- J. D. Lambeth, Nat. Rev. Immunol., 2004, 4, 181–189 CrossRef CAS PubMed.
- K. Bedard and K. H. Krause, Physiol. Rev., 2007, 87, 245–313 CrossRef CAS PubMed.
- D. I. Brown and K. K. Griendling, Free Radic. Biol. Med., 2009, 47, 1239–1253 CrossRef CAS PubMed.
- E. S. Melby, Y. Cui, J. Borgatta, A. C. Mensch, M. N. Hang, W. B. Chrisler, A. Dohnalkova, J. M. Van Gilder, C. M. Alvarez and J. N. Smith, Nanotoxicology, 2018, 12, 1166–1181 CrossRef CAS PubMed.
- Y. Cui, E. S. Melby, A. C. Mensch, E. D. Laudadio, M. N. Hung, A. Dohnalkova, D. Hu, R. J. Hamers and G. Orr, Nano Lett., 2019, 19, 1990–1997 CrossRef CAS PubMed.
- J. Duan, V. K. Kodali, M. J. Gaffrey, J. Guo, R. K. Chu, D. G. Camp, R. D. Smith, B. D. Thrall and W.-J. Qian, ACS Nano, 2015, 10, 524–538 CrossRef PubMed.
- S. J. Soenen, P. Rivera-Gil, J.-M. Montenegro, W. J. Parak, S. C. De Smedt and K. Braeckmans, Nano Today, 2011, 6, 446–465 CrossRef CAS.
- M. Henriksen-Lacey, S. Carregal-Romero and L. M. Liz-Marzán, Bioconjugate Chem., 2016, 28, 212–221 CrossRef PubMed.
- T. Xia, N. Li and A. E. Nel, Annu. Rev. Public Health, 2009, 30, 137–150 CrossRef PubMed.
- A. Nel, T. Xia, L. Mädler and N. Li, Science, 2006, 311, 622–627 CrossRef CAS PubMed.
Footnotes |
| † Electronic supplementary information (ESI) available: Sequencing reads summary, TEM of polystyrene NPs and internalized TiO2 NPs, additional GO analysis, H2DCF images with HeLa cells, fluorescence microscopy controls. See DOI: 10.1039/c9ra04037d |
| ‡ Present addresses: Linda E. Kippner: Marcus Center for Therapeutic Cell Characterization and Manufacturing, Georgia Institute of Technology, Atlanta, GA 30318; Po-Yi Ho: Molecular Epidemiology & Bioinformatics Team, Division of Viral Hepatitis, Centers for Disease Control and Prevention (CDC), Atlanta, GA 30329. |
| This journal is © The Royal Society of Chemistry 2019 |